. 2014 Feb 28;289(9):5412-6.
doi: 10.1074/jbc.C113.526475. Epub 2014 Jan 21.

SOD2 to SOD1 switch in breast cancer

Affiliations

SOD2 to SOD1 switch in breast cancer

Luena Papa et al. J Biol Chem. .

Abstract

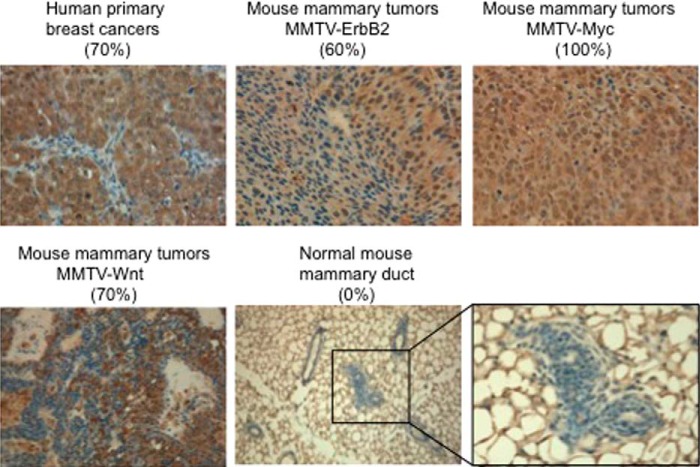
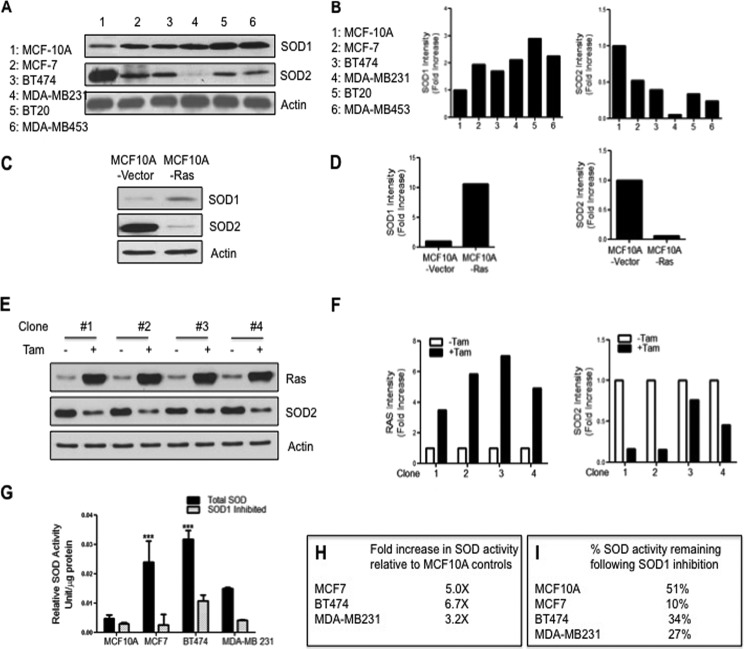
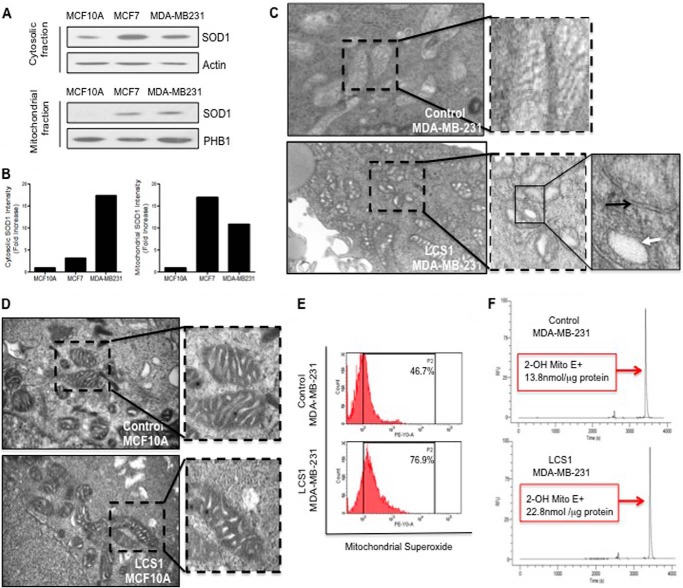
Cancer cells are characterized by elevated levels of reactive oxygen species, which are produced mainly by the mitochondria. The dismutase SOD2 localizes in the matrix and is a major antioxidant. The activity of SOD2 is regulated by the deacetylase SIRT3. Recent studies indicated that SIRT3 is decreased in 87% of breast cancers, implying that the activity of SOD2 is compromised. The resulting elevation in reactive oxygen species was shown to be essential for the metabolic reprograming toward glycolysis. Here, we show that SOD2 itself is down-regulated in breast cancer cell lines. Further, activation of oncogenes, such as Ras, promotes the rapid down-regulation of SOD2. Because in the absence of SOD2, superoxide levels are elevated in the matrix, we reasoned that mechanisms must exist to retain low levels of superoxide in other cellular compartments especially in the intermembrane space of the mitochondrial to avoid irreversible damage. The dismutase SOD1 also acts as an antioxidant, but it localizes to the cytoplasm and the intermembrane space of the mitochondria. We report here that loss of SOD2 correlates with the overexpression of SOD1. Further, we show that mitochondrial SOD1 is the main dismutase activity in breast cancer cells but not in non-transformed cells. In addition, we show that the SOD1 inhibitor LCS-1 leads to a drastic fragmentation and swelling of the matrix, suggesting that in the absence of SOD2, SOD1 is required to maintain the integrity of the organelle. We propose that by analogy to the cadherin switch during epithelial-mesenchymal transition, cancer cells also undergo a SOD switch during transformation.

Keywords: Cancer; Glucose Metabolism; Mitochondria; ROS; Reactive Oxygen Species (ROS); Superoxide Dismutase (SOD).


Figures

FIGURE 1.
FIGURE 1.
SOD1 is overexpressed in breast and mammary cancers. Immunohistochemistry of SOD1 was performed on the indicated tissue sections. The percentage of samples positive for SOD1 staining is shown in each case. A representative image of the staining is shown.
FIGURE 2.
FIGURE 2.
SOD1 is overexpressed in breast cancer cell lines and contributes to the majority of the dismutase activity. A, Western blots of SOD1 and SOD2 in a panel of breast epithelial cell lines. MCF-10A cells are transformed but non-malignant, although all others are breast cancer cell lines. Tubulin was used as a loading control. B, graphs of the quantification of SOD1 and SOD2 levels from Western blots shown in A. C, Western blots of SOD1 and SOD2 in MCF-10A and MCF-10A stable clones expressing the oncogene Ras constitutively. D, graphs of the quantification of SOD1 and SOD2 levels from Western blots shown in C. E, Western blots of SOD1 and SOD2 in four different clones of MCF-10A stable clones expressing Ras upon treatment with tamoxifen (Tam). F, graphs of the quantification of Ras and SOD2 levels from Western blots shown in E. G, total dismutase activity was determined in all indicated cell lines in the presence or absence of pretreatment with the SOD1 inhibitor potassium cyanide at a concentration of 2 mm. Error bars indicate mean ± S.D. ***, p < 0.001. H, table of -fold increase in total SOD activity in breast cancer cell lines relative to MCF-10A control cells. I, table of the percentage of total SOD activity remaining following SOD1 inhibition.
FIGURE 3.
FIGURE 3.
Inhibition of SOD1 results in altered mitochondrial morphology and elevated mitochondrial superoxide. A, Western blots of SOD1 in the cytosolic or mitochondrial fractions of MCF-10A, MCF7, and MDA-MD-231 cells. B, graphs of the quantification of SOD1 and SOD2 levels in the Western blots shown in A. C, electron microscopy of the mitochondria in MDA-MB-231cells treated with vehicle only (DMSO) or the SOD1 inhibitor LCS-1 for 24 h at a dose of 1.0 μm. D, electron microscopy of the mitochondria in MCF-10A treated with vehicle only (DMSO) or the SOD1 inhibitor LCS-1 for 24 h at a dose of 1.0 μm. E, mitochondrial superoxide levels in MDA-MB-231 cells treated with vehicle only (DMSO) or 1.0 μm LCS1 for 48 h. A representative experiment out of three replicates is shown. F, MDA-MB-231 cells were treated as in D, and samples were used for measurement of 2-hydroxyethidium (2-OH Mito E+) levels by HPLC. A representative experiment out of three replicates is shown. Statistical significance was determined using Student's t test.

References

    1. Tao R., Coleman M. C., Pennington J. D., Ozden O., Park S. H., Jiang H., Kim H. S., Flynn C. R., Hill S., Hayes McDonald W., Olivier A. K., Spitz D. R., Gius D. (2010) Sirt3-mediated deacetylation of evolutionarily conserved lysine 122 regulates MnSOD activity in response to stress. Mol. Cell 40, 893–904 - PMC - PubMed
    1. Lu W., Ogasawara M. A., Huang P. (2007) Models of reactive oxygen species in cancer. Drug Discov. Today Dis. Models 4, 67–73 - PMC - PubMed
    1. Bellot G. L., Liu D., Pervaiz S. (2013) ROS, autophagy, mitochondria and cancer: Ras, the hidden master? Mitochondrion 13, 155–162 - PubMed
    1. Finley L. W., Carracedo A., Lee J., Souza A., Egia A., Zhang J., Teruya-Feldstein J., Moreira P. I., Cardoso S. M., Clish C. B., Pandolfi P. P., Haigis M. C. (2011) SIRT3 opposes reprogramming of cancer cell metabolism through HIF1a destabilization. Cancer Cell 19, 416–428 - PMC - PubMed
    1. Radke S., Pirkmaier A., Germain D. (2005) Differential expression of the F-box proteins Skp2 and Skp2B in breast cancer. Oncogene 24, 3448–3458 - PubMed

Publication types

MeSH terms