

FIB-SEM imaging of carbon nanotubes in mouse lung tissue
- PMID: 24448971
- PMCID: PMC4039996
- DOI: 10.1007/s00216-013-7566-x
FIB-SEM imaging of carbon nanotubes in mouse lung tissue
Abstract
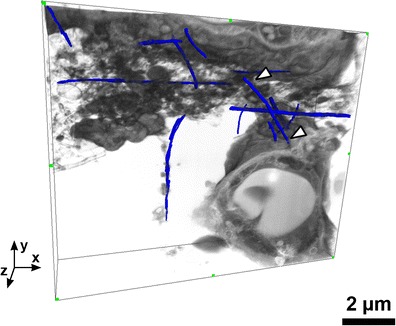
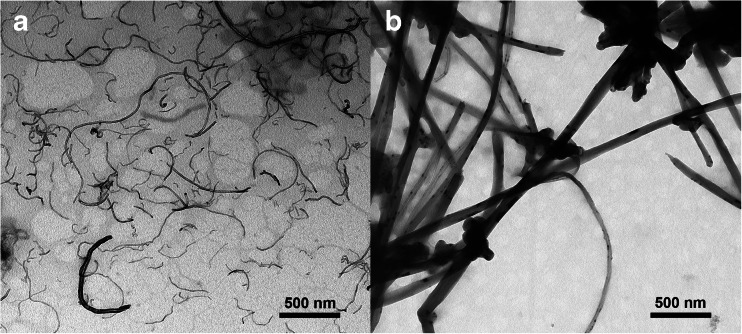
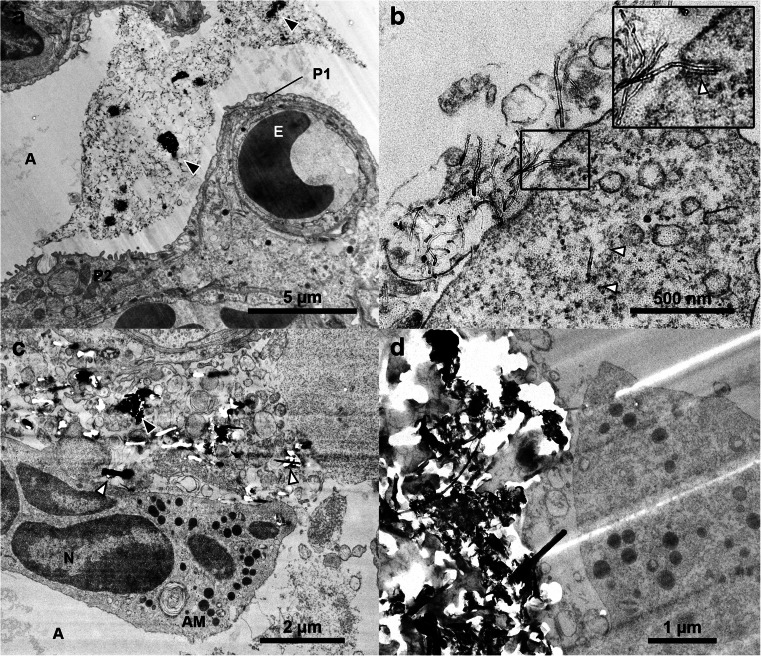
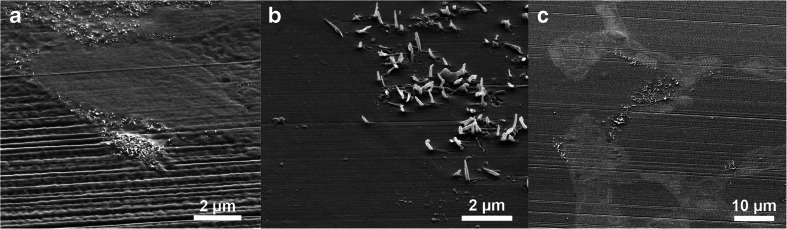
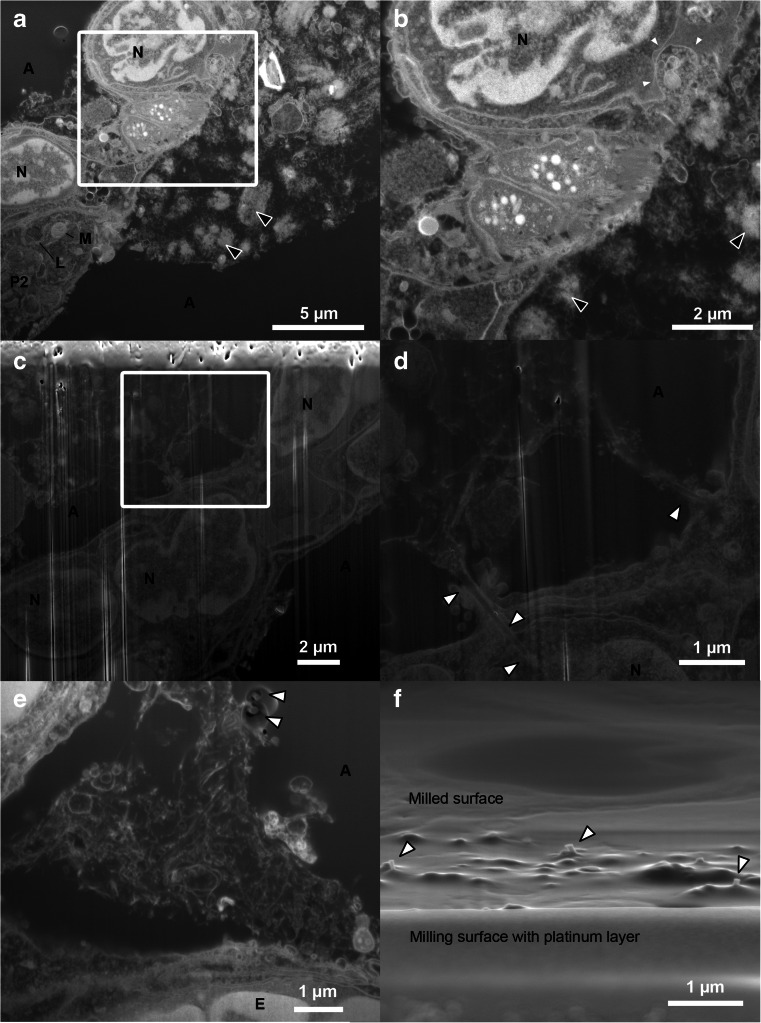
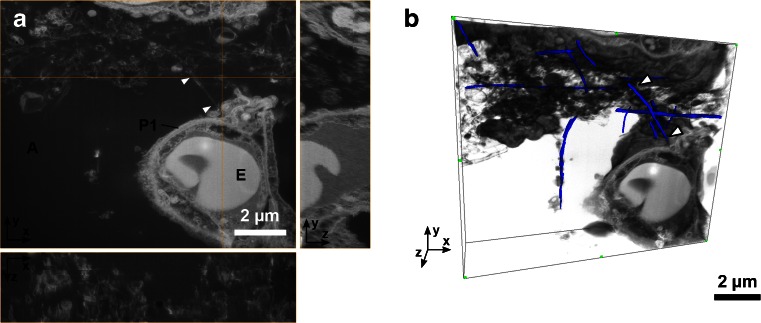
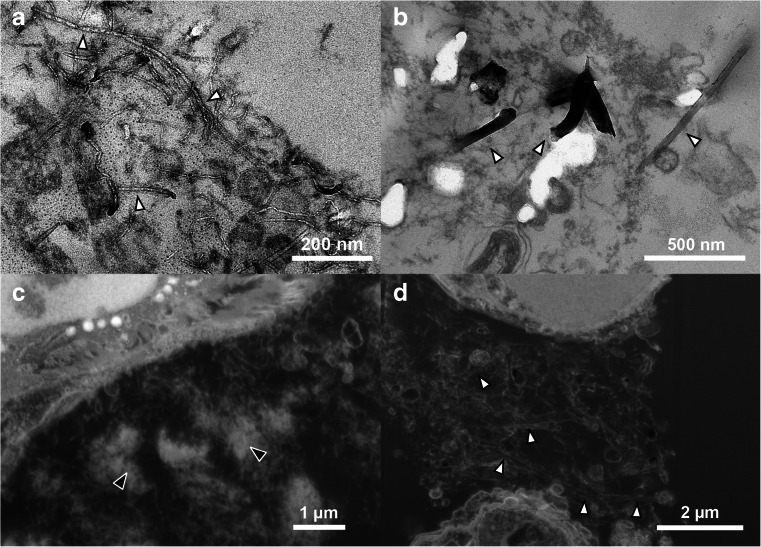
Ultrastructural characterisation is important for understanding carbon nanotube (CNT) toxicity and how the CNTs interact with cells and tissues. The standard method for this involves using transmission electron microscopy (TEM). However, in particular, the sample preparation, using a microtome to cut thin sample sections for TEM, can be challenging for investigation of regions with agglomerations of large and stiff CNTs because the CNTs cut with difficulty. As a consequence, the sectioning diamond knife may be damaged and the uncut CNTs are left protruding from the embedded block surface excluding them from TEM analysis. To provide an alternative to ultramicrotomy and subsequent TEM imaging, we studied focused ion beam scanning electron microscopy (FIB-SEM) of CNTs in the lungs of mice, and we evaluated the applicability of the method compared to TEM. FIB-SEM can provide serial section volume imaging not easily obtained with TEM, but it is time-consuming to locate CNTs in the tissue. We demonstrate that protruding CNTs after ultramicrotomy can be used to locate the region of interest, and we present FIB-SEM images of CNTs in lung tissue. FIB-SEM imaging was applied to lung tissue from mice which had been intratracheally instilled with two different multiwalled CNTs; one being short and thin, and the other longer and thicker. FIB-SEM was found to be most suitable for detection of the large CNTs (Ø ca. 70 nm), and to be well suited for studying CNT agglomerates in biological samples which is challenging using standard TEM techniques.
Figures
Similar articles
-
Time-dependent subcellular distribution and effects of carbon nanotubes in lungs of mice.PLoS One. 2015 Jan 23;10(1):e0116481. doi: 10.1371/journal.pone.0116481. eCollection 2015. PLoS One. 2015. PMID: 25615613 Free PMC article.
-
An introduction to cryo-FIB-SEM cross-sectioning of frozen, hydrated Life Science samples.J Microsc. 2021 Feb;281(2):138-156. doi: 10.1111/jmi.12951. Epub 2020 Aug 24. J Microsc. 2021. PMID: 32737879 Free PMC article.
-
FIB-SEM imaging properties of Drosophila melanogaster tissues embedded in Lowicryl HM20.J Microsc. 2019 Feb;273(2):91-104. doi: 10.1111/jmi.12764. Epub 2018 Nov 12. J Microsc. 2019. PMID: 30417390
-
Cryo-focused-ion-beam applications in structural biology.Arch Biochem Biophys. 2015 Sep 1;581:122-30. doi: 10.1016/j.abb.2015.02.009. Epub 2015 Feb 20. Arch Biochem Biophys. 2015. PMID: 25703192 Review.
-
Cross-sectional sample preparation by focused ion beam: a review of ion-sample interaction.Microsc Res Tech. 1996 Nov 1;35(4):320-33. doi: 10.1002/(SICI)1097-0029(19961101)35:4<320::AID-JEMT3>3.0.CO;2-Q. Microsc Res Tech. 1996. PMID: 8987026 Review.
Cited by
-
Overview about the localization of nanoparticles in tissue and cellular context by different imaging techniques.Beilstein J Nanotechnol. 2015 Jan 23;6:263-80. doi: 10.3762/bjnano.6.25. eCollection 2015. Beilstein J Nanotechnol. 2015. PMID: 25671170 Free PMC article. Review.
-
Volume electron microscopy: analyzing the lung.Histochem Cell Biol. 2021 Feb;155(2):241-260. doi: 10.1007/s00418-020-01916-3. Epub 2020 Sep 17. Histochem Cell Biol. 2021. PMID: 32944795 Free PMC article. Review.
-
The Three-Dimensional Ultrastructure of the Human Alveolar Epithelium Revealed by Focused Ion Beam Electron Microscopy.Int J Mol Sci. 2020 Feb 6;21(3):1089. doi: 10.3390/ijms21031089. Int J Mol Sci. 2020. PMID: 32041332 Free PMC article.
-
Time-dependent subcellular distribution and effects of carbon nanotubes in lungs of mice.PLoS One. 2015 Jan 23;10(1):e0116481. doi: 10.1371/journal.pone.0116481. eCollection 2015. PLoS One. 2015. PMID: 25615613 Free PMC article.
-
Cellular uptake of nanoparticles: journey inside the cell.Chem Soc Rev. 2017 Jul 17;46(14):4218-4244. doi: 10.1039/c6cs00636a. Chem Soc Rev. 2017. PMID: 28585944 Free PMC article. Review.
References
-
- Coleman JN, Khan U, Blau WJ, Gun’ko YK. Small but strong: a review of the mechanical properties of carbon nanotube–polymer composites. Carbon. 2006;44:1624–1652. doi: 10.1016/j.carbon.2006.02.038. - DOI
-
- NIOSH (2013) Current Intelligence Bulletin 65: Occupational Exposure to Carbon Nanotubes and Nanofibers. http://www.cdc.gov/niosh/docs/2013-145/pdfs/2013-145.pdf. Accessed 27 Aug 2013
Publication types
MeSH terms
Substances
LinkOut - more resources
Full Text Sources
Other Literature Sources
Research Materials
