. 2014 Jan 15;28(2):121-6.
doi: 10.1101/gad.230599.113.

Spatial control of phospholipid flux restricts endoplasmic reticulum sheet formation to allow nuclear envelope breakdown

Affiliations

Spatial control of phospholipid flux restricts endoplasmic reticulum sheet formation to allow nuclear envelope breakdown

Shirin Bahmanyar et al. Genes Dev. .

Abstract

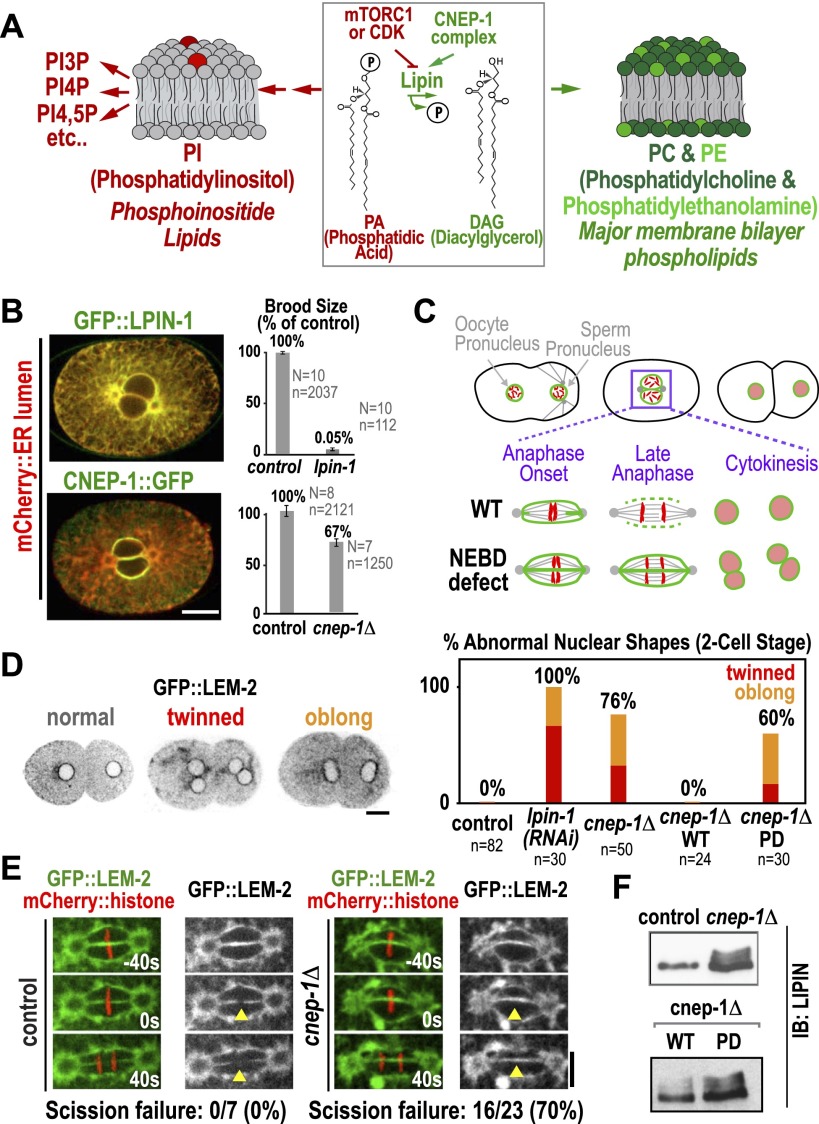
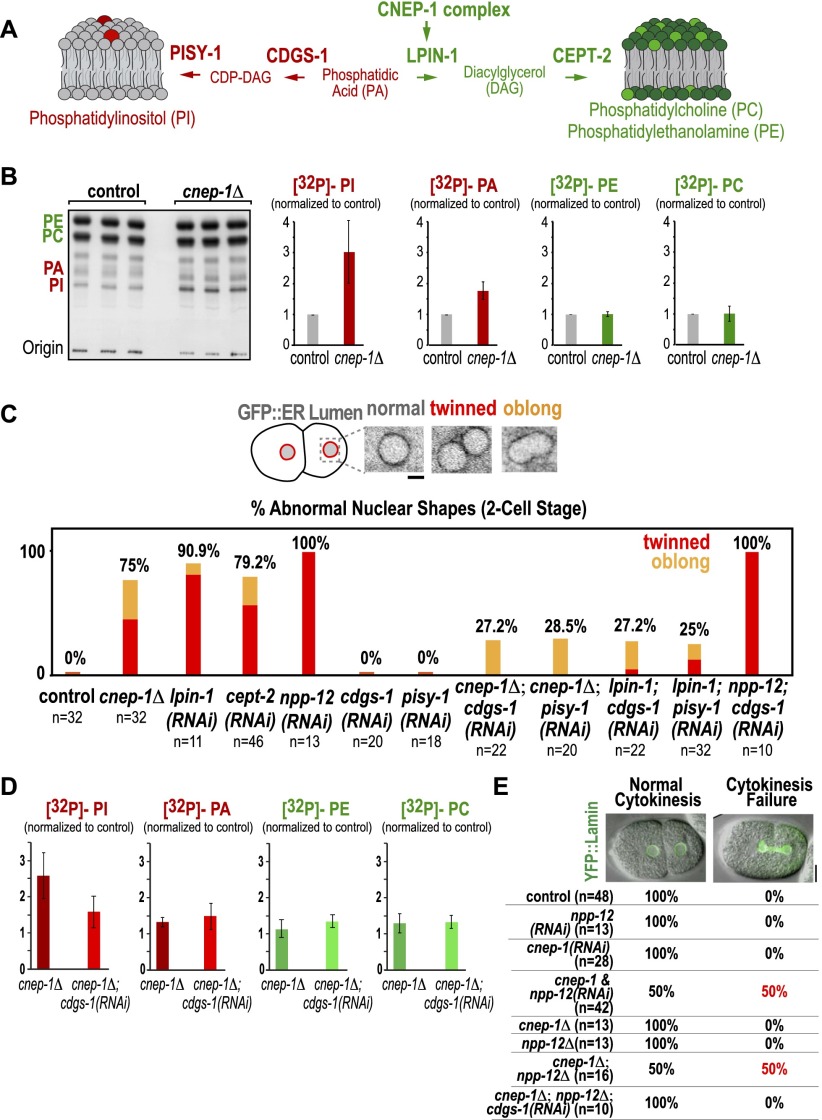
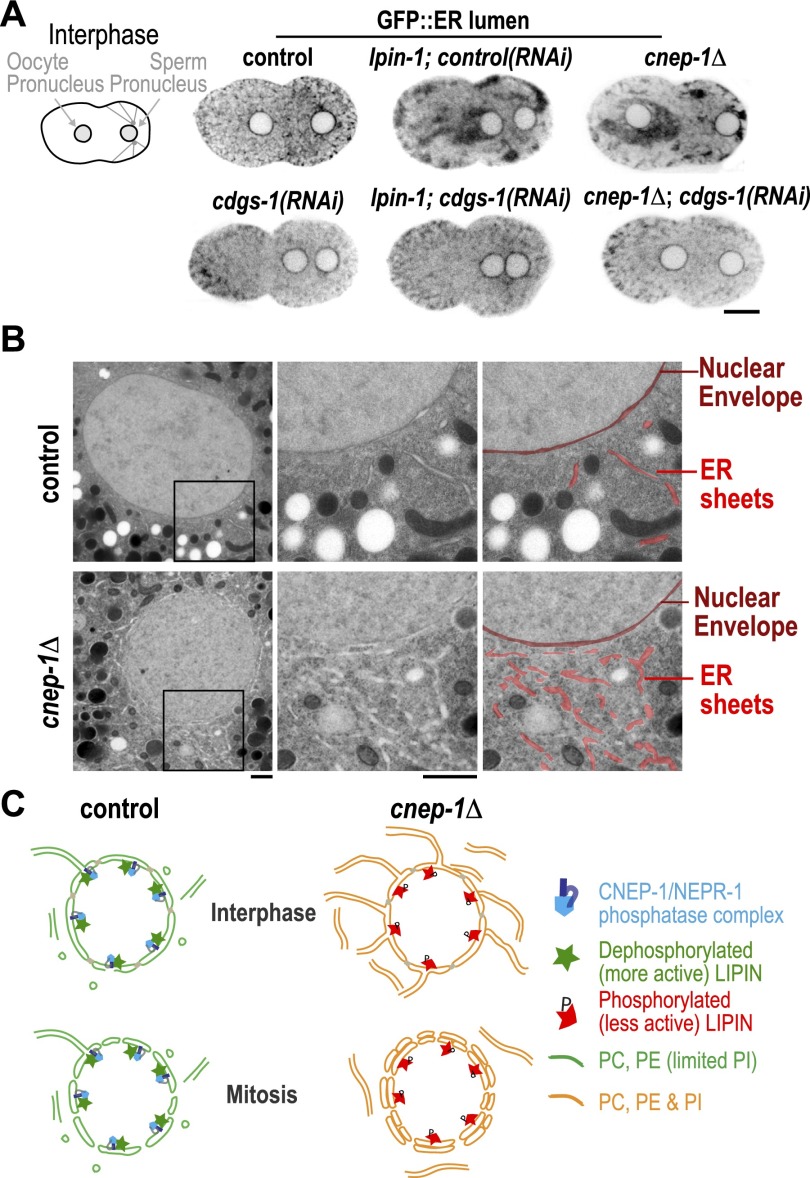
The nuclear envelope is a subdomain of the endoplasmic reticulum (ER). Here we characterize CNEP-1 (CTD [C-terminal domain] nuclear envelope phosphatase-1), a nuclear envelope-enriched activator of the ER-associated phosphatidic acid phosphatase lipin that promotes synthesis of major membrane phospholipids over phosphatidylinositol (PI). CNEP-1 inhibition led to ectopic ER sheets in the vicinity of the nucleus that encased the nuclear envelope and interfered with nuclear envelope breakdown (NEBD) during cell division. Reducing PI synthesis suppressed these phenotypes, indicating that CNEP-1 spatially regulates phospholipid flux, biasing it away from PI production in the vicinity of the nuclear envelope to prevent excess ER sheet formation and NEBD defects.

Keywords: endoplasmic reticulum; lipin; phosphatidylinositol; phospholipid synthesis.


Figures

Figure 1.
Figure 1.
The lipin activator CNEP-1 concentrates on the nuclear envelope and is required for timely nuclear envelope disassembly during mitosis. (A) Schematic showing lipin at the branching point between the synthesis of major membrane phospholipids and PI. (B) Fluorescence confocal images of embryos expressing the ER lumen marker mCherry∷SP12 along with GFP∷LPIN-1 (top) (n > 10 embryos) or mCherry∷SP12 and CNEP-1∷GFP in a background deleted for the endogenous cnep-1 gene (bottom) (n > 10 embryos). Graphs plot normalized brood size. Error bars are SEM. (N) Number of worms; (n) total number of embryos. (C) Schematics highlight scission of the maternal and paternal pronuclear envelopes (green) during chromosome (red) segregation in the first division of control C. elegans embryos and failure of scission in embryos exhibiting a nuclear envelope breakdown (NEBD) defect. (D, left) Inverted contrast fluorescence confocal images of two-cell stage embryos expressing GFP∷LEM-2 illustrate nuclear morphology phenotypes. (Right) Graph plotting frequency of abnormal nuclear phenotypes for the indicated conditions. (E) Fluorescence confocal images of control and cnep-1Δ embryos expressing GFP∷LEM-2 and mCherry∷histone. Times are in seconds relative to anaphase onset. Yellow arrowheads mark the site of nuclear envelope scission in wild type. (F) Immunoblots of lysates from control and cnep-1Δ worms (top) or cnep-1Δ worms harboring the wild-type (WT) or PD transgenes (bottom) probed for LPIN-1. Bars, 10 μm.
Figure 2.
Figure 2.
Mitotic nuclei in cnep-1Δ mutants are wrapped in an additional ER layer. (A,B) Transmission electron micrographs of the nuclear regions of prophase (top) and prometaphase/metaphase (bottom) high-pressure-frozen embryos (eight to 16 cells) at the indicated mitotic stages (n = 13 mitotic cells for control; n = 11 mitotic cells for cnep-1Δ). Magnified images of boxed regions are paired with micrographs pseudocolored to highlight the nuclear envelope/ER lumens (red) that separate the cytoplasm (yellow) and nucleus (blue). Cinched-in regions along the nuclear envelope in A are where nuclear pore complexes are inserted. Arrows (dark red) point to isolated regions where two adjacent lumens are detected. One-hundred percent of cnep-1Δ nuclear envelopes during late stages of NEBD (n = 7), as compared with none in control (n = 6), displayed an additional double-membrane sheet encircling the nuclear envelope. Bars, 1 μm.
Figure 3.
Figure 3.
The nuclear envelope disassembly defect in the cnep-1Δ mutant results from increased PI synthesis. (A) Schematic highlighting the C. elegans enzymes required to synthesize PI from the lipin substrate PA (CDGS-1 and PISY-1; red) and to synthesize PC and PE from the lipin product DAG (CEPT-2; green). (B) Autoradiograph of a chromatography plate after separation of isolated 32P-labeled phospholipids. Graphs plotting the mean band intensity for each phospholipid species from three independent replicates normalized against the mean value in control samples run in parallel. Error bars are the SD. (C, top) Inverted contrast confocal images of representative nuclear phenotypes in two-cell stage embryos expressing the ER lumen marker GFP∷SP-12. (Bottom) Plots quantifying abnormal nuclear phenotypes at the two-cell stage for the indicated conditions. Bar, 2 µm. (D) Graphs plotting the mean band intensity for each phospholipid species from three independent replicates normalized against the mean value in control samples run in parallel. Error bars are the SD. (E, top) Overlay of differential interference contrast and YFP∷lamin fluorescence confocal images for a control embryo (normal cytokinesis) and a cnep-1 and npp-12(RNAi) embryo failing cytokinesis (cytokinesis failure). (Bottom) Table showing the percentage of embryos exhibiting cytokinesis success or failure.
Figure 4.
Figure 4.
CNEP-1 suppresses ER sheet formation in the vicinity of the nuclear envelope. (A) Inverted contrast fluorescence confocal images of interphase embryos expressing the ER lumen marker GFP∷SP12. Bar, 10 μm. (B) Transmission electron micrographs of ultrathin cross-sections of high-pressure-frozen control and cnep-1Δ embryos. Magnified images of the boxed regions are paired with micrographs pseudocolored to highlight the location of the nuclear envelope (dark red) and ER sheets (red). Bars, 900 nm. (C) Model for spatial regulation of phospholipid synthesis by CNEP-1. In control embryos, the CNEP-1 complex activates lipin to limit the amount of PI on nuclear membranes and ER membranes in the vicinity of the nucleus (green nuclear envelope/ER membranes contain PC and PE with limited PI). In cnep-1Δ embryos, lipin is less active at the nuclear envelope, and PI levels are higher (orange nuclear envelope/ER membranes contain PC, PE, and PI). Increased PI levels lead to ectopic ER sheets in the vicinity of the nucleus that encase the nuclear envelope following mitotic permeabilization and inhibit its subsequent disassembly.

Similar articles

Cited by

References

    1. Audhya A, Desai A, Oegema K 2007. A role for Rab5 in structuring the endoplasmic reticulum. J Cell Biol 178: 43–56 - PMC - PubMed
    1. Balla T 2013. Phosphoinositides: Tiny lipids with giant impact on cell regulation. Physiol Rev 93: 1019–1137 - PMC - PubMed
    1. Bligh EG, Dyer WJ 1959. A rapid method of total lipid extraction and purification. Can J Biochem Physiol 37: 911–917 - PubMed
    1. Calarco PG, Donahue RP, Szollosi D 1972. Germinal vesicle breakdown in the mouse oocyte. J Cell Sci 10: 369–385 - PubMed
    1. Carman GM, Han GS 2006. Roles of phosphatidate phosphatase enzymes in lipid metabolism. Trends Biochem Sci 31: 694–699 - PMC - PubMed

Publication types

MeSH terms