

iTRAQ as a method for optimization: enhancing peptide recovery after gel fractionation
- PMID: 24449435
- PMCID: PMC4413792
- DOI: 10.1002/pmic.201300444
iTRAQ as a method for optimization: enhancing peptide recovery after gel fractionation
Abstract
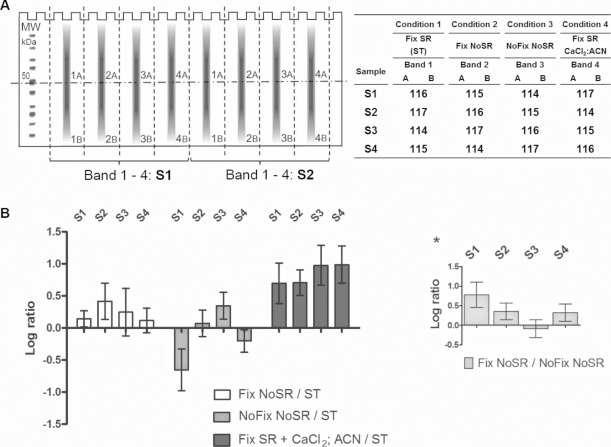
At the dawn of a new era in label-free quantitation on high-resolution MS instruments, classical methods such as iTRAQ continue to provide very useful insights in comparative proteomics. The potential to multiplex samples makes this reporter-based labeling technique highly suited for method optimization as demonstrated here by a set of standard series. Instead of studying ratios of annotated proteins, we propose an alternative method, based on the analysis of the average reporter ratios of all the spectra from a sample or a large distinct subset herein. This strategy circumvents the bias, associated with the annotation and iTRAQ quantitation, leading to increased adequacy in measuring yield differences between workflows. As gel electrophoresis prior to MS analysis is highly beneficial, for example, as a fractionation step, the approach was applied to evaluate the influence of several parameters of the established in-gel digestion protocol. We quantified the negative effect of SYPRO Ruby staining and the positive effect of gel fixation prior to digestion on peptide yield. Finally, we emphasize the benefits of adding CaCl2 and ACN to a tryptic in-gel digest, resulting in an up to tenfold enhanced peptide recovery and fewer trypsin missed cleavages.
Keywords: Gel fractionation; In-gel digestion; Method optimization; Quantification; Technology; iTRAQ.
© 2014 The Authors. Proteomics published by Wiley-VCH Verlag GmbH & Co. KGaA, Weinheim.
Figures

References
-
- DeSouza LV, Siu KWM. Mass spectrometry-based quantification. Clin. Biochem. 2013;46:421–431. - PubMed
-
- Evans C, Noirel J, Ow SY, Salim M. An insight into iTRAQ: where do we stand now. Anal. Bioanal. Chem. 2012;404:1011–1027. - PubMed
-
- Ow SY, Salim M, Noirel J, Evans C. iTRAQ underestimation in simple and complex mixtures: “the good, the bad and the ugly”. J. Proteome Res. 2009;8:5347–5355. - PubMed
-
- Burkhart JM, Vaudel M, Zahedi RP, Martens L, Sickmann A. iTRAQ protein quantification: a quality-controlled workflow. Proteomics. 2011;11:1125–1134. - PubMed
MeSH terms
Substances
LinkOut - more resources
Full Text Sources
Other Literature Sources
Research Materials
