. 2014 Jan 21;3(1):e000476.
doi: 10.1161/JAHA.113.000476.

IL-6 regulates extracellular matrix remodeling associated with aortic dilation in a fibrillin-1 hypomorphic mgR/mgR mouse model of severe Marfan syndrome

Affiliations

IL-6 regulates extracellular matrix remodeling associated with aortic dilation in a fibrillin-1 hypomorphic mgR/mgR mouse model of severe Marfan syndrome

Xiaoxi Ju et al. J Am Heart Assoc. .

Abstract

Background: Development of thoracic aortic aneurysms is the most significant clinical phenotype in patients with Marfan syndrome. An inflammatory response has been described in advanced stages of the disease. Because the hallmark of vascular inflammation is local interleukin-6 (IL-6) secretion, we explored the role of this proinflammatory cytokine in the formation of aortic aneurysms and rupture in hypomorphic fibrillin-deficient mice (mgR/mgR).

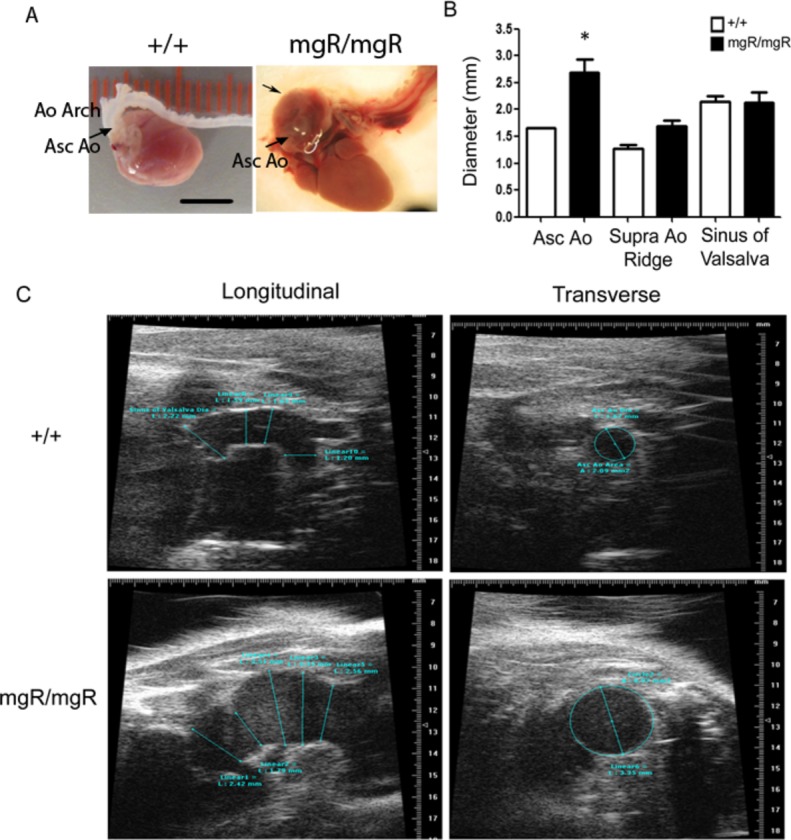
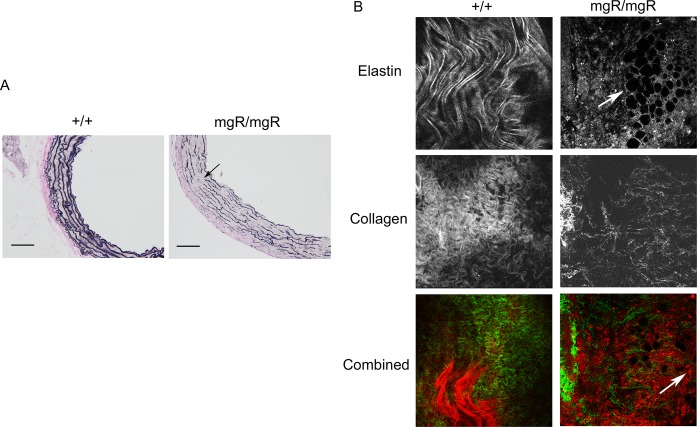
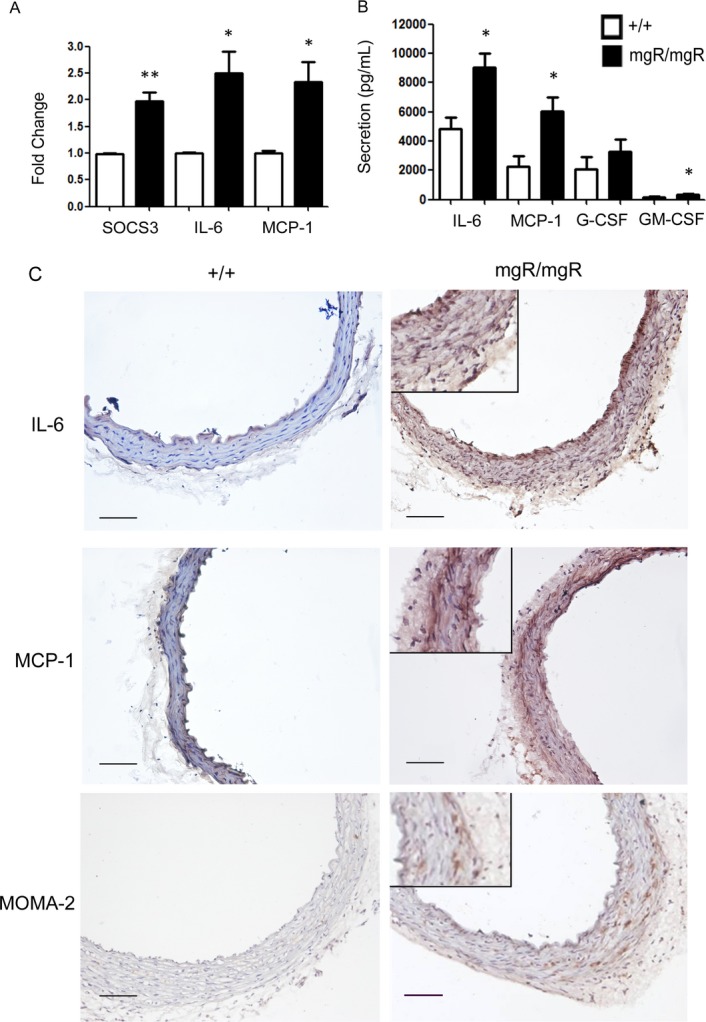
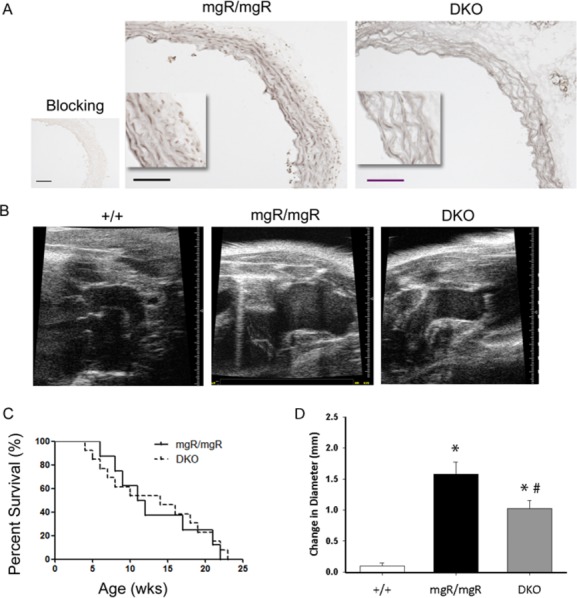
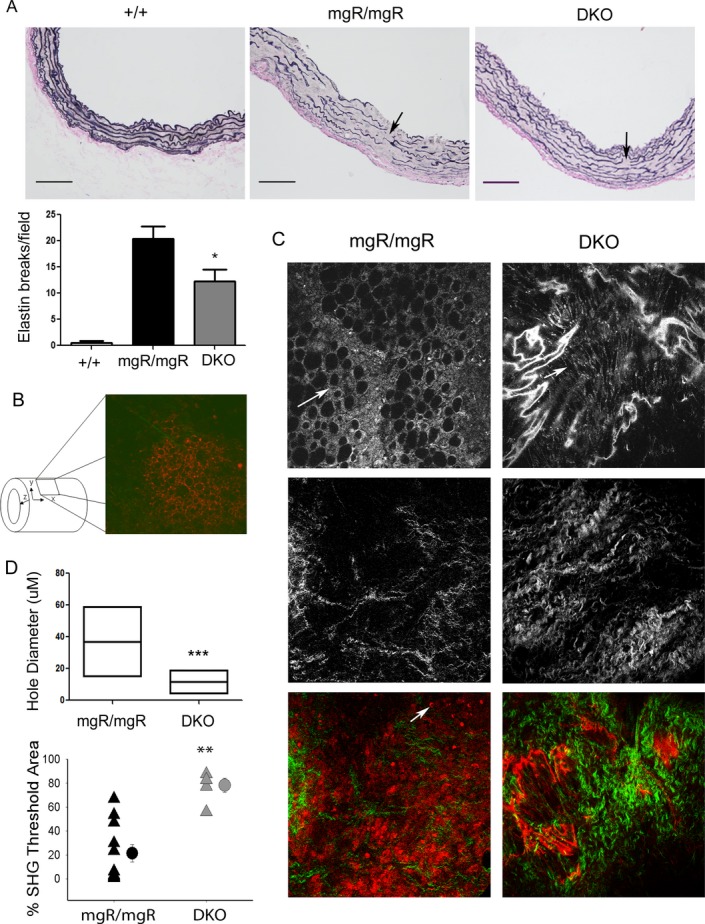
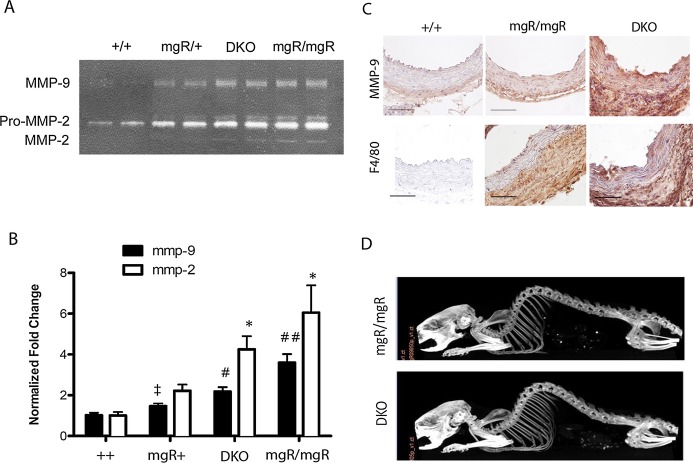
Methods and results: MgR/mgR mice developed ascending aortic aneurysms with significant dilation of the ascending aorta by 12 weeks (2.7 ± 0.1 and 1.3 ± 0.1 for mgR/mgR versus wild-type mice, respectively; P<0.001). IL-6 signaling was increased in mgR/mgR aortas measured by increases in IL-6 and SOCS3 mRNA transcripts (P<0.05) and in cytokine secretion of IL-6, MCP-1, and GM-CSF (P<0.05). To investigate the role of IL-6 signaling, we generated mgR homozygous mice with IL-6 deficiency (DKO). The extracellular matrix of mgR/mgR mice showed significant disruption of elastin and the presence of dysregulated collagen deposition in the medial-adventitial border by second harmonic generation multiphoton autofluorescence microscopy. DKO mice exhibited less elastin and collagen degeneration than mgR/mgR mice, which was associated with decreased activity of matrix metalloproteinase-9 and had significantly reduced aortic dilation (1.0 ± 0.1 versus 1.6 ± 0.2 mm change from baseline, DKO versus mgR/mgR, P<0.05) that did not affect rupture and survival.

Conclusion: Activation of IL-6-STAT3 signaling contributes to aneurysmal dilation in mgR/mgR mice through increased MMP-9 activity, aggravating extracellular matrix degradation.

Keywords: Marfan syndrome; extracellular matrix; interleukin‐6; matrix metalloproteinases; mgR; thoracic aortic aneurysms and dissections; vascular inflammation.


Figures

Figure 1.
Figure 1.
Characterization of vascular pathology of homozygous mgR mice. Age‐matched homozygous (mgR/mgR) and wild‐type (++) littermates were identified by genotyping and used for echosonography imaging of the thoracic aorta (TAA) at the levels of the ascending aorta (Asc Ao), the supra‐aortic ridge (Supra Ao Ridge) and the sinus of Valsalva. A, Representative anatomical images of aortas from a 12‐week‐old wild‐type mouse and a mgR/mgR mouse with TAA formation. Ao Arch, aortic arch; Asc Ao, ascending aorta; unalabeled arrow, TAA in ascending aorta. Scale bar is 5 mm. B, Diameters of thoracic aortas in mgR/mgR (n=9) and wild‐type (++) littermates (n=8) were measured in vivo at the level of ascending aorta, supra‐aortic ridge and the sinus of Valsalva. *P<0.05. C, Representative echosonography images of the aortic arch in age‐matched wild‐type +/+ and mgR/mgR littermates. Left panel: Echo transducer was placed longitudinally to acquire images at different levels of aortic arch. Right panel: transverse images of ascending aorta.
Figure 2.
Figure 2.
Aortic elastin and collagen abnormalities in mgR homozygous mutants. Aortas from age‐matched wild‐type (n=6) and mgR/mgR (n=6) littermates were examined for ECM components. A, Histological staining of elastin (shown in purple), collagen (shown in pink) and SMCs (shown in yellow) in sections of ascending aorta. Arrow: breaks in elastin fibers. Scale bar is 100 μm. B, SHG and MPAM images of wild‐type (n=4) and age‐matched aneurysmal mgR/mgR mice (n=6). Top panel: Elastin sheets form a smooth, curving layer in aortic media in +/+ and holes were formed in elastin layers in mgR/mgR mice. Middle panel: Collagen fibers were arranged in dense, curving structures in the aortic adventitia in wild‐type +/+ mice, but were widely dispersed in the adventitia and adventitia‐media border of mgR/mgR mice. Bottom panel: Combined images of collagen and elastin at the adventitia‐media border. Collagen is shown in green and elastin is shown in red. Arrows: holes formed in elastin layers. Cell infiltration is also pronounced at the adventitia‐media border (autofluorescent red dots). Representative images are shown. Images were shown in 320×320 μm. ECM indicates extracellular matrix; MPAM, multiphoton autofluorescence microscopy; SHG, second harmonic generation; SMC, smooth muscle cell.
Figure 3.
Figure 3.
IL‐6 signaling is activated in mgR homozygous mice. A, Real‐time quantitative analysis demonstrated that gene expression levels of IL‐6, MCP‐1, and the IL‐6 downstream signaling molecule SOCS3 are significantly elevated in mgR/mgR homozygous mice (n=6) vs wild‐type controls (n=4), suggesting activation of IL‐6 signaling in the mgR mutants. *P<0.05; **P<0.01. B, Local cytokine and chemokine secretion from thoracic aortic tissues in explant culture media was measured by multiplex ELISA. Secretion of IL‐6, MCP‐1 and GM‐CSF was increased significantly. n=4 in each group. *P<0.05. **P<0.01. C, IHC staining of IL‐6, MCP‐1 and the macrophage marker MOMA‐2. Positive staining was shown in brown and counter‐staining with hematoxylin in blue. Enlarged details of the mgR/mgR sections are shown on the right. Scale bar is 100 μm. ELISA indicates enzyme‐linked immunosorbent assay; G‐CSF, granulocyte‐colony stimulating factor; GM‐CSF, granulocyte‐macrophage colony‐stimulating factor; IHC, immunohistochemistry; IL, interleukin; MCP‐1, monocyte chemotactic protein‐1; SOCS3, suppressor of cytokine signaling 3.
Figure 4.
Figure 4.
Characterization of aortic pathology of mgR/mgR•IL‐6−/− double knockout (DKO) mice. A, IHC staining of phospho‐STAT3‐Y705. Positive staining was shown in grey. Aortic sections treated with p‐STAT3 blocking peptide were shown on the left as negative control. n=6 mice in mgR/mgR and n=4 mice in DKO group. Scale bar is 100 μm. B, Representative images of echosonography of age‐matched wild‐type, mgR homozygotes, and DKO mice. C, Survival curves of mgR/mgR (n=21) and DKO (n=17) mice. D, Diameters of ascending aorta were measured weekly in vivo by transthoracic echosonography from week 5 to week 18 in wild‐type (+/+), mgR/mgR and DKO mice. Change in diameter was determined with week 5 measurements taken as the baseline, which was subtracted from the final measurement recorded during week 18. The difference, or the change in diameter, was then assessed for significance using ANOVA. n=10 in each group. *P<0.005 vs wild‐type, #P<0.05 vs mgR/mgR. ANOVA indicates analysis of variance; IHC, immunohistochemistry; IL, interleukin; p‐STAT3, phosphorylation of signal transducer and activator and transcription 3.
Figure 5.
Figure 5.
ECM degeneration in mgR/mgR and DKO mice. A, Elastin staining of ascending aortic sections of wild‐type (n=6), mgR/mgR (n=5), and DKO mice (n=6). Scale bar is 100 μm. Bottom panel: number of breaks in elastin fibers was quantified. *P<0.003 vs ++; **P<0.05 vs mgR/mgR. B, Schematic diagram of SHG/MPAM microscopy of ascending aortic samples. C, SHG and MPAM microscopic images of mgR/mgR (n=6) and age‐matched DKO (n=4) mice. Top panel: Elastin content was shown by MPAM at the wavelength of 770 μm. Round and large hole formation is evident in mgR/mgR. In DKOs, small gaps were found in elastin sheets. Arrows: Degeneration tears and holes in elastin sheets. Middle panel: Collagen fibers. Bottom panel: Combined images of collagen and elastin at the adventitia‐media border. Collagen was shown in green and elastin was shown in red. Arrow: Cell infiltration was more pronounced at the adventitia‐media border in mgR/mgR mice. Representative images are shown for each group. Images were taken in 320×320 μm. D, Sizes of holes and gaps in elastin sheets, indicators of elastin degradation, were analyzed and quantified using MetaMorph Premier S software. Hole diameter is represented as a box plot with the middle horizontal line representing the mean value, and the upper and lower lines representing the maximum and minimum for each group, respectively. n=100 in mgR/mgR and 133 in DKO group. Collagen content in aortic samples was measured as percentage of SHG signals. Triangles represent individual samples and circles represent the mean of each group. ***P<0.001; **P<0.0001 by unpaired t test. DKO indicates double knockout; ECM, extracellular matrix; MPAM, multiphoton autofluorescence microscopy; SHG, second harmonic generation.
Figure 6.
Figure 6.
IL‐6 deficiency decreases MMP‐9 activity in DKO vs mgR/mgR homozygous mice but does not affect skeletal abnormality. A, Representative gelatin zymography of age‐matched wild‐type (++), mgR/+, mgR/mgR, and DKO mice. Activities of pro‐MMP‐2, MMP‐2 and MMP‐9 are shown. B, Quantification of MMP‐2 and ‐9 activity in different genotypes. n=6 for wild‐type and mgR+ and n=4 for mgR/mgR and DKO. *P<0.05 vs ++; P<0.02 vs ++; #P<0.001 vs ++ and mgR/+; ##P<0.001 vs ++, mgR/+, and DKO. C, Immunohistochemistry for MMP‐9 and F4/80+ macrophages in wild‐type, mgR/mgR and DKO ascending aortas. Lumen is at the top. n=3 per group. Scale bar is 50 μm. Magnification is ×400. D, Representative CT images of mgR/mgR and DKO mice (n=2 per group). CT indicates computed tomography; DKO, double knockout; IL, interleukin; MMP‐9, matrix metalloproteinase‐9.

Similar articles

Cited by

References

    1. Dietz HC, Loeys B, Carta L, Ramirez F. Recent progress towards a molecular understanding of Marfan syndrome. Am J Med Genet C Semin Med Genet. 2005; 139C:4-9 - PubMed
    1. Williams A, Davies S, Stuart AG, Wilson DG, Fraser AG. Medical treatment of Marfan syndrome: a time for change. Heart. 2008; 94:414-421 - PubMed
    1. Yetman AT. Cardiovascular pharmacotherapy in patients with Marfan syndrome. Am J Cardiovasc Drugs. 2007; 7:117-126 - PubMed
    1. Hirata K, Triposkiadis F, Sparks E, Bowen J, Wooley CF, Boudoulas H. The Marfan syndrome: abnormal aortic elastic properties. J Am Coll Cardiol. 1991; 18:57-63 - PubMed
    1. Dietz HC, Pyeritz RE. Mutations in the human gene for fibrillin‐1 (FBN1) in the Marfan syndrome and related disorders. Hum Mol Genet. 1995; 4 Spec No:1799-1809 - PubMed

Publication types

MeSH terms