. 2014 Feb 4;111(5):1873-8.
doi: 10.1073/pnas.1321195111. Epub 2014 Jan 21.

Paternally induced transgenerational inheritance of susceptibility to diabetes in mammals

Affiliations

Paternally induced transgenerational inheritance of susceptibility to diabetes in mammals

Yanchang Wei et al. Proc Natl Acad Sci U S A. .

Abstract

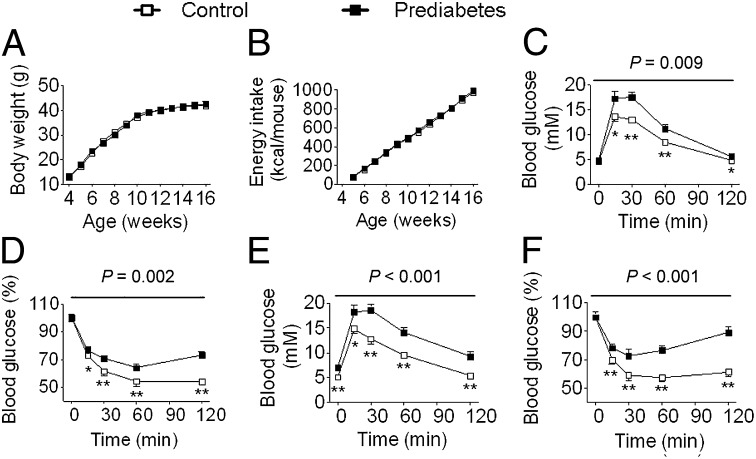
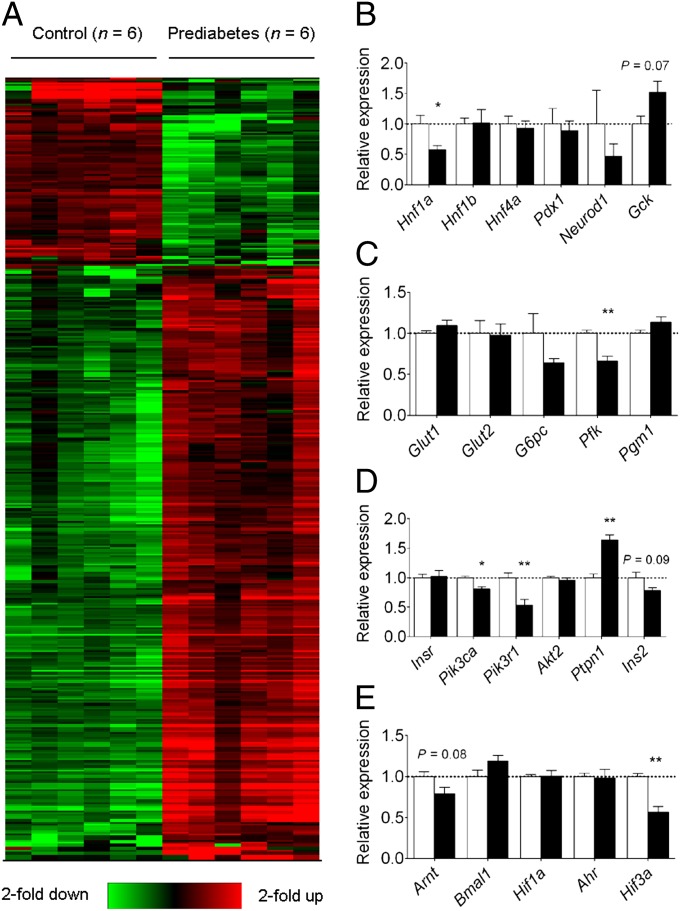
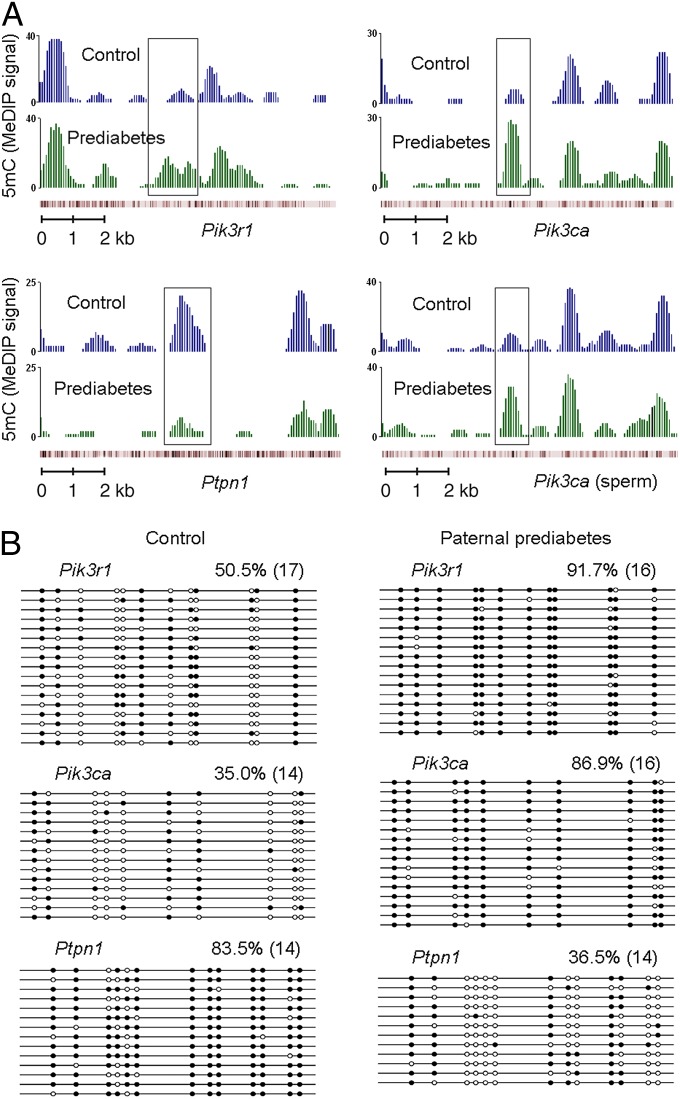
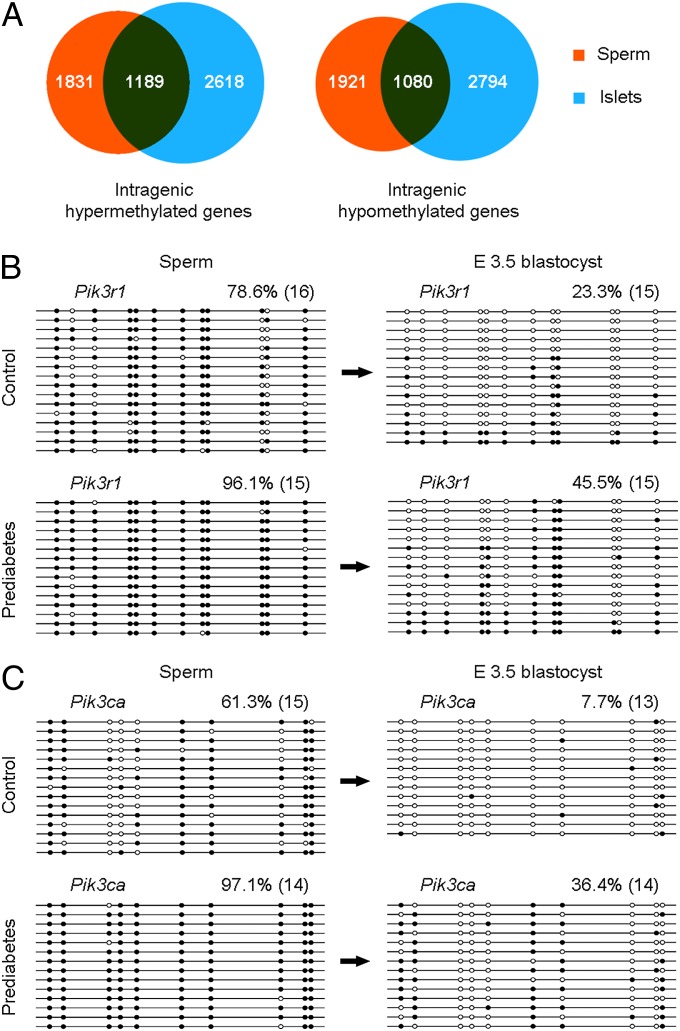
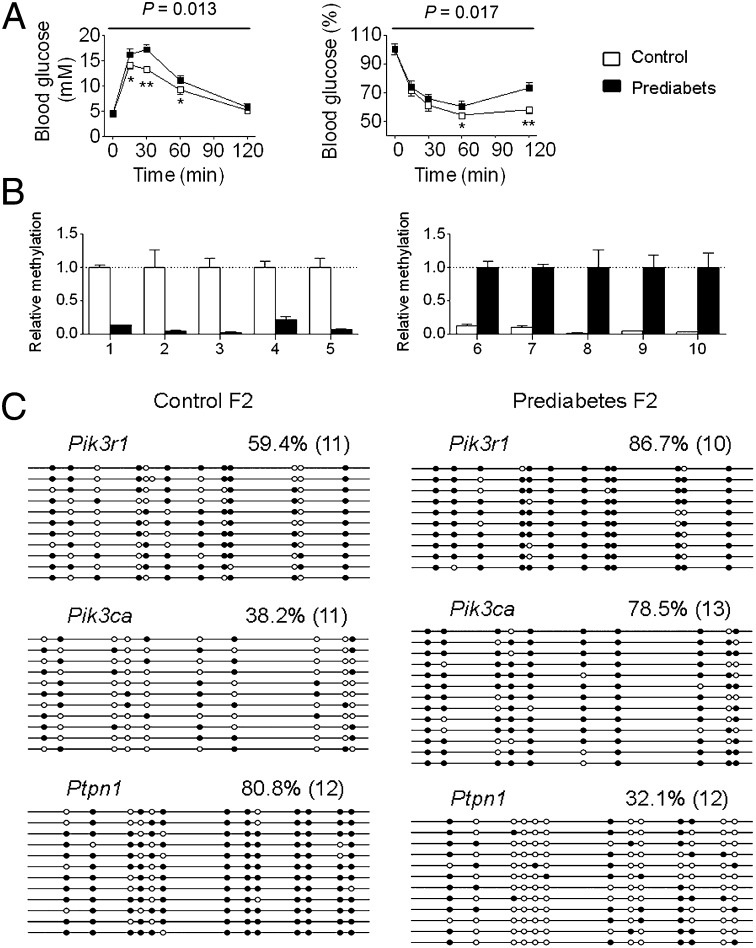
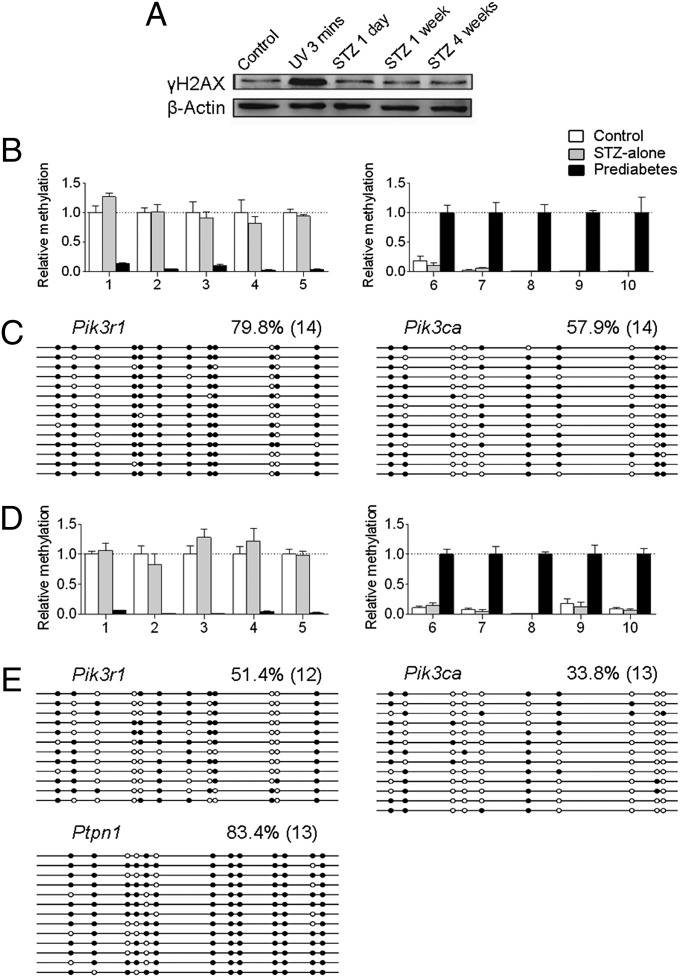
The global prevalence of prediabetes and type 2 diabetes (T2D) is increasing, and it is contributing to the susceptibility to diabetes and its related epidemic in offspring. Although the impacts of paternal impaired fasting blood glucose and glucose intolerance on the metabolism of offspring have been well established, the exact molecular and mechanistic basis that mediates these impacts remains largely unclear. Here we show that paternal prediabetes increases the susceptibility to diabetes in offspring through gametic epigenetic alterations. In our findings, paternal prediabetes led to glucose intolerance and insulin resistance in offspring. Relative to controls, offspring of prediabetic fathers exhibited altered gene expression patterns in the pancreatic islets, with down-regulation of several genes involved in glucose metabolism and insulin signaling pathways. Epigenomic profiling of offspring pancreatic islets revealed numerous changes in cytosine methylation depending on paternal prediabetes, including reproducible changes in methylation over several insulin signaling genes. Paternal prediabetes altered overall methylome patterns in sperm, with a large portion of differentially methylated genes overlapping with that of pancreatic islets in offspring. Our study uniquely revealed that prediabetes can be inherited transgenerationally through the mammalian germ line by an epigenetic mechanism.


Conflict of interest statement

The authors declare no conflict of interest.

Figures

Fig. 1.
Fig. 1.
Paternal prediabetes leads to glucose intolerance and insulin insensitivity in male offspring. (A) Body weight trajectories (control, prediabetes: n = 13 and 16, respectively). (B) Cumulative energy intake (n = 6 and 5, respectively). (C) Blood glucose during GTT at 16 wk (n = 8 and 9, respectively). (D) Blood glucose during ITT at 16 wk (n = 10 and 7, respectively). (E) Blood glucose during GTT at 12 mo (n = 8 and 7, respectively). (F) Blood glucose during ITT at 12 mo (n = 8 and 7, respectively). Data are expressed as mean ± SEM; *P < 0.05, **P < 0.01, versus control. P values for significance between groups in repeated-measure analysis are shown (Upper, C–F).
Fig. 2.
Fig. 2.
Paternal prediabetes alters the expression of glucose metabolic and insulin signaling-related genes in the pancreatic islets of offspring. (A) Hierarchical cluster of differentially expressed genes. Six samples of prediabetes groups (Left) and six samples of control groups (Right) were analyzed. Red color indicates relatively up-regulated genes, and green color indicates down-regulated genes. Only genes passing the significance change (P < 0.05 and fold-change >2) are shown. (B–E) Expression levels of six MODY genes (B), glucose transporters and downstream enzymes involved in glycolysis (C), insulin signaling genes (D), and bHLH-PAS family members (E). Data are expressed as mean ± SEM. The dotted line (set as 1) represents the average of expression levels of each gene from controls. *P < 0.05; **P < 0.01; or P values are shown above the bars.
Fig. 3.
Fig. 3.
Paternal prediabetes alters the methylation status of several insulin signaling genes in offspring. (A) MeDIP-Seq data are shown for three insulin signaling genes, including Pik3r1 (Upper Left), Pik3ca (Upper Right) and Ptpn1 (Lower Left) in offspring, and Pik3ca (Lower Right) in sperm. The graphs show smoothed number of normalized reads, which represent output MeDIP signals. Genes are shown below the graphs, and red bars represent the position of the CpGs. The regions that are differentially methylated are shown in the box. (B) Bisulfite sequencing for the methylation status of indicated genes. White circles represent unmethylated CpGs, and black circles represent methylated CpGs. Values on each bisulfite grouping indicate the percentage of CpG methylation, with number of analyzed clones in parentheses.
Fig. 4.
Fig. 4.
Comparison of DNA methylation patterns in sperm, islets, and E3.5 blastocysts. (A) Venn diagrams of differentially methylated intragenic element-associated genes show numerous overlaps between sperm and pancreatic islets. (B and C) Bisulfite sequencing of Pik3r1 (B) and Pik3ca (C) in sperm and E3.5 blastocysts show partial inheritance of DNA methylation from gametes. Genes are shown above the graphs. White circles represent unmethylated CpGs, and black circles represent methylated CpGs. Values on each bisulfite grouping indicate the percentage of CpG methylation, with number of analyzed clones in parentheses.
Fig. 5.
Fig. 5.
Effects of paternal prediabetes on metabolic and epigenetic changes in the F2 generation. (A) Blood glucose during GTT (Left) and ITT (Right) at 16 wk of F2 generation males (n = 8 and 7, respectively). Data are expressed as mean ± SEM; *P < 0.05, **P < 0.01, versus control. P values for significance between groups in repeated-measure analysis are shown (Upper). (B) MeDIP-qPCR for the methylation levels of the randomly selected 10 regions (Left, five down-regulated; Right, five up-regulated) distributed on different chromosomes that were most affected by paternal prediabetes in islets of the F2 generation. Samples from four control and four prediabetes F2 generation offspring, each from a different father, were chosen for analysis. All of the detailed region information is described in SI Methods. (C) Bisulfite sequencing for the methylation status of indicated genes in islets of the F2 generation. Pooled DNA from three control and three prediabetic animals, each from a different father were included. White circles represent unmethylated CpGs, and black circles represent methylated CpGs. Values on each bisulfite grouping indicate the percentage of CpG methylation, with number of clones analyzed in parentheses.
Fig. 6.
Fig. 6.
Assessment of STZ’s effects on sperm and offspring epigenetic alterations. (A) Western blot analysis of the sensitive DNA-damage marker γH2AX in sperm. The expression was unchanged at 1 d, 1 wk, and 4 wk post-STZ injection, but was significantly increased after a 3-min UV exposure. (B and D) MeDIP-qPCR for the methylation levels of the randomly selected 10 regions (Left, five down-regulated; Right, five up-regulated) distributed on different chromosomes that were most affected by paternal prediabetes in sperm (B) and islets of offspring (D). All of the detailed region information is described in SI Methods. (C and E) Bisulfite sequencing for the methylation status of indicated genes in sperm (C) and islets of offspring (E). White circles represent unmethylated CpGs, and black circles represent methylated CpGs. Values on each bisulfite grouping indicate the percentage of CpG methylation, with number of analyzed clones in parentheses.

References

    1. Seong KH, Li D, Shimizu H, Nakamura R, Ishii S. Inheritance of stress-induced, ATF-2-dependent epigenetic change. Cell. 2011;145(7):1049–1061. - PubMed
    1. Rechavi O, Minevich G, Hobert O. Transgenerational inheritance of an acquired small RNA-based antiviral response in C. elegans. Cell. 2011;147(6):1248–1256. - PMC - PubMed
    1. Ng SF, et al. Chronic high-fat diet in fathers programs β-cell dysfunction in female rat offspring. Nature. 2010;467(7318):963–966. - PubMed
    1. Carone BR, et al. Paternally induced transgenerational environmental reprogramming of metabolic gene expression in mammals. Cell. 2010;143(7):1084–1096. - PMC - PubMed
    1. Champagne FA. Epigenetic mechanisms and the transgenerational effects of maternal care. Front Neuroendocrinol. 2008;29(3):386–397. - PMC - PubMed

Publication types

MeSH terms

Associated data