. 2014 Feb 4;111(5):2029-34.
doi: 10.1073/pnas.1319953111. Epub 2014 Jan 21.

CLE-CLAVATA1 peptide-receptor signaling module regulates the expansion of plant root systems in a nitrogen-dependent manner

Affiliations

CLE-CLAVATA1 peptide-receptor signaling module regulates the expansion of plant root systems in a nitrogen-dependent manner

Takao Araya et al. Proc Natl Acad Sci U S A. .

Abstract

Morphological plasticity of root systems is critically important for plant survival because it allows plants to optimize their capacity to take up water and nutrients from the soil environment. Here we show that a signaling module composed of nitrogen (N)-responsive CLE (CLAVATA3/ESR-related) peptides and the CLAVATA1 (CLV1) leucine-rich repeat receptor-like kinase is expressed in the root vasculature in Arabidopsis thaliana and plays a crucial role in regulating the expansion of the root system under N-deficient conditions. CLE1, -3, -4, and -7 were induced by N deficiency in roots, predominantly expressed in root pericycle cells, and their overexpression repressed the growth of lateral root primordia and their emergence from the primary root. In contrast, clv1 mutants showed progressive outgrowth of lateral root primordia into lateral roots under N-deficient conditions. The clv1 phenotype was reverted by introducing a CLV1 promoter-driven CLV1:GFP construct producing CLV1:GFP fusion proteins in phloem companion cells of roots. The overaccumulation of CLE2, -3, -4, and -7 in clv1 mutants suggested the amplitude of the CLE peptide signals being feedback-regulated by CLV1. When CLE3 was overexpressed under its own promoter in wild-type plants, the length of lateral roots was negatively correlated with increasing CLE3 mRNA levels; however, this inhibitory action of CLE3 was abrogated in the clv1 mutant background. Our findings identify the N-responsive CLE-CLV1 signaling module as an essential mechanism restrictively controlling the expansion of the lateral root system in N-deficient environments.

Keywords: nitrogen signaling; root morphology; root system architecture.


Conflict of interest statement

The authors declare no conflict of interest.

Figures

Fig. 1.
Fig. 1.
Constitutive overexpression of CLE2 and CLE3 represses lateral root development. (A) Regulation of CLE1 to 7 transcript levels by nitrogen supply. Wild-type (Col-0) plants were grown for 14 d on medium with various NO3 concentrations (10, 30, 100, 300, 1,000, 3,000, and 7,000 μM) and the amounts of CLE gene transcripts were quantified by real-time PCR. Results are given in relative transcript abundance relative to the sample from 7,000 μM NO3. Ubiquitin 2 was used as an internal standard. Error bars denote SEM (n = 5). Significant differences obtained by Tukey’s multiple test at P < 0.05 are shown by different letters. (B–D) Root phenotypes of wild-type (Col-0) and CLE2 and CLE3 overexpressor lines. The primary root length (C) and the total length of visible lateral roots (D) were measured in 11-d-old plants grown vertically on medium containing 100 μM NO3. Error bars denote SEM (n = 13–21). Graphs separated by a vertical bar indicate results from independent experiments. (E) Lateral root (LR) density of wild-type (Col-0) and CLE2 and CLE3 overexpressor lines classified by developmental stages. Plants were grown vertically on medium containing 100 μM NO3 for 7 d. Error bars denote SEM (n = 27–36). Significant differences with Dunnett’s multiple test at *P < 0.05 or **P < 0.01 are shown. (F) Relative frequency distribution of lateral root primordia and lateral roots. The relative frequency of lateral root primordia or lateral roots in each developmental stage is indicated by their percentage in the total number of lateral root initiation events. The size of each circle indicates the total lateral root density shown in E. (G and H) GFP expression in CLE3 promoter:GFP plants. Plants were grown vertically on medium containing 10 μM NO3 for 7 d. Longitudinal (G) and cross (H) sections of primary roots indicate specific localization of GFP signals (green) in the pericycle (p). Roots for cross sections were counter stained by propidium iodide (red). c, cortex; en, endodermis; ep, epidermis; p, pericycle. [Scale bars, 100 μm (G) and 50 μm (H).]
Fig. 2.
Fig. 2.
Regulation of lateral root development by CLV1. (A–C) Effect of N deficiency on root traits of wild-type (Ler) and clv1-15 mutant plants. Plants were grown vertically for 11 d on medium with various NO3 concentrations (10, 30, 100, 300, 1,000, 3,000, and 7,000 μM). Primary root length (A), total lateral root length (B), and average lateral root length (C) were quantified as in Fig. 1. Error bars denote SEM (n = 26–51). Average lateral root length (C) was calculated by dividing the total lateral root length by the number of visible lateral roots. Significant differences between Ler and clv1-15 at each NO3 concentration are shown as *P < 0.05, **P < 0.01, or ***P < 0.001 according to Student t tests. (D) Root phenotypes of wild-type (Ler), clv1 mutants, and CLV1:GFP plants. Plants were grown vertically on medium containing 100 μM NO3 for 11 d. The roots are traced by a white line to increase the contrast. The original image without tracing is shown in Fig. S4B. (E and F) Root length comparison between wild type (Ler) and clv1 mutants. Error bars denote SEM (n = 20–29). Plants were grown as shown in D. Asterisks (**) indicate statistically significant differences from Ler with Dunnett’s multiple test (P < 0.01). (G and H) Root phenotypes of CLV1:GFP lines in the clv1-4 background. Error bars denote SEM (n = 24–28). Plants were grown as shown in D. Asterisks (**) indicate statistically significant differences from clv1-4 with Dunnett’s multiple test (P < 0.001). (I) Lateral root (LR) densities of clv1 mutants and CLV1:GFP lines in clv1-4 background classified by developmental stages. Plants were grown vertically on medium containing 100 μM NO3 for 7 d. Error bars denote SEM (n = 39–42). Significant differences at P < 0.05 with Tukey’s multiple test are indicated by different letters. (J) Relative frequency distribution of lateral root primordia and lateral roots. The relative frequency of lateral root primordia or lateral roots in each developmental stage is indicated by their percentage in the total number of lateral root initiation events. The size of each circle indicates the total lateral root density shown in I. (K and L) Localization of CLV1:GFP in roots. Green signals in longitudinal (K) and cross (L) sections of a primary root indicate localization of CLV:GFP fusion proteins in phloem companion cells (cc). The root was counter-stained with propidium iodide (red). c, cortex; cc, companion cell; en, endodermis; ep, epidermis; p, pericycle; x, xylem. [Scale bars, 100 μm (K) and 50 μm (L).] (M) CLE1 to seven transcripts overaccumulate in clv1 mutants. Results are shown as transcript abundance in clv1 mutants relative to the wild-type (Ler). Error bars denote SEM (n = 4). Significant differences with Dunnett’s multiple test at *P < 0.05 or **P < 0.01 are shown.
Fig. 3.
Fig. 3.
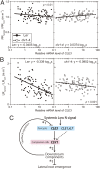
Effect of CLE3 in wild-type and clv1 mutant plants. (A and B) Correlation between root length and CLE3 mRNA levels in C3P3-expressing Ler or clv1-4 plants. Primary root (PR) length (A) and total lateral root (LR) length (B) of individual seedlings are given relative to the respective background line. Relative root length values were calculated by normalizing the values of individual samples (PRsample or LRsample) with those of the background lines (i.e., Ler or clv1-4) (PRcont or LRcont) (n = 14). Ler plants were used as standard samples for relative quantification of CLE3 mRNA levels by real-time RT-PCR. Closed and open symbols correspond to individual lines in Ler and clv1-4 backgrounds. A linear regression was calculated for the Ler (solid line) and clv1-4 background (dotted line). Plants were grown vertically on medium containing 100 μM NO3 for 11 d. The differences between the slopes in Ler and clv1-4 backgrounds are shown by P values of analysis of covariance. The details of the regression analysis and statistical values are summarized in Table S1. (C) Model for the regulation of lateral root development by the CLE-CLV1 signaling module. The N deficiency and the feedback mechanism counteractively modulate the amplitude of the CLE signals repressing the growth of lateral root primordia and their emergence from the primary root. Inhibitory signals (*1) and a positive signal (*2) can be opposite such that CLV1 represses a downstream positive factor.

References

    1. López-Bucio J, Cruz-Ramírez A, Herrera-Estrella L. The role of nutrient availability in regulating root architecture. Curr Opin Plant Biol. 2003;6(3):280–287. - PubMed
    1. Hodge A. The plastic plant: Root responses to heterogeneous supplies of nutrients. New Phytol. 2004;162(1):9–24.
    1. Robinson D. The responses of plants to non-uniform supplies of nutrients. New Phytol. 1994;127(4):635–674. - PubMed
    1. Gruber BD, Giehl RFH, Friedel S, von Wirén N. Plasticity of the Arabidopsis root system under nutrient deficiencies. Plant Physiol. 2013;163(1):161–179. - PMC - PubMed
    1. Drew MC. Comparison of the effects of a localised supply of phosphate, nitrate, ammonium and potassium on the growth of the seminal root system, and the shoot, in barley. New Phytol. 1975;75(3):479–490.

Publication types

MeSH terms