. 2014 Feb 4;111(5):E572-81.
doi: 10.1073/pnas.1319743111. Epub 2014 Jan 21.

Induced multipotency in adult keratinocytes through down-regulation of ΔNp63 or DGCR8

Affiliations

Induced multipotency in adult keratinocytes through down-regulation of ΔNp63 or DGCR8

Deepavali Chakravarti et al. Proc Natl Acad Sci U S A. .

Abstract

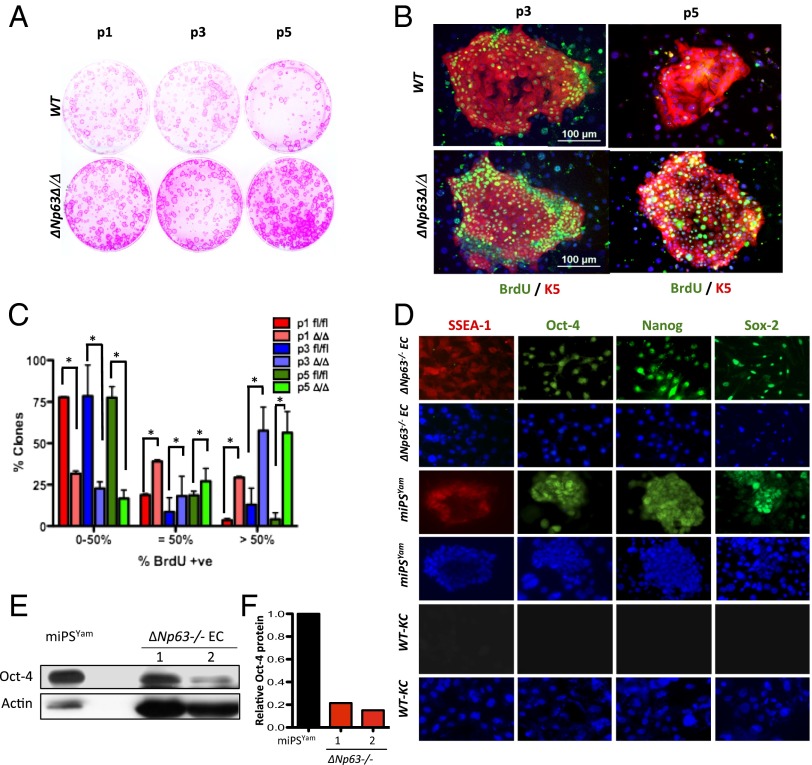
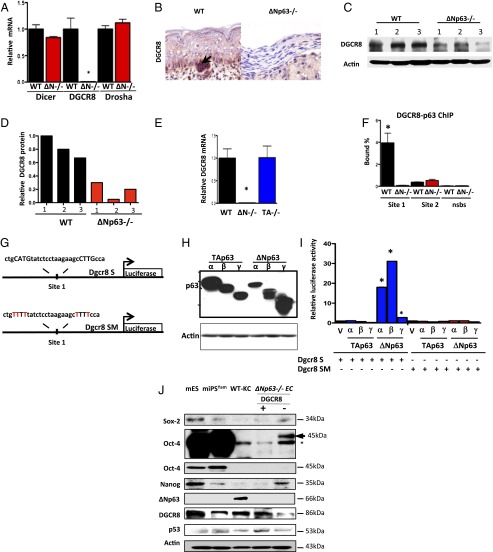
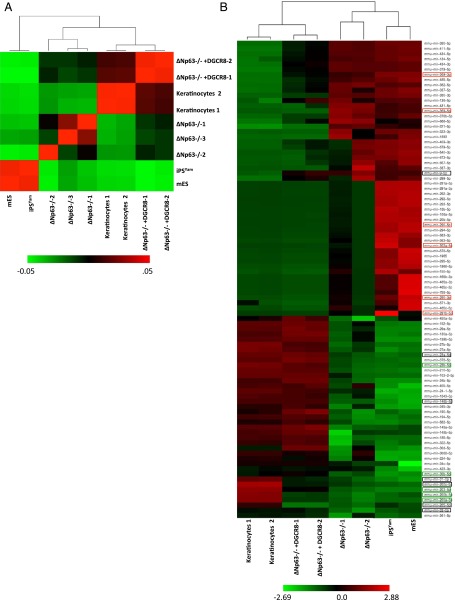
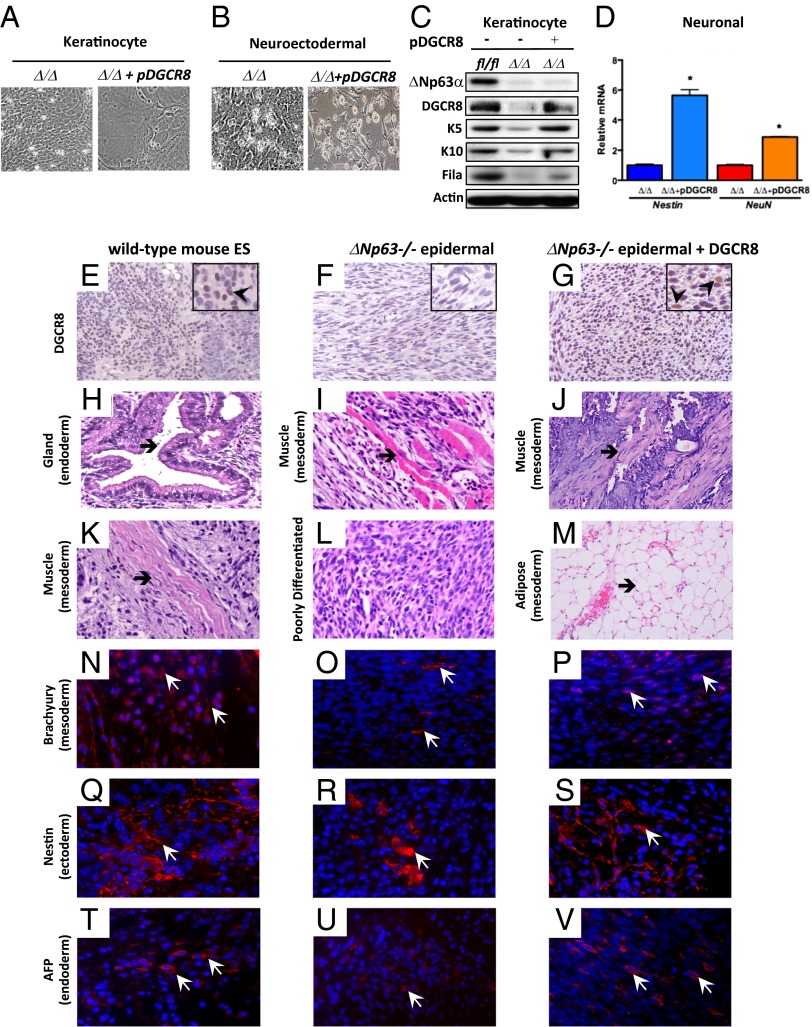
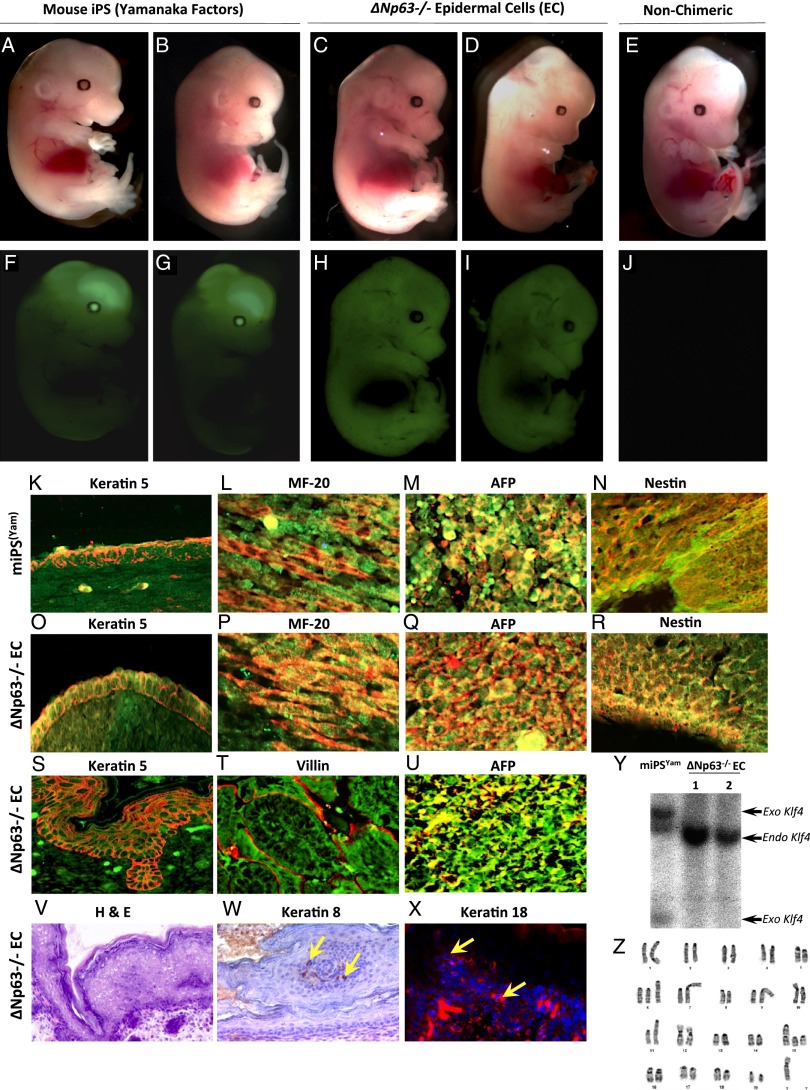
The roles of microRNAs (miRNAs) and the miRNA processing machinery in the regulation of stem cell biology are not well understood. Here, we show that the p53 family member and p63 isoform, ΔNp63, is a transcriptional activator of a cofactor critical for miRNA processing (DGCR8). This regulation gives rise to a unique miRNA signature resulting in reprogramming cells to multipotency. Strikingly, ΔNp63(-/-) epidermal cells display profound defects in terminal differentiation and express a subset of markers and miRNAs present in embryonic stem cells and fibroblasts induced to pluripotency using Yamanaka factors. Moreover, ΔNp63(-/-) epidermal cells transduced with an inducible DGCR8 plasmid can differentiate into multiple cell fates in vitro and in vivo. We found that human primary keratinocytes depleted of ΔNp63 or DGCR8 can be reprogrammed in 6 d and express a unique miRNA and gene expression signature that is similar but not identical to human induced pluripotent stem cells. Our data reveal a role for ΔNp63 in the transcriptional regulation of DGCR8 to reprogram adult somatic cells into multipotent stem cells.


Conflict of interest statement

The authors declare no conflict of interest.

Figures

Fig. 1.
Fig. 1.
ΔNp63-deficient epidermal cells are proliferative. (A) Epidermal colonies of the indicated genotypes stained with rhodamine B. Passages 1 (P1), 3 (P3), and 5 (P5) are shown. (B) Immunostaining for BrdU (green) and K5 (red) in P3 and P5 epidermal cells. (C) Quantification of BrdU incorporation in P1, P3, and P5 colonies after 8 d in culture. Asterisks indicate statistical significance (P < 0.001). (D) IF performed on the indicated cells using the indicated antibodies. (E) Western blot performed on lysates from miPSYam and ΔNp63−/− cells derived from two independent embryos (1 and 2) using the indicated antibodies. Actin was used as loading control. (F) Quantification of the Western blot in E.
Fig. 2.
Fig. 2.
DGCR8 is a transcriptional target of ΔNp63. (A) qRT-PCR for Dicer, DGCR8, and Drosha using total RNA from epidermal cell lines of the indicated genotypes. (B) IHC using an antibody for DGCR8 on skin samples from indicated mouse embryos. (C) Western blot analysis using lysates from WT and ΔNp63−/− epidermal cell lines derived from three independent embryos (1–3) using the indicated antibodies. Actin was used as loading control. (D) Quantification of the Western blot in C. All values were normalized to WT 1. (E) qRT-PCR for DGCR8 using total RNA from epidermal cell lines of the indicated genotypes. (F) Quantitative real-time PCR of DNA purified in ChIP assay using epidermal cell lines and p63-binding site (site 1), no binding of p63 to site 2, or nonspecific binding site (NSBS). (G) Schematic showing DGCR8 site 1 (Dgcr8 S) and DGCR8 mutant of site 1 (Dgcr8 SM) luciferase reporter genes. (H) Western blot analysis using lysates from p53−/−;p63−/− MEFs transfected with the indicated p63 isoforms. Actin was used as loading control. (I) Luciferase assay for DGCR8 in p53−/−;p63−/− MEFs transfected with the indicated plasmids. Each bar represents the average of the fold activation of three independent experiments. Values are normalized to p53−/−;p63−/− MEFs transfected with vector alone. The asterisks indicate statistical significance (P < 0.001). (J) Western blot analysis of mouse embryonic stem (mES) cells, mouse-induced pluripotent stem cells (miPSYam), WT-KCs, and ΔNp63−/− epidermal cell lines expressing DGCR8 (+) or not (−) using the indicated antibodies. Asterisk indicates nonspecific band. Upper Oct4 blot is a longer exposure of the one immediately below it. Actin was used as loading control.
Fig. 3.
Fig. 3.
miRNA signature of ΔNp63−/− epidermal cell lines. (A) Pearson’s correlation analysis from miRNA-Seq performed using the indicated samples. (B) Heat map showing supervised hierarchical clustering. Low miRNA expression is indicated in green and high expression in red. Boxes indicate miRNAs that were most significantly up- (red) or down- (green) regulated in the ∆Np63/iPS cell signature. The signature that was found to be most highly significant is boxed in black.
Fig. 4.
Fig. 4.
ΔNp63-deficient epidermal cell lines are multipotent. (A and B) ΔNp63-deficient epidermal cell lines (Δ/Δ) without or with DGCR8 (+pDGCR8) and cultured in keratinocyte media (A) or neuroectodermal media (B). (C) Western blot analysis of epidermal cell lines shown in A. (D) qRT-PCR for nestin and NeuN using total RNA from epidermal cell lines shown in B. (E–G) IHC analysis using teratomas of the indicated genotypes and an antibody for DGCR8 (200× magnification) and Insets (400× magnification). Arrowheads in Insets point to examples of positive cells. (H–M) H&E-stained cross sections of teratomas of the indicated genotypes. (N–V) IF of teratomas of the indicated genotypes. Arrowheads indicate examples of positive cells (red). Magnification, 200×.
Fig. 5.
Fig. 5.
Generation of chimeric mouse embryos from ΔNp63−/− epidermal cell lines. (A–E) Brightfield images of chimeric embryos at day 13.5 (E13.5) generated from mouse-induced pluripotent stem (miPS) cells expressing Yamanaka factors and GFP (Yamanaka factors) (A and B) or ΔNp63−/− epidermal cell lines expressing GFP (C and D). (E) Day E13.5 embryos from WT nonchimeric mice. (F–J) Fluorescent (GFP) images of chimeric embryos at E13.5 generated from Yamanaka miPS cells expressing GFP (Yamanaka factors) (F and G) or ΔNp63−/− epidermal cell lines expressing GFP (H and I). (J) Day E13.5 embryos from WT nonchimeric mice. (K–R) Double immunofluorescence for GFP (green) and the indicated tissue-specific markers for the basal cells of the epidermis (keratin5, red) (K and O), muscle (MF-20, red) (L and P), liver (AFP, red) (M and Q), and brain (nestin, red) (N and R) on day E13.5 embryos generated from Yamanaka miPS cells expressing GFP (Yamanaka factors) or ∆Np63−/− epidermal cell lines as indicated. (S–U) Double immunofluorescence of E18.5 chimeric embryos generated from ∆Np63−/− epidermal cell lines for GFP (green) and tissue-specific markers for the basal cells of the epidermis (keratin 5, red) (S), intestine (villin, red) (T), and liver (AFP, red) (U). DAPI (blue) or hematoxylin (purple) was used as counterstain. Magnification, 200×. (V–X) Cross sections from skin of E18.5 chimeric embryos generated from ∆Np63−/− epidermal cell lines and stained with H&E (V), keratin 8 (brown) (W), and keratin 18 (red) (X). Yellow arrows indicate examples of positive cells. (Y) Southern blot analysis using genomic DNA extracted from mouse iPS cells reprogrammed with Yamanaka factors (miPSYam) and ∆Np63−/− epidermal cell lines. A probe for Klf4 was used to indicate endogenous (endo) and exogenous (exo) Klf4 DNA. (Z) Representative image of karyotypic analysis of ∆Np63−/− epidermal cell lines.
Fig. 6.
Fig. 6.
NHEKs deficient for ∆Np63 or DGCR8 are pluripotent and form teratomas. (A–T) IF using normal human epidermal keratinocytes of the indicated genotypes and antibodies. (U–B′) Micrographs of H&E-stained cross sections. (C′–T′) Double IF performed on teratomas generated using an antibody against the indicated tissue-specific proteins (red) (C′, F′, I′, L′, O′, and R′) and GFP (green) (D′, G′, J′, M′, P′, and S′). Merged panels are shown for each (E′, H′, K′, N′, Q′, and T′). Magnification, 200×.

References

    1. Takahashi K, Yamanaka S. Induction of pluripotent stem cells from mouse embryonic and adult fibroblast cultures by defined factors. Cell. 2006;126(4):663–676. - PubMed
    1. Hong H, et al. Suppression of induced pluripotent stem cell generation by the p53-p21 pathway. Nature. 2009;460(7259):1132–1135. - PMC - PubMed
    1. Kawamura T, et al. Linking the p53 tumour suppressor pathway to somatic cell reprogramming. Nature. 2009;460(7259):1140–1144. - PMC - PubMed
    1. Li H, et al. The Ink4/Arf locus is a barrier for iPS cell reprogramming. Nature. 2009;460(7259):1136–1139. - PMC - PubMed
    1. Marión RM, et al. A p53-mediated DNA damage response limits reprogramming to ensure iPS cell genomic integrity. Nature. 2009;460(7259):1149–1153. - PMC - PubMed

Publication types

MeSH terms