. 2014 Apr;15(4):451-69.
doi: 10.1111/tra.12154.

Adaptor protein2 (AP2) orchestrates CXCR2-mediated cell migration

Affiliations

Adaptor protein2 (AP2) orchestrates CXCR2-mediated cell migration

Dayanidhi Raman et al. Traffic. 2014 Apr.

Abstract

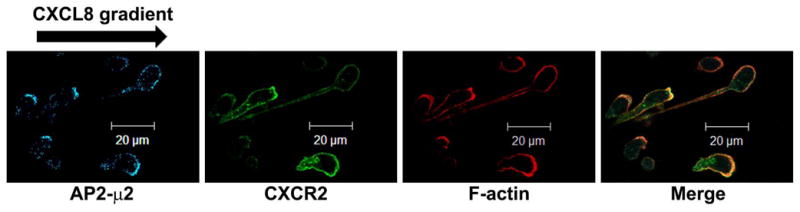
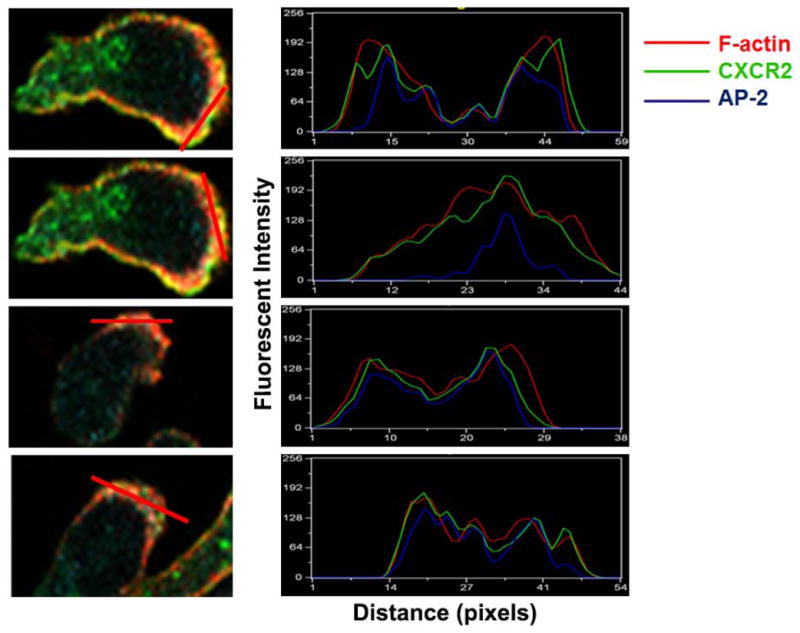
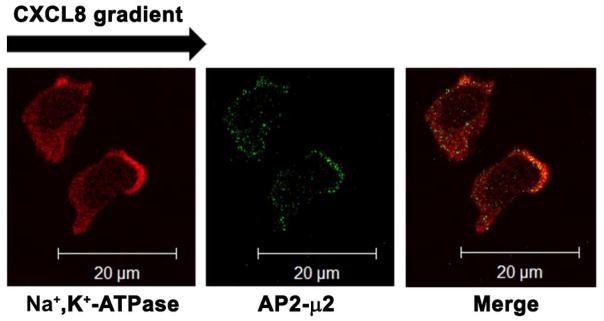
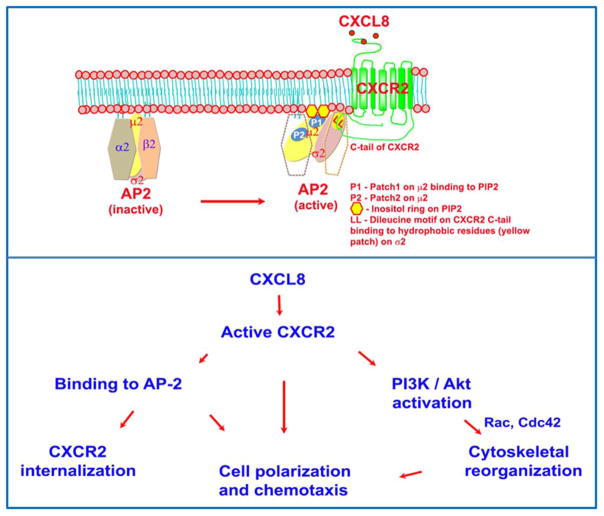
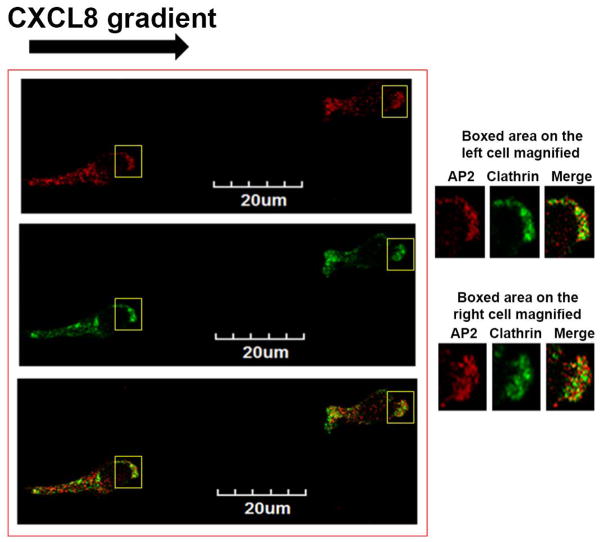
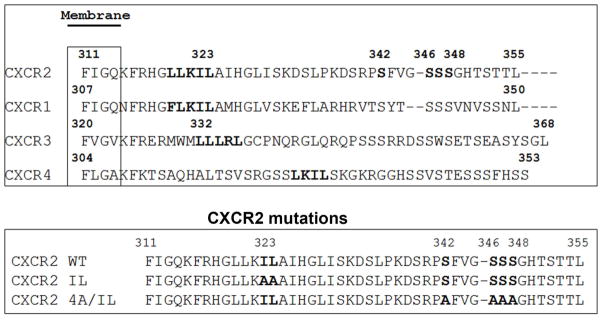
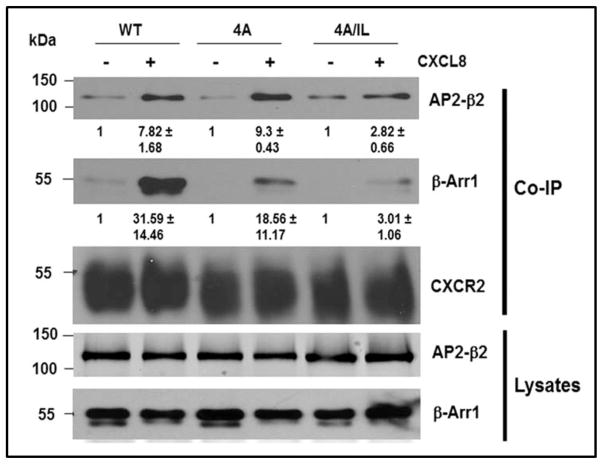
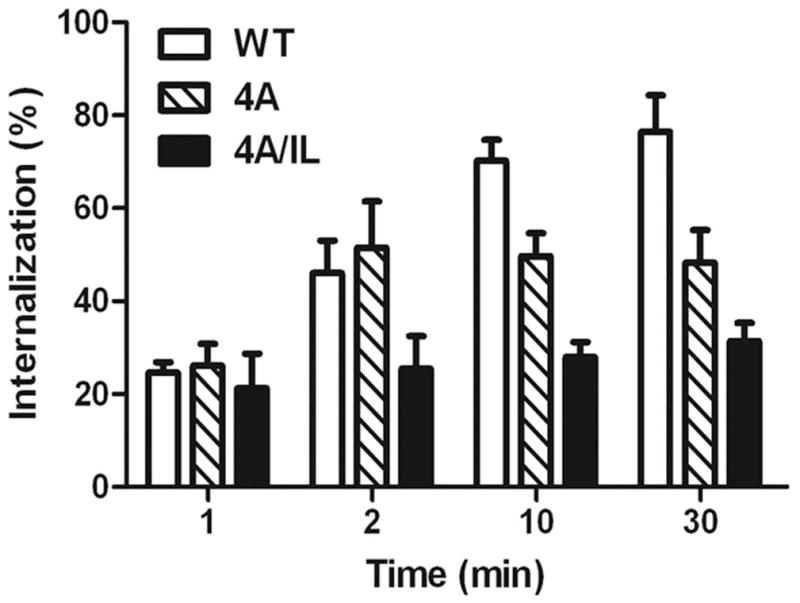
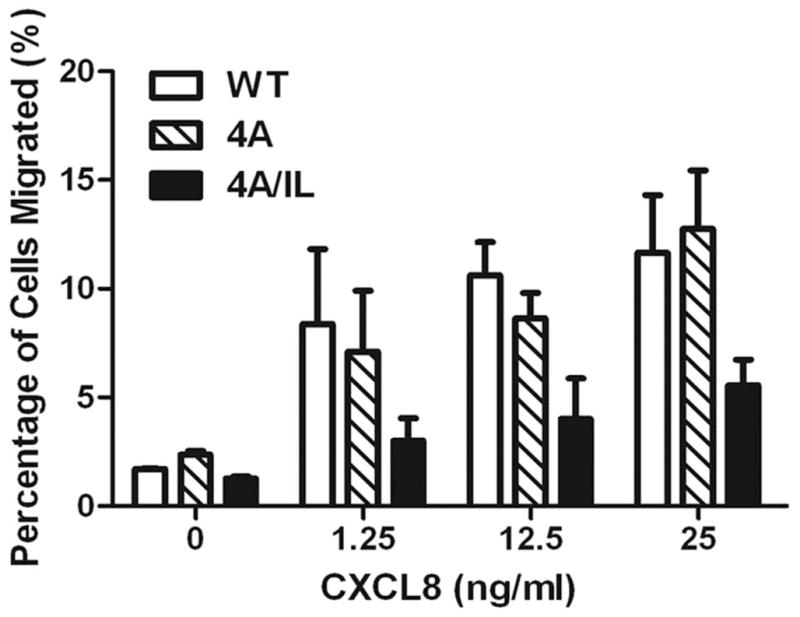
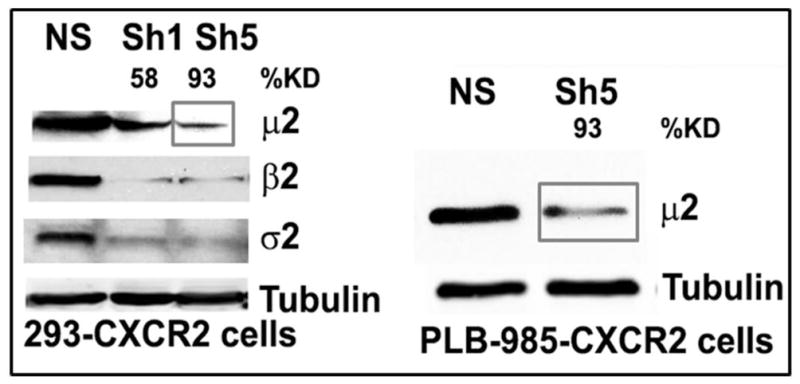
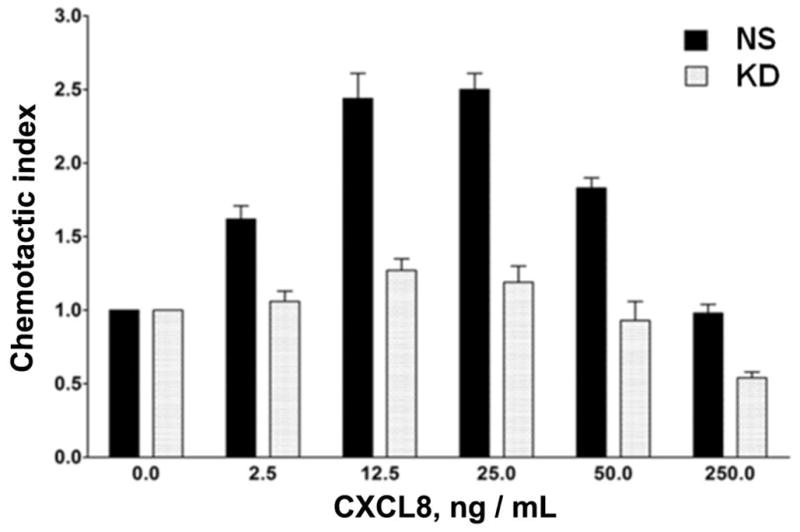
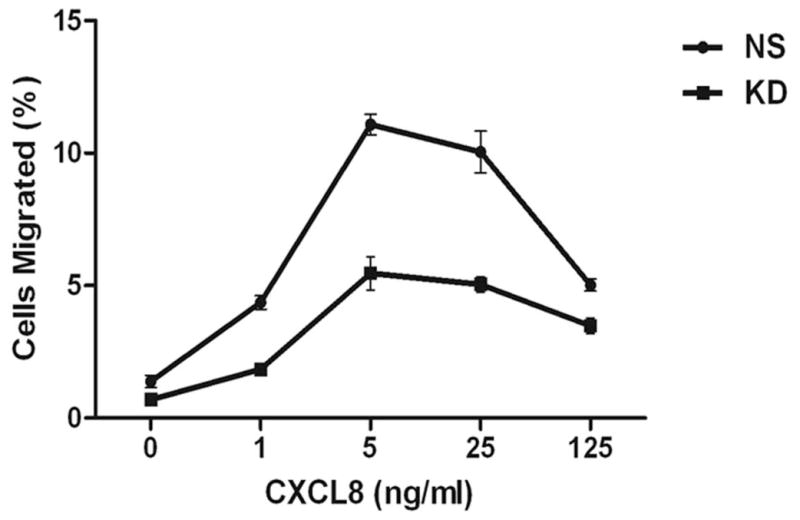
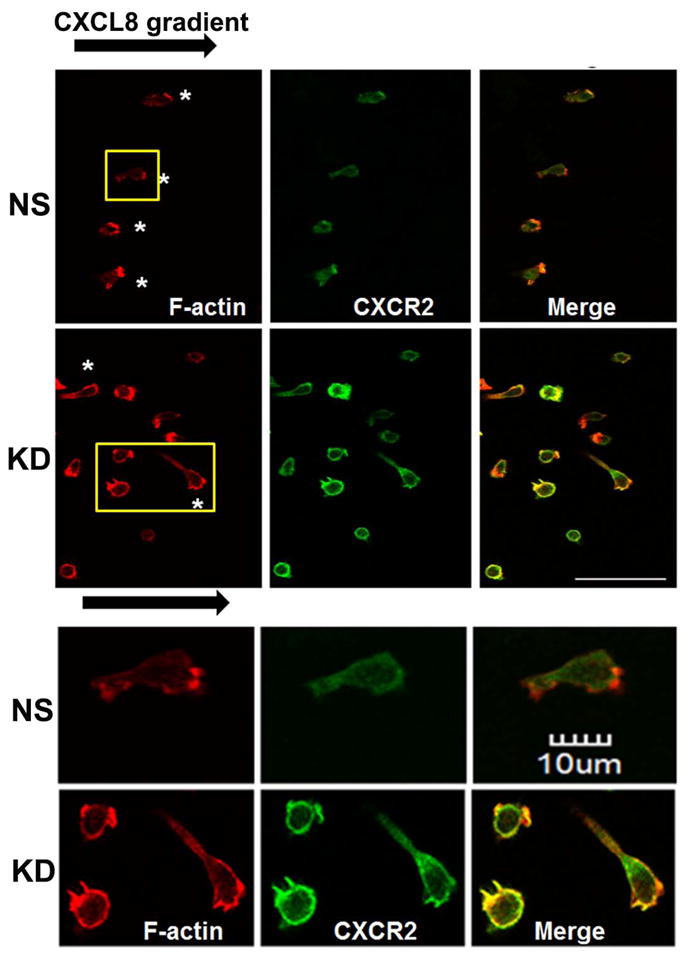
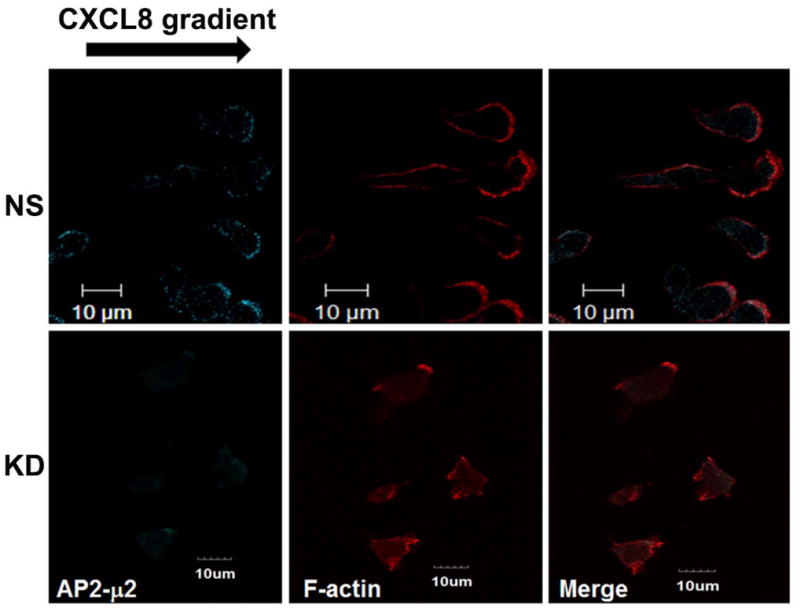
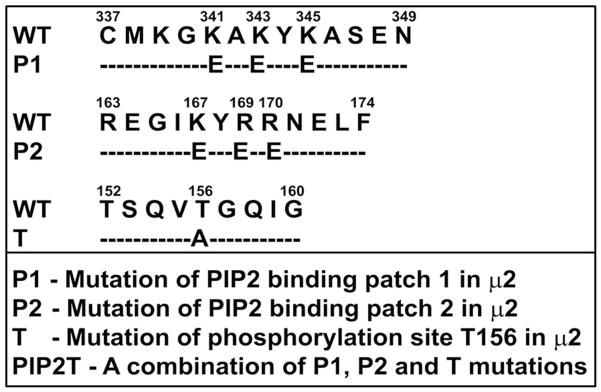
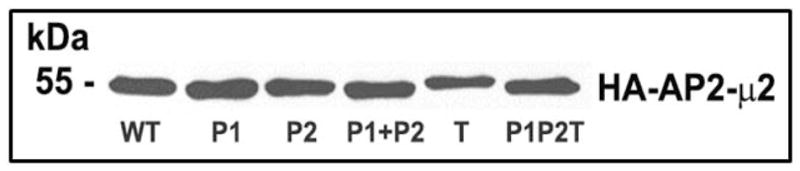
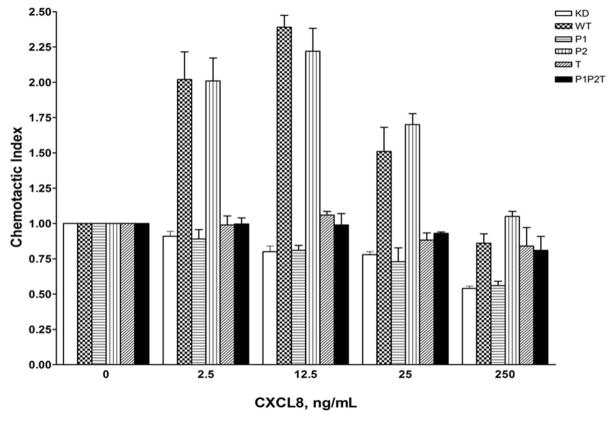
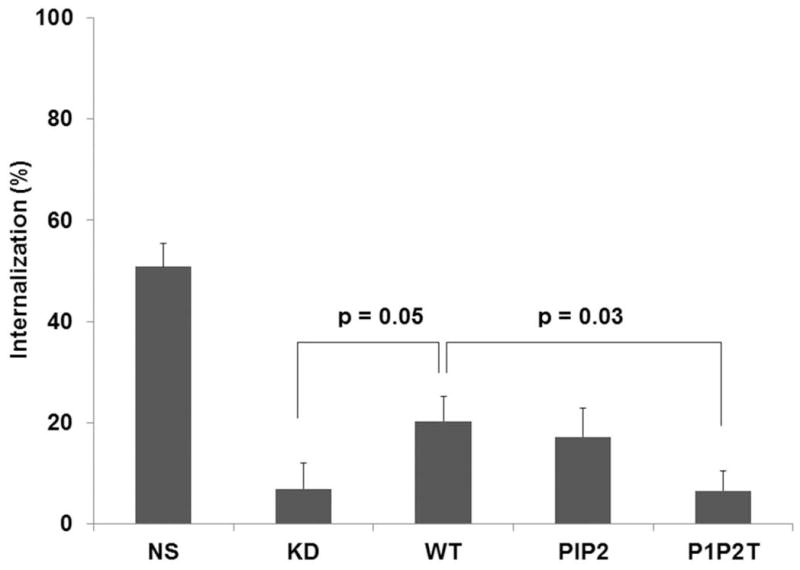
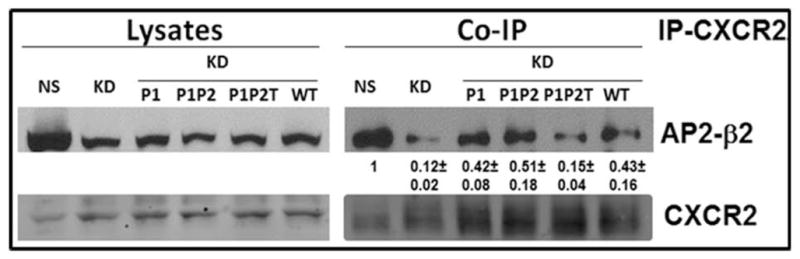
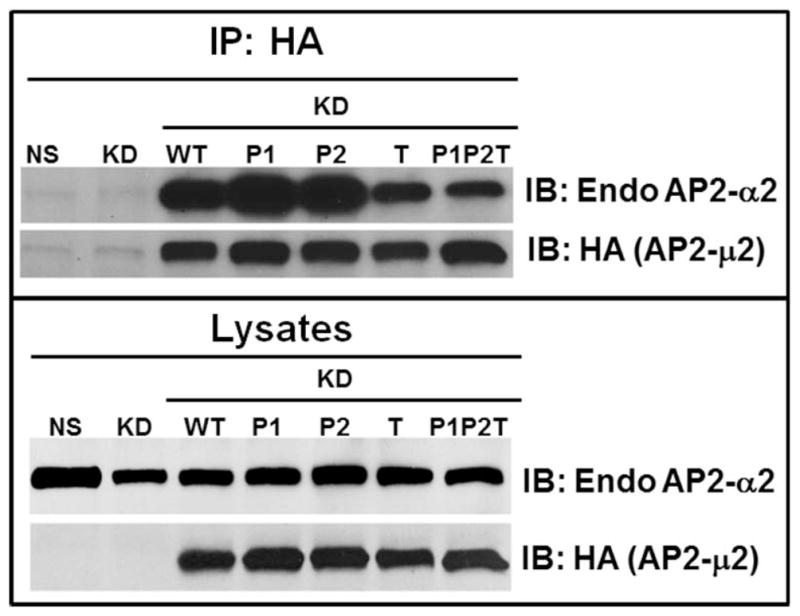
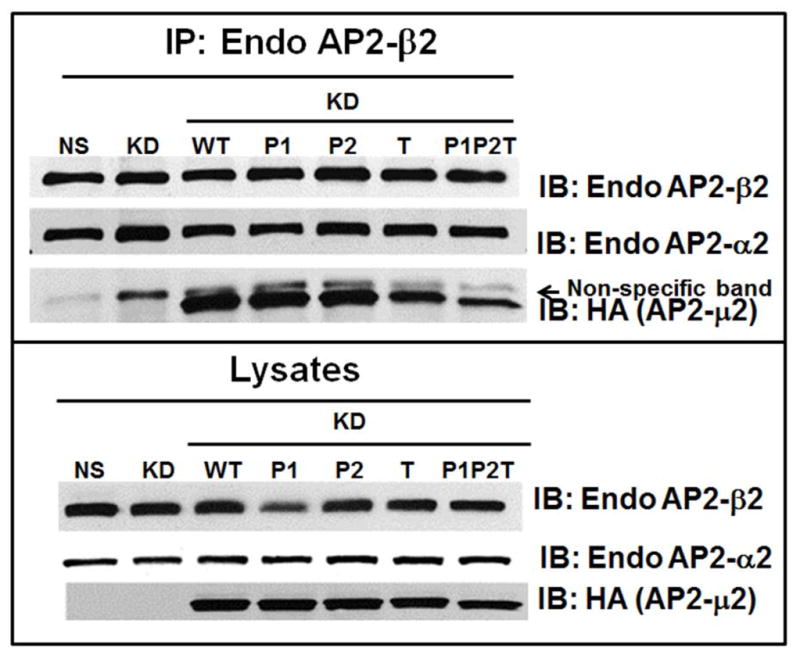
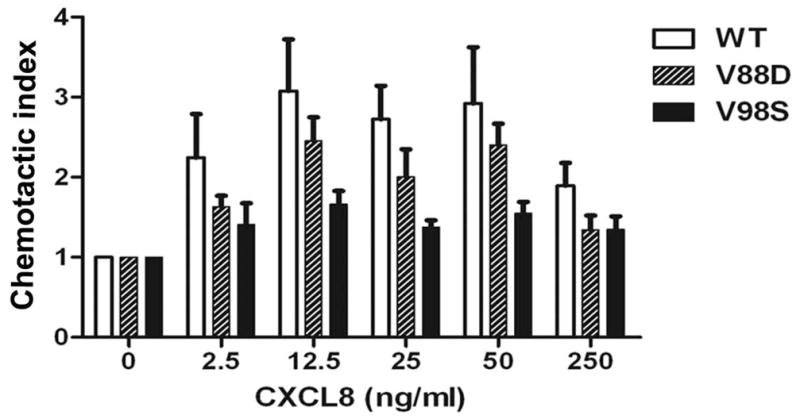
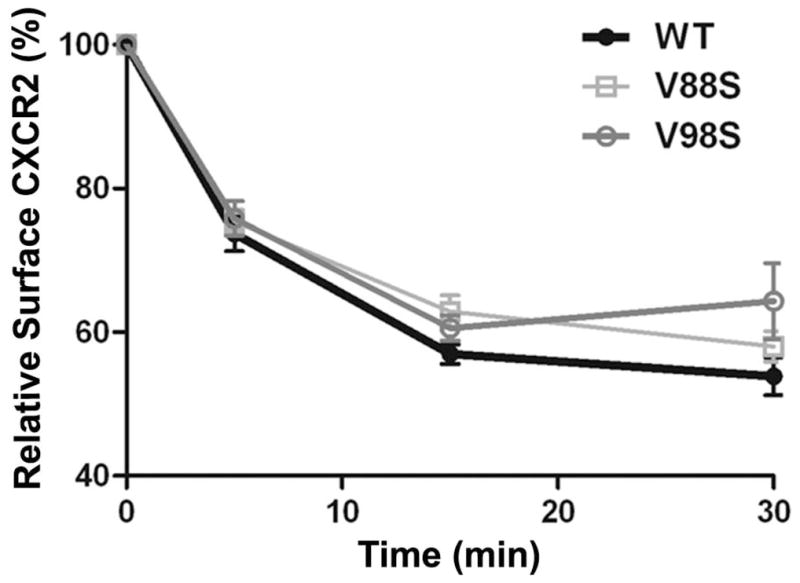
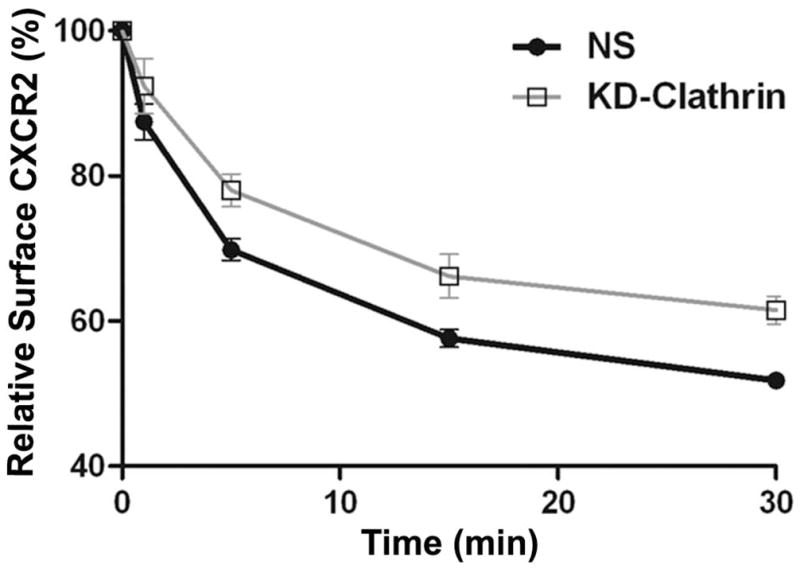
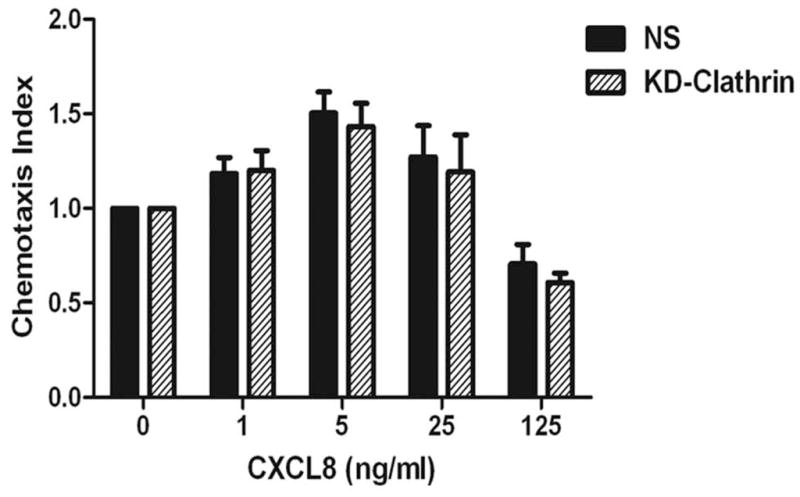
The chemokine receptor CXCR2 is vital for inflammation, wound healing, angiogenesis, cancer progression and metastasis. Adaptor protein 2 (AP2), a clathrin binding heterotetrameric protein comprised of α, β2, μ2 and σ2 subunits, facilitates clathrin-mediated endocytosis. Mutation of the LLKIL motif in the CXCR2 carboxyl-terminal domain (CTD) results in loss of AP2 binding to the receptor and loss of ligand-mediated receptor internalization and chemotaxis. AP2 knockdown also results in diminished ligand-mediated CXCR2 internalization, polarization and chemotaxis. Using knockdown/rescue approaches with AP2-μ2 mutants, the binding domains were characterized in reference to CXCR2 internalization and chemotaxis. When in an open conformation, μ2 Patch 1 and Patch 2 domains bind tightly to membrane PIP2 phospholipids. When AP2-μ2, is replaced with μ2 mutated in Patch 1 and/or Patch 2 domains, ligand-mediated receptor binding and internalization are not lost. However, chemotaxis requires AP2-μ2 Patch 1, but not Patch 2. AP2-σ2 has been demonstrated to bind dileucine motifs to facilitate internalization. Expression of AP2-σ2 V88D and V98S dominant negative mutants resulted in loss of CXCR2 mediated chemotaxis. Thus, AP2 binding to both membrane phosphatidylinositol phospholipids and dileucine motifs is crucial for directional migration or chemotaxis. Moreover, AP2-mediated receptor internalization can be dissociated from AP2-mediated chemotaxis.

Keywords: AP2; AP2-μ2; AP2-σ2; CXCR2; PIP2 patches; chemotaxis; internalization.


Figures

Figure 1
Figure 1. CXCR2 co-localizes with AP2-μ2 and clathrin fails to polarize in neutrophil-like dHL-60 CXCR2 cells upon stimulation with CXCL +8
A) Confocal images of dHL-60-CXCR2 cells that were directionally stimulated with 50 ng/ml of CXCL8 for 10 min. CXCR2, AP2-μ2 and F-actin were pseudo-colored green, cyan and red respectively. Images represent single z-stack sections of 0.5 μm. Scale bar – 20 μm. B) Line scan analysis of representative dHL-60-CXCR2 cells from fig.1A. The enlarged confocal image of the individual cells is shown on the left and the corresponding line scan distribution profile of fluorescence intensities of F-actin, CXCR2 and AP-2 obtained by Metamorph analysis is shown on the right. Red trace – F-actin; Green trace – CXCR2; Blue trace – AP-2. C) Confocal images of neutrophil-like dHL-60-CXCR2 cells were directionally stimulated with 50 ng / ml of CXCL8 for 10 min. Na+, K+-ATPase and AP2-μ2 were pseudo-colored red and green respectively. Images represent single z-stack sections of 0.5 μm. Scale bar – 20 μm. D) Representative confocal images of dPLB-985-CXCR2 cells that were directionally stimulated with 50 ng / ml of CXCL8 for 10 min are shown. AP2 and clathrin were pseudo-colored red and green respectively (left panel). Enlarged areas of the leading edges of the polarized cells were depicted on the right top and right bottom panels.
Figure 2
Figure 2. AP2 is essential for CXCR2-mediated chemotaxis, but β-arrestin1 is dispensable
A) Top panel: LLKIL motif in CTDs of human CXC chemokine receptors is conserved. The CTDs of CXCR2 (45 residues), CXCR1 (44 residues), CXCR3 (49 residues) and CXCR4 (47 residues) were aligned with CLUSTALW (1.83) multiple sequence alignment program. The LLKIL functional motif of CXCR2 and similar putative motifs in other CXC receptor CTDs are in bold. Also, the serine residues known to be phosphorylated in CXCR2 CTD in response to CXCL8 stimulation are in bold. Bottom panel: The mutations in CXCR2 important for binding of AP2 and β-arrestin are illustrated. B) Decreased association of CXCR2 mutants with AP2 and/or β-arrestin1 after stimulation with CXCL8. dHL-60 cells stably expressing CXCR2-WT, 4A or CXCR2-4A/IL mutants were stimulated with or without CXCL8. CXCR2 was immunoprecipitated with anti-CXCR2 antibody, and blotted for AP2-β2 subunit or β-arrestin1. The blot was stripped and re-blotted for CXCR2. The relative values of fold increase in response to CXCL8 stimulation for each cell line calculated from 3 independent experiments is shown under the western blots (fold ± S.E.M.). One tenth of the total lysate input for co-immunoprecipitation was used for Western analysis of the total lysates. C) CXCL8-mediated internalization of CXCR2 is abolished in 4A/IL mutant of CXCR2, but only partially attenuated in 4A-CXCR2 mutant. The internalization of CXCR2 was performed by following the internalization of 125I-CXCL8 in dHL60-CXCR2 cells stably expressing CXCR2-WT, 4A or 4A/IL mutant. Error bars are S.E.M and the experiments were repeated 3 times with duplicates for each treatment. ANOVA: 2 min – 4A vs. 4A/IL, p<0.05; 10 min - WT vs. 4A/IL, p<0.001; 30 min – WT vs. 4A, p<0.05 and WT vs. 4A/IL, p<0.001. D) Impairment of CXCR2-mediated chemotaxis when association of AP-2 with CXCR2 is ablated by site-directed mutagenesis0. Chemotaxis assays were performed in a modified Boyden chamber with dHL-60 cells stably expressing CXCR2 WT, 4A, or 4A/IL mutants. Error bars are S.E.M and experiments were repeated 3 times with 5 replicates each treatment. ANOVA: CXCL8 12.5 ng/mL - WT vs. 4A/IL, p<0.01; 4A vs. 4A/IL, p<0.05; CXCL8 25 ng/mL - WT vs. 4A/IL, p<0.05; 4A vs. 4A/IL, p<0.01; WT vs. 4A at all of the time points – n.s.
Figure 3
Figure 3. Stable silencing of AP2-μ2 impairs CXCR2-mediated chemotaxis
A) Stable knock down of the AP2-μ2 subunit in HEK-293-CXCR2 and PLB-985-CXCR2 cells. Two shRNA constructs sh5 and sh1 were employed to knock down AP2-μ2 in HEK-293-CXCR2 cells and one shRNA construct sh5 was utilized in PLB-985-CXCR2 cells. NS - Non-silencing; % KD – Level of AP2-μ2 knock down. β-tubulin serves as the loading control. B) Stable silencing of the AP2-μ2 subunit impairs CXCR2-mediated chemotaxis in HEK-293-CXCR2 cells. Chemotaxis assays were performed in a modified Boyden chamber. Data were plotted from two independent experiments with 3 replicates in each experiment. NS - Non-silencing; KD-5 - AP2-μ2 knock down; Error bar = S.E.M.; ANOVA: NS vs. KD – for 12.5, 25, and 50 ng / ml CXCL8, p < 0.001; for 2.5 ng / ml CXCL8, p < 0.01; for 250 ng / mL CXCL8, p < 0.05. C) Impairment of CXCR2-mediated chemotaxis of dPLB-985-CXCR2 cells with stable knock down of the AP2-μ2 subunit. Chemotaxis assays were performed in a modified Boyden chamber. Data were plotted from two independent experiments with 4–6 replicates in each experiment. NS - Non-silencing; KD - AP2-μ2 knock down; Error bars - S.E.M. ANOVA: NS vs. KD, p < 0.001 for 1, 5 and 25 ng / mL of CXCL8 and p<0.05 for 125 ng / mL of CXCL8. D) Impairment of polarization of dPLB-985-CXCR2 cells toward the CXCL8 gradient when AP2-μ2 subunit was stably knocked down. Confocal images of dPLB-985-CXCR2 cells were directionally stimulated with 50 ng / ml of CXCL8 in the Zigmond chamber for 10 min. F-actin and CXCR2 were pseudo-colored red and green respectively. Images represent single z-stack sections of 0.5 μm. NS – Non-silenced; KD - AP2-μ2 knock down; Scale bar – 50 μm. An enlarged view of some cells is shown below. E) Comparison of AP-μ2 at the leading edge in polarized dPLB-985-CXCR2 cells with and without AP-μ2 knock down. Confocal images of dPLB-985-CXCR2 cells were directionally stimulated with 50 ng / ml of CXCL8 in the Zigmond chamber for 10 min. F-actin and CXCR2 were pseudo-colored red and green respectively. Images represent single z-stack sections of 0.5 μm. NS – Non-silenced; KD - AP2-μ2 knock down. F) CXCL8-mediated internalization of CXCR2 is attenuated after stable silencing of AP2-μ2 subunit in HEK-293-CXCR2 cells. Non-silencing (NS) and AP2-μ2 knock down (KD) HEK-293-CXCR2 cells (2–5 × 10⁵ cells) were stimulated with 100 ng / ml CXCL8 for different time points, the non-internalized cell surface CXCR2 was quantified by FACS analysis as described in ‘Methods’. The geometric mean of the fluorescence intensity of cell surface CXCR2 was plotted. Error bars - S.E.M. ANOVA: 15 min and 30 min - NS vs. KD – p<0.01.
Figure 4
Figure 4. Patch 1 electropositive residues of AP2-μ2 that bind to PIP2 are critical for CXCR2-mediated chemotaxis
A) Schematic diagram of the different site-directed mutants of AP2-μ2 subunit. The PIP2 binding elements (Patch 1 and 2 residues of AP2-μ2) and the phosphorylation site (T156) were differentially mutated and assessed for their role in CXCR2-mediated chemotaxis. B) Transient expression profile of AP2-μ2 mutants in HEK-293-CXCR2 cells. HA-tagged shRNA-resistant WT, patch 1 (P1), patch 2 (P2), patch 1 and 2 (P1+P2), phosphorylation site (T) and a combination (P1P2T) mutants were transiently overexpressed in HEK-293-CXCR2 cells where AP2-μ2 had been stably knocked down. The proteins from the lysate were separated by 10%SDS-PAGE and analyzed by Western blotting. C) Patch 1 and phosphorylation site T156 but not Patch 2 residues of the AP2-μ2 subunit were vital for CXCR2-mediated chemotaxis. Patch 1 (P1), Patch 2 (P2), phosphorylation site (T156) and the combination (P1P2T) AP2-μ2 mutants were evaluated for their ability to rescue the chemotaxis from the effects of μ2 knock down. The chemotactic index was plotted from three independent experiments with duplicates in each experiment. KD = AP2-μ2-sh5; Error bars - S.E.M. ANOVA: KD vs. WT and WT vs P2 – 2.5, 12.5, 25 and 250 ng / ml CXCL8, p<0.001; KD vs. P1, T and P1P2T – At all concentrations of CXCL8 – p= n.s. D) CXCL8-mediated internalization of CXCR2 is partially rescued by AP2-μ2-WT after stably knocking down the AP2-μ2 subunit in HEK-293-CXCR2 cells. Non-silencing HEK-293 (NS), HEK-293-μ2-sh5 cells and HEK-293-μ2-sh5 cells with transient over-expression of AP2-μ2-WT, AP2-μ2-P1P2 and AP2-μ2 mutant (P1P2T) were stimulated with 100 ng / ml CXCL8 for 5 min and the non-internalized plasma membrane-bound CXCR2 was quantified by FACS analysis as described in ‘Methods’. The geometric mean of the fluorescence intensity was used to calculate the percentage of cell surface CXCR2. KD = AP2-μ2-sh5; ANOVA: KD vs. WT, p= 0.05; KD+WT vs. KD+P1P2T, p=0.03; KD+WT vs. KD+P1P2, p=not significant (n.s.).
Figure 5
Figure 5. Patch 1 and Patch 2 residues of the AP2-μ2 subunit that bind to PIP2 lipid are not critical for the binding of the AP2 complex to CXCR2
A) Non-silencing (NS), HEK-293-μ2-KD cells and HEK-293-μ2-KD cells with transiently over-expressed AP2-μ2 mutants (P1, P1+P2, P1P2T and WT) were serum starved, stimulated with 100 ng /ml CXCL8 and cross-linked with DSP. The cells were lysed and a CXCR2 co-immunoprecipitation assay was performed. The CXCR2 associated proteins were eluted with 50 mM DTT and separated by 10%SDS-PAGE. The CXCR2 associated AP2 complex was probed with an anti-β2 antibody. Experiments were repeated 3 times and the mean band densities as normalized to co-immunoprecipitation with CXCR2 ±S. D. are shown. B) HA-AP2-μ2 associates with endogenous α2 subunit of AP-2. HEK-293-μ2-KD cells with transiently over-expressed HA-AP2-μ2 mutants (P1, P1+P2, T, P1P2T and WT), were lysed subjected to Western blot analysis for α2 and HA-μ2 subunits (upper panel). Each HA-tagged μ2 subunit was immunoprecipitated with anti-HA-agarose and blotted for endogenous α2 and for HA-μ2 (upper panel). A representative blot from 3 individual experiments is shown. C) Functional AP-2 complexes successfully incorporate transiently expressed HA-AP2-μ2 as shown by a reciprocal co-immunoprecipitation. A reciprocal co-immunoprecipitation of the endogenous AP2-β2 from 1.5 mg of total lysate shows that the functional AP-2 complexes contain both endogenous AP2-α2 and overexpressed HA-AP2-μ2. One thirtieth (1/30) of the total lysate input for co-immunoprecipitation was used for Western analysis of the total lysates. The top panel shows co-immunoprecipitation and the bottom panel shows the lysates. A representative blot from 2 individual experiments is shown.
Figure 6
Figure 6. Over-expression of the dominant negative AP2-σ2 inhibits CXCR2-mediated chemotaxis without significantly affecting the internalization of CXCR2
A) WT and dominant negative V88D and V98S AP2-σ2 constructs were transiently over-expressed in HEK-293-CXCR2 cells and chemotaxis assays were performed in a modified Boyden chamber as described in ‘Methods’. Experiments were repeated 3 times with triplicates in each treatment. ANOVA: WT vs. V88D, p = 0.03; WT vs. V98S, p < 0.001. B) CXCR2 internalization assay was performed with FACS analysis as described in ‘Methods’. The geometric mean of the fluorescence intensity was used to calculate the percentage of cell surface CXCR2. ANOVA: WT vs. V88D, p= 0.0262; WT vs. V98S, p = 0.0279. Bonferroni post-hoc tests – WT vs. V98S at 30 min (p < 0.05).
Figure 7
Figure 7. Transient knock down of clathrin heavy chain impedes CXCR2 internalization but has little effect on CXCR2-mediated chemotaxis
A) siRNA targeting the heavy chain of clathrin was transfected into HEK-293 cells stably expressing CXCR2 and the efficiency of the knock down was assessed by Western blotting with actin serving as the loading control. B) CXCR2 internalization assay was performed with FACS analysis as described in “Methods”. Error bars are S.E.M and experiments were repeated 3 times with triplicates in each treatment. ANOVA: NS vs. KD-clathrin, p < 0.0001. Bonferroni post-hoc tests show significant differences at 5 and 15 min (p < 0.05) and highly significant difference at 30 min (p < 0.01). C) Chemotaxis assays were performed in a modified Boyden chamber as described in ‘Methods’. Error bars are S.E.M and experiments were repeated 3 times with 2–3 replicates in each treatment. ANOVA: NS vs. KD-clathrin, p = 0.512. Bonferroni post-hoc test - All data points – N.S.

References

    1. Arai H, Charo IF. Differential regulation of G-protein-mediated signaling by chemokine receptors. The Journal of biological chemistry. 1996;271(36):21814–21819. - PubMed
    1. Addison CL, Daniel TO, Burdick MD, Liu H, Ehlert JE, Xue YY, Buechi L, Walz A, Richmond A, Strieter RM. The CXC chemokine receptor 2, CXCR2, is the putative receptor for ELR+ CXC chemokine-induced angiogenic activity. J Immunol. 2000;165(9):5269–5277. - PubMed
    1. Devalaraja RM, Nanney LB, Du J, Qian Q, Yu Y, Devalaraja MN, Richmond A. Delayed wound healing in CXCR2 knockout mice. J Invest Dermatol. 2000;115(2):234–244. - PMC - PubMed
    1. Matsuo Y, Raimondo M, Woodward TA, Wallace MB, Gill KR, Tong Z, Burdick MD, Yang Z, Strieter RM, Hoffman RM, Guha S. CXC-chemokine/CXCR2 biological axis promotes angiogenesis in vitro and in vivo in pancreatic cancer. Int J Cancer. 2009;125(5):1027–1037. - PubMed
    1. Raman D, Baugher PJ, Thu YM, Richmond A. Role of chemokines in tumor growth. Cancer Lett. 2007;256(2):137–165. - PMC - PubMed

Publication types

LinkOut - more resources