. 2013 Apr 16;1(1):13.
doi: 10.1186/2049-2618-1-13.

Early microbial and metabolomic signatures predict later onset of necrotizing enterocolitis in preterm infants

Affiliations

Early microbial and metabolomic signatures predict later onset of necrotizing enterocolitis in preterm infants

Ardythe L Morrow et al. Microbiome. .

Abstract

Background: Necrotizing enterocolitis (NEC) is a devastating intestinal disease that afflicts 10% of extremely preterm infants. The contribution of early intestinal colonization to NEC onset is not understood, and predictive biomarkers to guide prevention are lacking. We analyzed banked stool and urine samples collected prior to disease onset from infants <29 weeks gestational age, including 11 infants who developed NEC and 21 matched controls who survived free of NEC. Stool bacterial communities were profiled by 16S rRNA gene sequencing. Urinary metabolomic profiles were assessed by NMR.

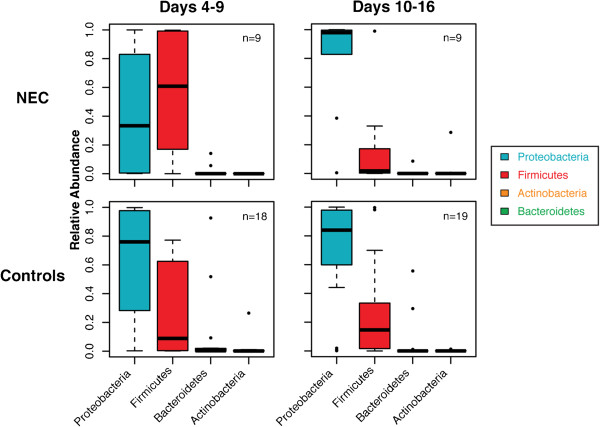
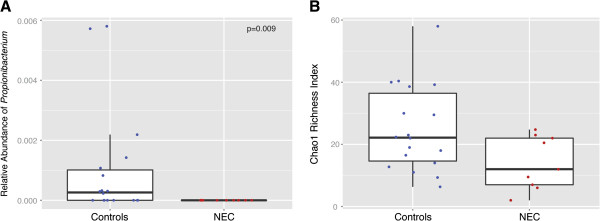
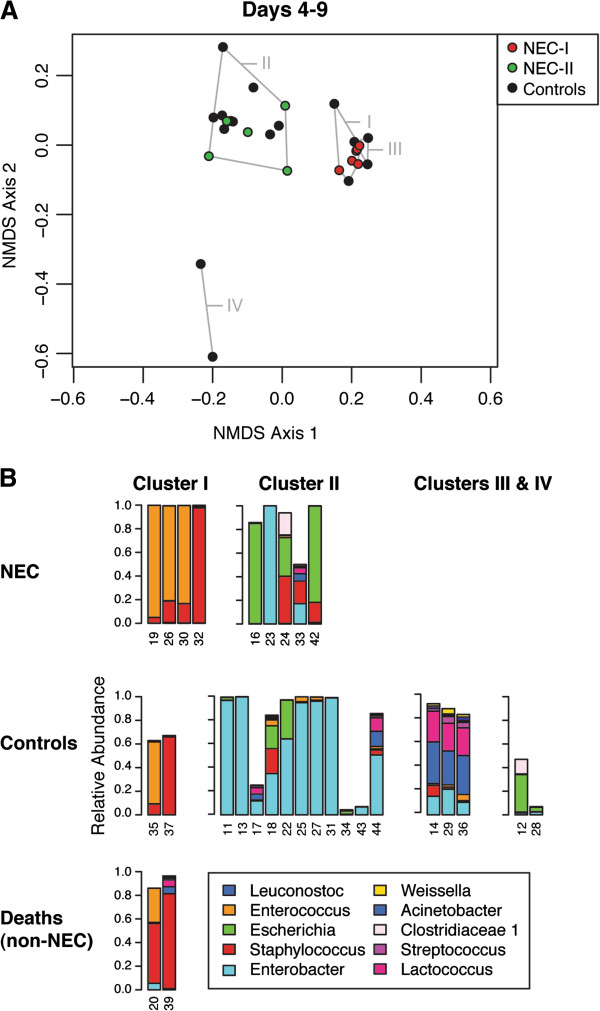
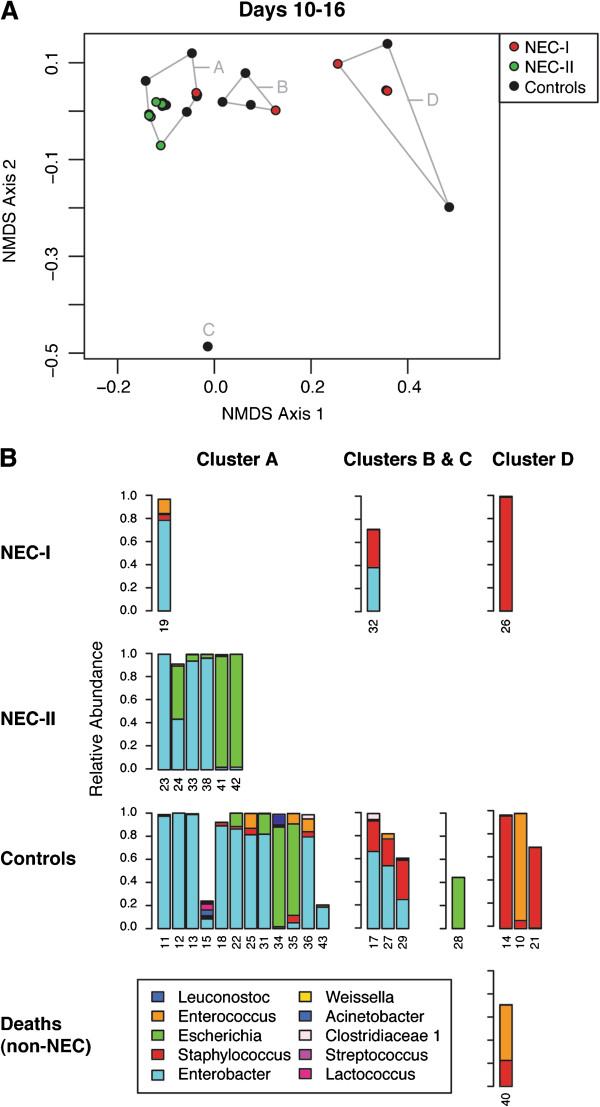
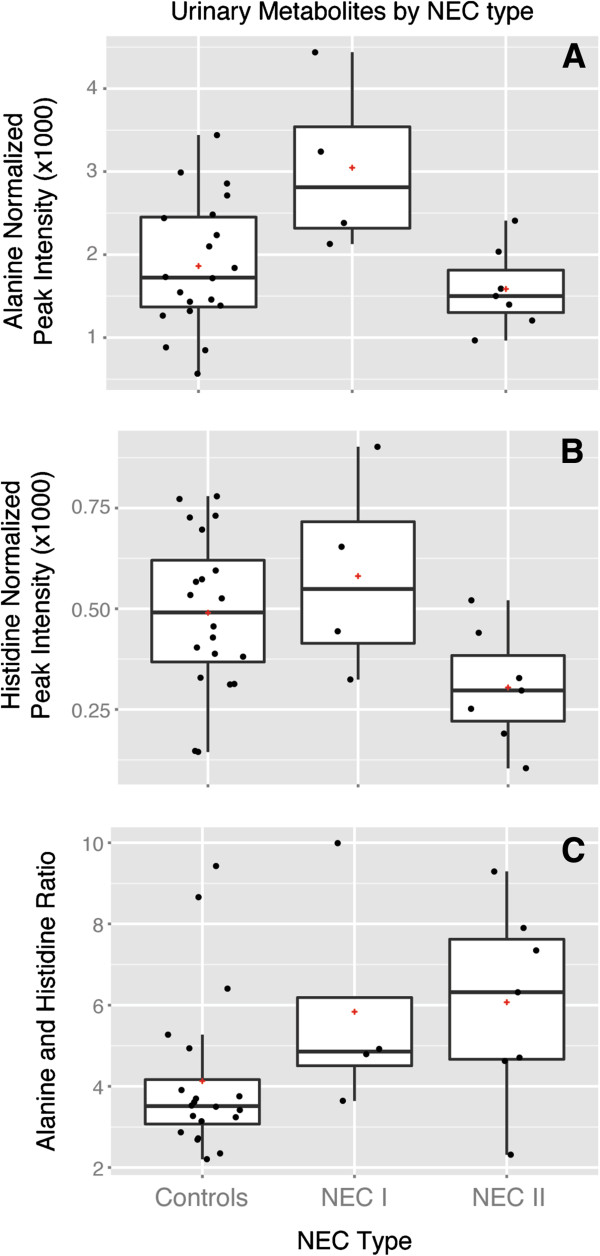
Results: During postnatal days 4 to 9, samples from infants who later developed NEC tended towards lower alpha diversity (Chao1 index, P = 0.086) and lacked Propionibacterium (P = 0.009) compared to controls. Furthermore, NEC was preceded by distinct forms of dysbiosis. During days 4 to 9, samples from four NEC cases were dominated by members of the Firmicutes (median relative abundance >99% versus <17% in the remaining NEC and controls, P < 0.001). During postnatal days 10 to 16, samples from the remaining NEC cases were dominated by Proteobacteria, specifically Enterobacteriaceae (median relative abundance >99% versus 38% in the other NEC cases and 84% in controls, P = 0.01). NEC preceded by Firmicutes dysbiosis occurred earlier (onset, days 7 to 21) than NEC preceded by Proteobacteria dysbiosis (onset, days 19 to 39). All NEC cases lacked Propionibacterium and were preceded by either Firmicutes (≥98% relative abundance, days 4 to 9) or Proteobacteria (≥90% relative abundance, days 10 to 16) dysbiosis, while only 25% of controls had this phenotype (predictive value 88%, P = 0.001). Analysis of days 4 to 9 urine samples found no metabolites associated with all NEC cases, but alanine was positively associated with NEC cases that were preceded by Firmicutes dysbiosis (P < 0.001) and histidine was inversely associated with NEC cases preceded by Proteobacteria dysbiosis (P = 0.013). A high urinary alanine:histidine ratio was associated with microbial characteristics (P < 0.001) and provided good prediction of overall NEC (predictive value 78%, P = 0.007).

Conclusions: Early dysbiosis is strongly involved in the pathobiology of NEC. These striking findings require validation in larger studies but indicate that early microbial and metabolomic signatures may provide highly predictive biomarkers of NEC.


Figures

Figure 1
Figure 1
The relative abundance of bacterial phyla in infants who developed NEC vs control infants. Columns represent samples from days of life for 4 to 9 and 10 to 16. Data are graphed as box plots. The middle bar represents the median, the outer horizontal lines of the box represent the 25th and 75th percentiles. Dots above or below each box indicate outliers. NEC: necrotizing enterocolitis.
Figure 2
Figure 2
Microbial community differences between NEC and control infants, days 4 to 9 samples. (A) This box plot indicates the relative abundance of the genus Propionibacterium in 18 control samples and 9 samples prior to NEC onset during days 4 to 9 of life. None of the infants who later developed NEC, but 10 (56%) of the control samples had detectable amounts of Propionibacterium (using Fisher’s exact test for the presence or absence in NEC vs control samples, P = 0.009). (B) This box plot indicates the Chao1 richness index in samples from days 4 to 9 of life. NEC cases tended towards lower diversity than controls, but the comparison was not significant (Kruskal–Wallis, P = 0.086). For each box plot, the middle bar represents the median, the outer horizontal lines of the box represent the 25th and 75th percentiles. The dots overlaying the plots indicate the values of individual samples. Dots are distributed horizontally in order to prevent overlapping. NEC: necrotizing enterocolitis.
Figure 3
Figure 3
NMDS ordination of microbial communities for days 4 to 9 of life. (A) This ordination was based on weighted UniFrac beta diversity and run with three dimensions in the vegan package of R, resulting in a stress of 4.06. Control samples are shown in black and NEC and non-NEC deaths are shown in red for those included in Cluster I or green for those samples included in Cluster II. Clusters of samples with similar microbial composition were systematically identified using the Ward minimum variance method. These clusters are labeled using roman numerals I through IV. All NEC cases were found in either Cluster I or Cluster II only. The samples from the two non-NEC deaths are also found in Cluster I. (B) Bars indicate the relative abundance of the ten most common genera in samples from individual infants, whose study numbers are noted on the horizontal axis. Samples are grouped according to case or control status and the cluster in which they were identified. NEC: necrotizing enterocolitis; NMDS: non-metric dimensional scaling.
Figure 4
Figure 4
NMDS ordination of microbial communities for days 10 to 16 of life. (A) This ordination was based on weighted UniFrac beta diversity and run with three dimensions in the vegan package of R, resulting in a stress of 2.43. Controls are shown in black and NEC and non-NEC deaths in either red (cases identified as NEC-I in the ordination for days 4 to 9) or green (cases identified as NEC-II in the ordination for days 4 to 9). Clusters identified using the Ward minimum variance method are indicated in this ordination as A, B and D; C is identified as an outlier value. (B) Bars indicate the relative abundance of the ten most common genera in samples from individual infants, whose study numbers are noted on the horizontal axis. NEC sub-types (NEC-I and NEC-II) correspond to the NEC cases included in Cluster I and Cluster II, respectively, in the ordination of samples for days 4 to 9 (Figure 3). The clusters identified in this ordination are indicated by column headers. Clusters indicate microbial community similarity. NEC: necrotizing enterocolitis; NMDS: non-metric dimensional scaling.
Figure 5
Figure 5
Box plots of urinary alanine and histidine in relation to NEC sub-types versus controls. Urine samples collected during days 4 to 9, restricted to one sample per infant (31 samples). Analysis of urinary alanine, pyridoxine and histidine among NEC-I, NEC-II, death and control subjects using multiple samples per individual (60 samples) is shown in Supplementary Information, Table S2 of Additional file 2. (A) Urinary alanine. Using the Kruskal–Wallis test, urinary alanine was significantly higher in NEC-I vs controls (P = 0.044) and NEC-I than NEC-II (P = 0.023), but did not differ between NEC-II vs controls or all NEC vs controls. (B) Urinary histidine. Using the Kruskal–Wallis test, urinary histidine was significantly lower in NEC-II vs controls (P = 0.023). Histidine also tended to be lower in NEC-II vs NEC-I (P = 0.059), but did not differ between NEC-I vs controls or all NEC vs controls. (C) Ratio of urinary alanine to histidine. Using the Kruskal–Wallis test, the ratio of urinary alanine to histidine was significantly higher in NEC cases overall vs controls (P = 0.023), but did not differ between the NEC sub-types. The optimal cut-point in the alanine:histidine ratio to differentiate NEC cases from controls was identified as a ratio greater than 4 (predictive value 78%, P = 0.007). NEC: necrotizing enterocolitis.

References

    1. Stoll BJ, Hansen NI, Bell EF, Shankaran S, Laptook AR. Neonatal outcomes of extremely preterm infants from the NICHD Neonatal Research Network. Pediatrics. 2010;1:443–456. doi: 10.1542/peds.2009-2959. - DOI - PMC - PubMed
    1. Smith PB, Ambalavanan N, Li L, Cotten CM, Laughon M. Approach to infants born at 22 to 24 weeks' gestation: relationship to outcomes of more-mature infants. Pediatrics. 2012;1:e1508–e1516. doi: 10.1542/peds.2011-2216. - DOI - PMC - PubMed
    1. Yee WH, Soraisham AS, Shah VS, Aziz K, Yoon W. Incidence and timing of presentation of necrotizing enterocolitis in preterm infants. Pediatrics. 2012;1:e298–e304. doi: 10.1542/peds.2011-2022. - DOI - PubMed
    1. Nanthakumar N, Meng D, Goldstein AM, Zhu W, Lu L. The mechanism of excessive intestinal inflammation in necrotizing enterocolitis: an immature innate immune response. PLoS One. 2011;1:e17776. doi: 10.1371/journal.pone.0017776. - DOI - PMC - PubMed
    1. Meinzen-Derr J, Poindexter B, Wrage L, Morrow AL, Stoll B. Role of human milk in extremely low birth weight infants' risk of necrotizing enterocolitis or death. J Perinatol. 2009;1:57–62. doi: 10.1038/jp.2008.117. - DOI - PMC - PubMed