

Colonization patterns of soil microbial communities in the Atacama Desert
- PMID: 24451153
- PMCID: PMC3971613
- DOI: 10.1186/2049-2618-1-28
Colonization patterns of soil microbial communities in the Atacama Desert
Abstract
Background: The Atacama Desert is one of the driest deserts in the world and its soil, with extremely low moisture, organic carbon content, and oxidizing conditions, is considered to be at the dry limit for life.
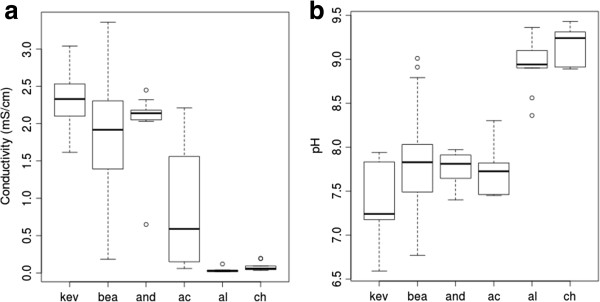
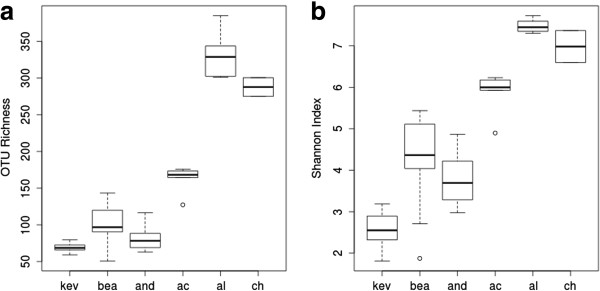
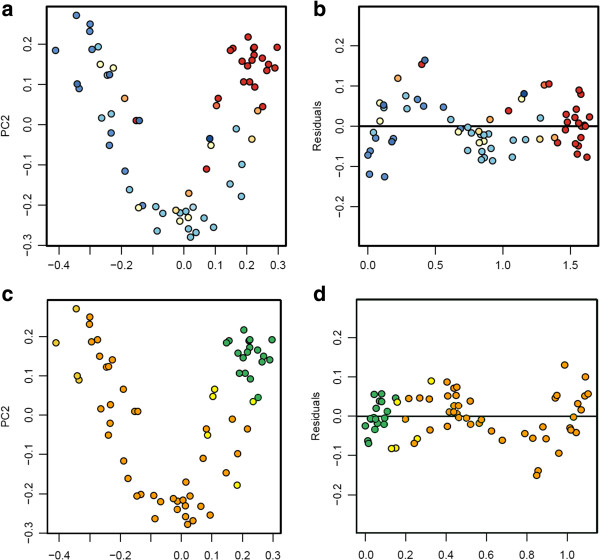
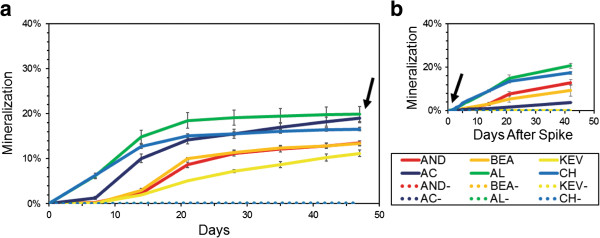
Results: Analyses of high throughput DNA sequence data revealed that bacterial communities from six geographic locations in the hyper-arid core and along a North-South moisture gradient were structurally and phylogenetically distinct (ANOVA test for observed operating taxonomic units at 97% similarity (OTU0.03), P <0.001) and that communities from locations in the hyper-arid zone displayed the lowest levels of diversity. We found bacterial taxa similar to those found in other arid soil communities with an abundance of Rubrobacterales, Actinomycetales, Acidimicrobiales, and a number of families from the Thermoleophilia. The extremely low abundance of Firmicutes indicated that most bacteria in the soil were in the form of vegetative cells. Integrating molecular data with climate and soil geochemistry, we found that air relative humidity (RH) and soil conductivity significantly correlated with microbial communities' diversity metrics (least squares linear regression for observed OTU0.03 and air RH and soil conductivity, P <0.001; UniFrac PCoA Spearman's correlation for air RH and soil conductivity, P <0.0001), indicating that water availability and salt content are key factors in shaping the Atacama soil microbiome. Mineralization studies showed communities actively metabolizing in all soil samples, with increased rates in soils from the southern locations.
Conclusions: Our results suggest that microorganisms in the driest soils of the Atacama Desert are in a state of stasis for most of the time, but can potentially metabolize if presented with liquid water for a sufficient duration. Over geological time, rare rain events and physicochemical factors potentially played a major role in selecting micro-organisms that are most adapted to extreme desiccating conditions.
Figures


References
-
- Rothschild LJ, Mancinelli RL. Life in extreme environments. Nature. 2001;1:1092–1101. - PubMed
-
- McKay CP, Friedmann EI, Gomez-Silva B, Caceres-Villanueva L, Andersen DT, Landheim R. Temperature and moisture conditions for life in the extreme arid region of the Atacama desert: four years of observations including the El Niño of 1997-1998. Astrobiology. 2003;1:393–406. - PubMed
-
- Hartley AJ, Chong G, Houston J, Mather AE. 150 million years of climatic stability: evidence from the Atacama Desert, northern Chile. J Geol Soc. 2005;1:421–424.
-
- Dunai TJ, Gonzalez Lopez GA, Juez-Larre J. Oligocene-Miocene age of aridity in the Atacama Desert revealed by exposure dating of erosion-sensitive landforms. Geology. 2005;1:321–324.
-
- Clarke JDA. Antiquity of aridity in the Chilean Atacama Desert. Geomorphology. 2006;1:101–114.
LinkOut - more resources
Full Text Sources
Other Literature Sources
