. 2014 Mar;25(6):948-64.
doi: 10.1091/mbc.E13-09-0523. Epub 2014 Jan 22.

NAADP and the two-pore channel protein 1 participate in the acrosome reaction in mammalian spermatozoa

Affiliations

NAADP and the two-pore channel protein 1 participate in the acrosome reaction in mammalian spermatozoa

Lilli Arndt et al. Mol Biol Cell. 2014 Mar.

Abstract

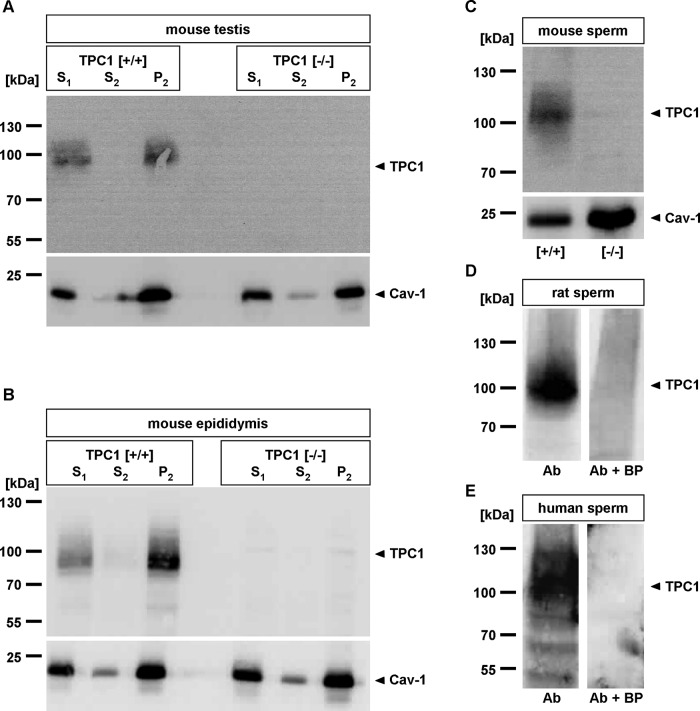
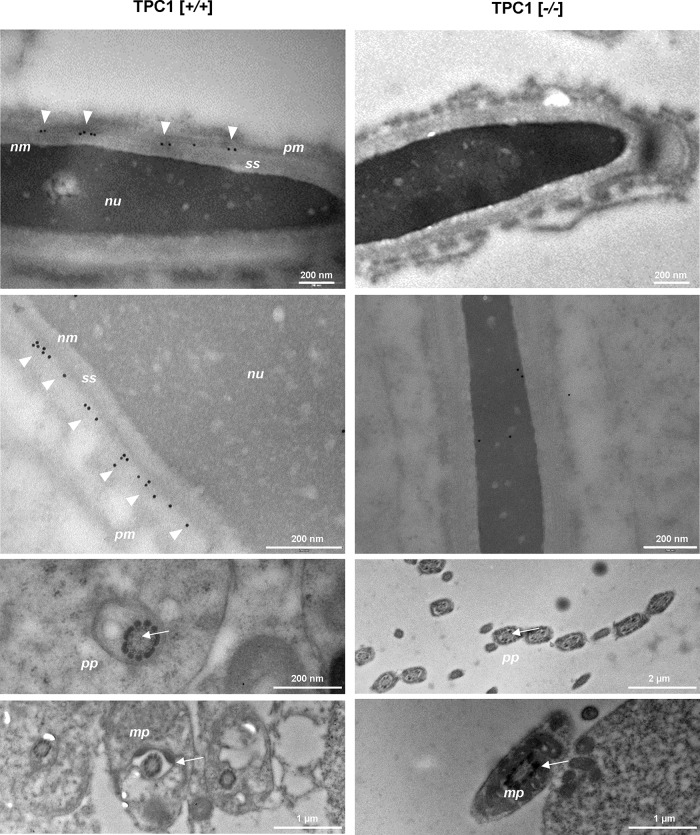
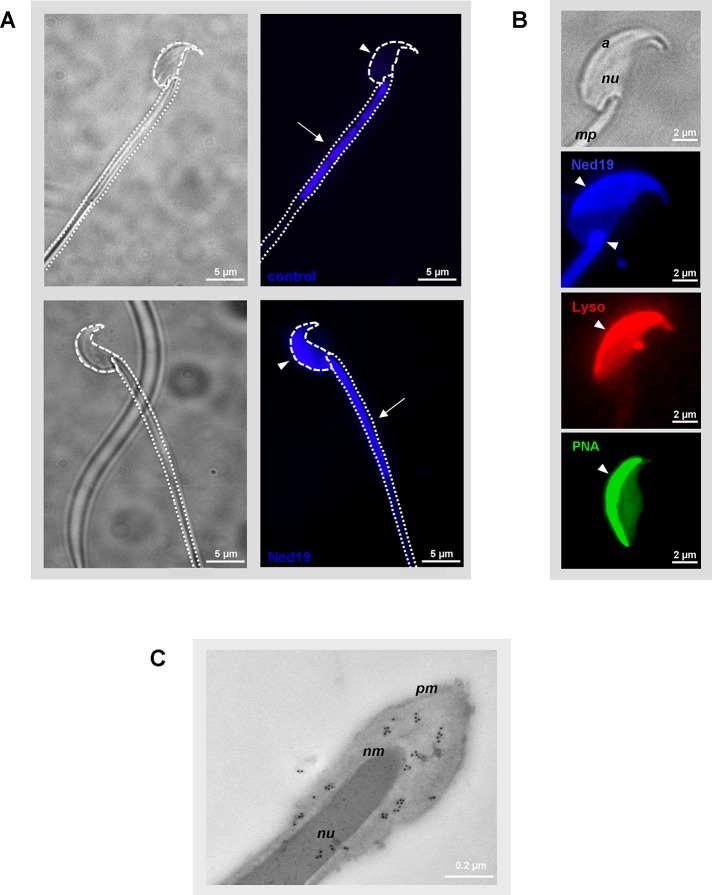
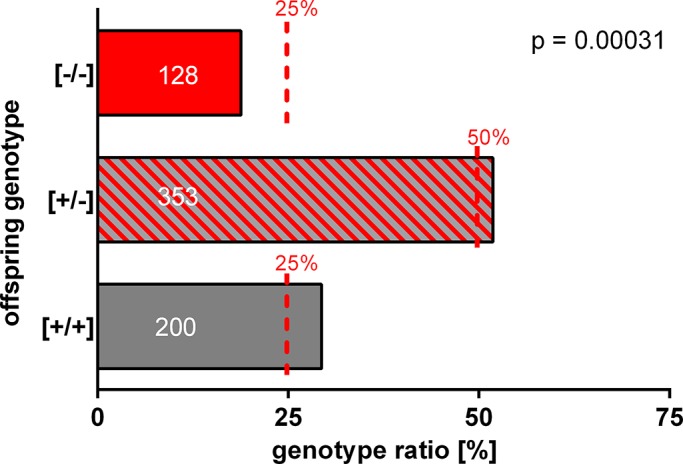
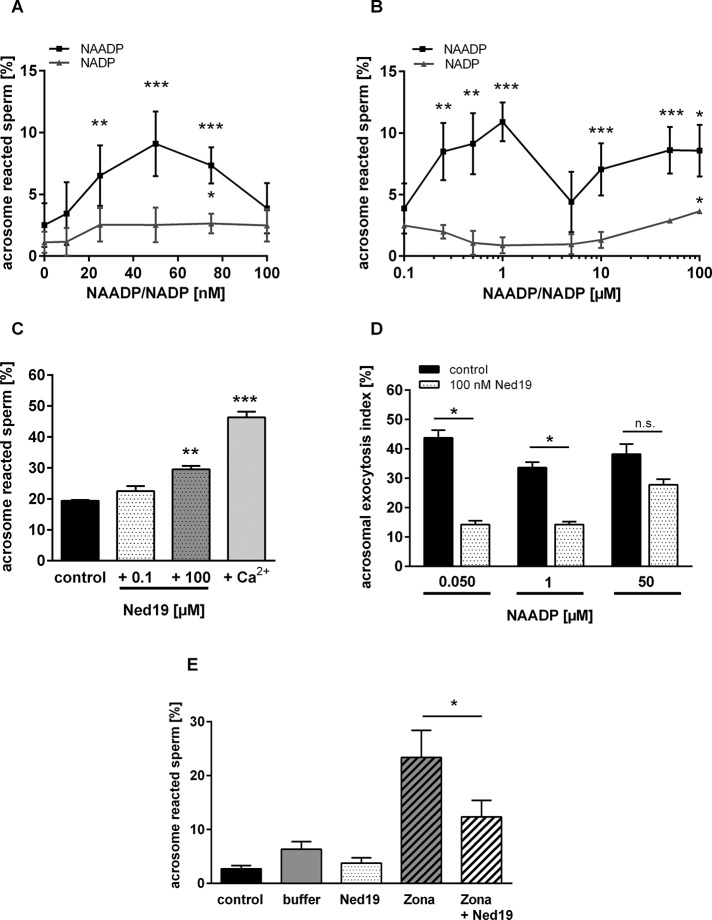
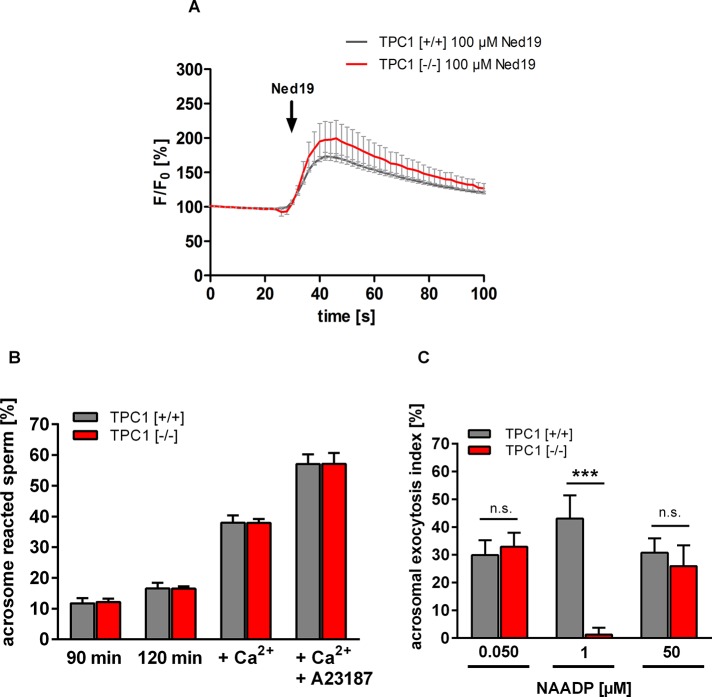
The functional relationship between the formation of hundreds of fusion pores during the acrosome reaction in spermatozoa and the mobilization of calcium from the acrosome has been determined only partially. Hence, the second messenger NAADP, promoting efflux of calcium from lysosome-like compartments and one of its potential molecular targets, the two-pore channel 1 (TPC1), were analyzed for its involvement in triggering the acrosome reaction using a TPCN1 gene-deficient mouse strain. The present study documents that TPC1 and NAADP-binding sites showed a colocalization at the acrosomal region and that treatment of spermatozoa with NAADP resulted in a loss of the acrosomal vesicle that showed typical properties described for TPCs: Registered responses were not detectable for its chemical analogue NADP and were blocked by the NAADP antagonist trans-Ned-19. In addition, two narrow bell-shaped dose-response curves were identified with maxima in either the nanomolar or low micromolar NAADP concentration range, where TPC1 was found to be responsible for activating the low affinity pathway. Our finding that two convergent NAADP-dependent pathways are operative in driving acrosomal exocytosis supports the concept that both NAADP-gated cascades match local NAADP concentrations with the efflux of acrosomal calcium, thereby ensuring complete fusion of the large acrosomal vesicle.


Figures

FIGURE 1:
FIGURE 1:
TPC1 expression in reproductive tissue and mammalian spermatozoa. (A, B) Expression and membrane localization of TPC1 in testicular and epididymal tissue. Equal amounts of crude tissue starting material (supernatant 1 [S1]), as well as cytoplasmic (supernatant 2 [S2]) and membrane extracts (P2) of mouse wild-type (TPC1 [+/+]) and TPC1-deficient (TPC1 [−/−]) testis (A) and epididymis (B), were subjected to SDS–PAGE and assayed for TPC1 immunoreactivity using the anti-TPC1NK antibody. Equal protein loading of tissue fractions derived from both genotypes was verified using an antibody recognizing the raft marker protein caveolin-1 (Cav-1). Note that in wild-type samples the anti-TPC1NK IgG-labeled immunoreactive bands were centered at a molecular mass of ∼94 kDa in testis (A) and epididymis (B), whereas in reproductive tissue of TPC1-null animals no immunostaining was detectable. Comparing the labeling in the cytosolic (S2) and membrane fractions (P2), it is evident that the immunoreactive bands were always enriched in the corresponding membrane protein fractions, whereas the cytosolic extracts showed no obvious immunoreactivity. (C–E) Identification of TPC1 in rodent and human spermatozoa by immunoblot analysis. Equal amounts of membrane fractions of mouse spermatozoa of TPC1 wild-type ([+/+]) and TPC1-knockout mice ([−/−]; C) and membrane fractions of rat spermatozoa (D), as well as human sperm membranes (E), were separated by SDS–PAGE and probed with the anti-TPC1NK IgG. On monitoring of sperm preparations of the three species for immunoreactivity, bands with the expected size for TPC1 of ∼94 kDa for rodents and ∼100 kDa for humans were visible. The immunoreactive bands with higher molecular masses indicate glycosylated forms of TPC1. Specificity of immunostaining in rat and human sperm was confirmed upon neutralization of the primary antibody with the immunogenic peptide (D and E, Ab + BP). For mouse sperm, germ cells of TPC1-knockout animals were examined as negative control (C, [−/−]). A, B, and D show representatives of at least three independent experiments with tissue preparations of different animals. For separated mouse (C, 19 animals) and human sperm (E, ejaculates of three healthy volunteers), germ cells were pooled and fractionated; membrane proteins were subjected at least three times to Western blot analyses. The caveolin-1 blot (Cav-1) served as loading control for epididymal mouse sperm. Left, positions of the molecular weight standards in kilodaltons for each Western blot.
FIGURE 2:
FIGURE 2:
Immunoelectron microscopic analysis of TPC1 in adult mouse testis. Ultrathin sections of adult mouse testis of wild-type (left, TPC1 [+/+]) and TPC1-knockout males (right, TPC1, [−/−]) were labeled with anti-TPC1NK antibody, followed by incubation with goat anti-rabbit IgG conjugated to colloidal gold particles. TPC1-null testis tissue and the midpiece (mp) and proximal part of the principal piece (pp) of sperm tails of wild-type males did not show any precipitated immunogold particles. However, in wild-type spermatides, immunogold particles were only detected at a narrow area between the plasma membrane (pm) and the subacrosomal space (ss). This area holds membranes lining the acrosome. Although these membranes were only poorly preserved due to the fixation and embedding procedure, gold particles were found to follow the contour of the outer acrosome membrane. Images in the second line show different tissue areas with similar gold particle distribution. nm, nuclear membrane; nu, nucleus.
FIGURE 3:
FIGURE 3:
Localization of NAADP-binding sites and TPC1 in mouse spermatozoa. (A) Subcellular localization of trans-Ned-19–binding sites in murine sperm. Epididymal mouse sperm were incubated with 100 μM fluorescent NAADP antagonist trans-Ned-19 (Ned19), and subsequently binding of trans-Ned-19 was examined microscopically. To visualize autofluorescence under the excitation/emission conditions of trans-Ned-19, control sperm were incubated in the corresponding buffer only. Note that trans-Ned-19–loaded sperm not only show autofluorescence-derived tail staining, as observed for untreated sperm (control, arrow), but in addition are characterized by an intense blue fluorescence signal located at the neck region (Ned19, arrowhead], as well as at the acrosomal cap (Ned19, arrowhead). The dotted lines in the phase-contrast picture (right, top micrograph) border the sperm's head and the flagellum. Micrographs show representative images of at least three different sperm preparations with comparable results. (B) Trans-Ned-19 binding is localized to the acrosomal region. Isolated epididymal mouse sperm were probed with trans-Ned-19 (Ned19, blue), the fluorescent acidotropic dye LysoTracker Red (Lyso, red), or the FITC-conjugated acrosomal marker PNA (green), illustrating the position of the hook-shaped acrosome. Note that staining with PNA as well as with LysoTracker Red shows the same subcellular distribution as labeling with trans-Ned-19. The light micrograph of the mouse sperm head (top) marks the sperm nucleus (nu), the apical acrosomal region (a), and part of the midpiece of the sperm tail (mp). Arrowheads mark positive sperm acrosomal labeling. (C) Distribution of TPC1 in epididymal mouse spermatozoa visualized via immunogold electron microscopy. Ultrathin sections of adult mouse epididymis were labeled sequentially with anti-TPC1NK antibody, followed by incubation with gold-conjugated anti-rabbit IgG. Note that immunogold particles are predominantly localized at the acrosomal region of the sperm head between residues of the plasma membrane (pm) and the nuclear membrane (nm). A few colloidal particles were also found associated with the condensed DNA in the nucleus (nu).
FIGURE 4:
FIGURE 4:
Genotype distribution of pups produced by heterozygous TPC1 breeding pairs. Frequency of genotypes of offspring from heterozygous TPC1 mating pairs was determined in a continuous breeding study. Columns represent the percentage of the registered genotype of offspring; dashed red lines indicate expected frequency based on Mendelian inheritance. Note that heterozygous intercrosses produced fewer TPC1-mutant mice ([−/−]) than predicted from the Mendelian distribution. Only 128 of 681 weaned pups from 105 litters were homozygous for TPC1, resulting in a significant deviation from Mendelian distribution of TPC1-null pups. Data present the ratio of offspring of 26 heterozygous TPC1 breeding pairs. Numbers in the columns represent numbers of pups for each genotype. The significance of deviation from expected Mendelian ratio was tested using chi-squared statistics.
FIGURE 5:
FIGURE 5:
Effects of NAADP and its antagonist trans-Ned-19 on acrosome reaction. (A) Concentration response curve of low doses of NAADP on acrosome reaction in spermatozoa isolated from BALB/c mice. To evaluate whether NAADP or its structurally related metabolic precursor NADP influences acrosome reaction, capacitated epididymal spermatozoa were permeabilized with the bacterial toxin SLO and treated for 30 min at 37°C with a narrow range of low doses of either NAADP or NADP (10–100 nM), respectively. Subsequently, acrosomal status was blindly quantified by counting a minimum of 200 sperm/slide. The percentage of induced acrosome reaction of NAADP-reacted sperm over the whole applied concentration spectrum was calculated. A significant elevation in acrosomal exocytosis was visible, following a bell shape with a maximal response at ∼50 nM NAADP. In contrast, NADP-treated sperm showed only weak increase in the percentage of acrosome-reacted sperm. (B) Elevation of acrosome reaction monitored over a high concentration range of NAADP and NADP. To assess the effect of high NAADP doses, a concentration range of 100 nM to 100 μM was applied. Note that the inactive analogue NADP only elicited significant acrosomal secretion at extremely high (100 μM) concentrations. However, NAADP induced significant acrosomal secretion with maxima at 1 and 50 μM NAADP, respectively. Data in A and B are mean values ± SEM and were normalized by subtracting the percentage of acrosome-reacted spermatozoa of each experiments after 90-min capacitation (NAADP: 14.6 ± 1.7%; NADP: 9.1 ± 1.3%). The data were collected from independent experiments (5 NADP; 14 NAADP) with different mouse sperm preparations. Statistical significance (*p < 0.05, **p < 0.01, ***p < 0.001) was considered if data were different from rates of spontaneous loss of the acrosomal vesicle (A, 0 nM NAADP/NADP). (C) Effect of the NAADP antagonist trans-Ned-19 on spontaneous acrosome reaction. Capacitated and permeabilized mouse spermatozoa were incubated for 30 min in KRB/SLO buffer or in permeabilization buffer supplemented with either low (100 nM) or high (100 μM) trans-Ned-19 doses. Efficiency of SLO permeabilization was verified by stimulating sperm with 10 mM CaCl2 (Ca2+). Note that in the presence of high trans-Ned-19 concentration, spontaneous loss of the acrosomal vesicle was significantly elevated compared with samples incubated in control buffer. Low trans-Ned-19 did not affect basal acrosomal status. Data represent the mean values of acrosome reacted sperm ± SEM of six independent experiments with different mouse sperm preparations (***p < 0.001) compared with samples incubated in KRB/SLO buffer only (control). (D) Effect of 100 nM trans-Ned-19 on NAADP-induced acrosome reaction. To assess whether low trans-Ned-19 concentrations antagonize NAADP-induced acrosome reaction, capacitated and permeabilized sperm were stimulated with either NAADP doses found to elicit maximal acrosomal secretion rates (50 nM, 1 μM, 50 μM) or one of the three NAADP doses together with trans-Ned-19. Note that 100 nM trans-Ned-19 significantly reduced responsiveness induced by 50 nM and 1 μM NAADP, whereas acrosomal secretion elicited by 50 μM NAADP was only slightly attenuated. Results presented are mean values ± SEM of acrosomal exocytosis index and are the average of six independent experiments. Statistical significance (paired Student's t test; p < 0.05; n.s., not significant) was calculated by comparing samples only stimulated with one of the three NAADP doses with corresponding probes incubated with NAADP together with trans-Ned-19. (E) Effect of trans-Ned-19 on Zona pellucida–induced acrosome reaction. To assess whether an NAADP-controlled signaling pathway is operative in driving acrosomal exocytosis under physiological conditions, capacitated but nonpermeabilized sperm were treated for 30 min at 37°C with solubilized Zona pellucida (10 zonae/μl cell suspension), or, alternatively, Zona pellucida stimulation was performed in the presence of the NAADP antagonist trans Ned-19 (100 nM). Note that Zona pellucida stimulation elevated exocytosis to a mean value of ∼23.35 ± 5.04% (Zona) compared with sperm incubated in the respective buffer used to solubilize and dilute isolated Zona pellucida (buffer: 6.31 ± 1.43%). However, simultaneous application of trans-Ned-19 resulted in a significant (p < 0.013) reduction in acrosomal exocytosis (Zona + Ned19: 12.33 ± 3.06%). Data, calculated as absolute percentages of acrosome-reacted sperm, represent mean values ± SEM of five independent experiments with different mouse sperm preparations. Statistical significance (*p < 0.05) was considered if data were different from secretion rates of germ cell samples stimulated with purified Zona pellucida.
FIGURE 6:
FIGURE 6:
Comparison of trans-Ned-19–induced Ca2+ increase and acrosome reaction rates in TPC1-deficient and wild-type sperm. (A) Time course of trans-Ned-19–induced increase in [Ca2+]i in TPC1 wild-type and TPC1-deficient sperm. To compare directly the effect of TPCN1 gene deletion on trans-Ned-19–induced increase in [Ca2+]i, capacitated wild-type [+/+] and TPC1-null sperm [−/−] were loaded with the Ca2+ fluorescent dye Fluo8-AM (10 μM). Fluorescence intensity was determined at the excitation wavelength of Fluo8-AM (485 nm) using a yellow fluorescent protein filter and a microscope-based imaging system. After a 30-s baseline interval to determine the Fluo8 fluorescence intensity in the head region of adhered sperm, 100 μM trans-Ned-19 was added. Note that sperm of both genotypes responded with a comparable transient increase in [Ca2+]i to stimulation with trans-Ned-19. Fluorescence intensity, recorded in 2-s intervals, was normalized to the initial values of each single cell and is presented as percentage of basal Fluo8 emission (F/F0). Data show mean values ± SEM of sperm preparations of three TPC1 wild-type and knockout animals (total number of measured sperm, 14–35 cells/animal). (B) Comparison of spontaneous acrosome reaction rates of TPC1-deficient and wild-type spermatozoa. Spontaneous loss of the acrosomal vesicle was quantified via incubation of spermatozoa of wild-type and TPC1-deficient animals for either 90 min in capacitation buffer or KRB buffer supplemented with SLO (120 min). In addition, permeabilized sperm were treated with 10 mM CaCl2 (Ca2+) or 10 mM CaCl2 together with 10 μM of the Ca2+ ionophore A23187 (Ca2+ + A23187). CaCl2, as well as CaCl2 plus A23187, markedly increased acrosomal secretion rates in sperm of both genotypes when compared with the basic level of spontaneously acrosome-reacted spermatozoa ([+/+], 16.58 ± 1.81%; [−/−], 16.58 ± 0.68%). However, in calculating statistical differences between acrosome reaction rates between sperm of both genotypes, no significant differences (p ≤ 0.05) were detected. (C) NAADP-induced acrosome reaction in sperm of TPC1-null mice compared with wild-type spermatozoa. Capacitated and permeabilized epididymal sperm of TPC1-knockout and wild-type animals were stimulated with NAADP, and acrosome reaction rates were determined. Because dose-dependent relationship analyses show three response peaks for NAADP, NAADP doses inducing maximal acrosomal secretion rates were applied (50 nM, 1 μM, 50 μM). Quantification of the acrosomal status of treated sperm revealed that very low (50 nM) and high NAADP doses (50 μM) elicited strong increase in acrosome reaction rates in TPC1-null sperm, which was not significantly different from the percentage of acrosome reaction in wild-type sperm. However, comparing the elevation in the percentage of acrosome reaction induced upon application of 1 μM NAADP wild-type sperm shows the expected increase in acrosome reaction rate. In contrast, TPC1-deficient spermatozoa did not show responsiveness to this NAADP concentration. Data presented as acrosomal exocytosis index are mean values ± SEM of independent experiments with different mouse sperm preparations ([+/+], n = 10; [−/−], n = 9). Statistical analysis was done using an unpaired Student's t test comparing the acrosomal exocytosis index of sperm of both genotypes. ***p < 0.001; n.s., not significant.

Similar articles

Cited by

References

    1. Aarhus R, Dickey DM, Graeff RM, Gee KR, Walseth TF, Lee HC. Activation and inactivation of Ca2+ release by NAADP+ J Biol Chem. 1996;271:8513–8516. - PubMed
    1. Abou-Haila A, Tulsiani DR. Signal transduction pathways that regulate sperm capacitation and the acrosome reaction. Arch Biochem Biophys. 2009;485:72–81. - PubMed
    1. Ackermann F, Zitranski N, Borth H, Buech T, Gudermann T, Boekhoff I. CaMKIIalpha interacts with multi-PDZ domain protein MUPP1 in spermatozoa and prevents spontaneous acrosomal exocytosis. J Cell Sci. 2009;122:4547–4557. - PubMed
    1. Ackermann F, Zitranski N, Heydecke D, Wilhelm B, Gudermann T, Boekhoff I. The multi-PDZ domain protein MUPP1 as a lipid raft-associated scaffolding protein controlling the acrosome reaction in mammalian spermatozoa. J Cell Physiol. 2008;214:757–768. - PubMed
    1. Aley PK, Singh N, Brailoiu GC, Brailoiu E, Churchill GC. Nicotinic acid adenine dinucleotide phosphate (NAADP) is a second messenger in muscarinic receptor-induced contraction of guinea pig trachea. J Biol Chem. 2013;288:10986–10993. - PMC - PubMed

Publication types

MeSH terms