

The contribution of SERF1 to root-to-shoot signaling during salinity stress in rice
- PMID: 24451326
- PMCID: PMC4091250
- DOI: 10.4161/psb.27540
The contribution of SERF1 to root-to-shoot signaling during salinity stress in rice
Abstract
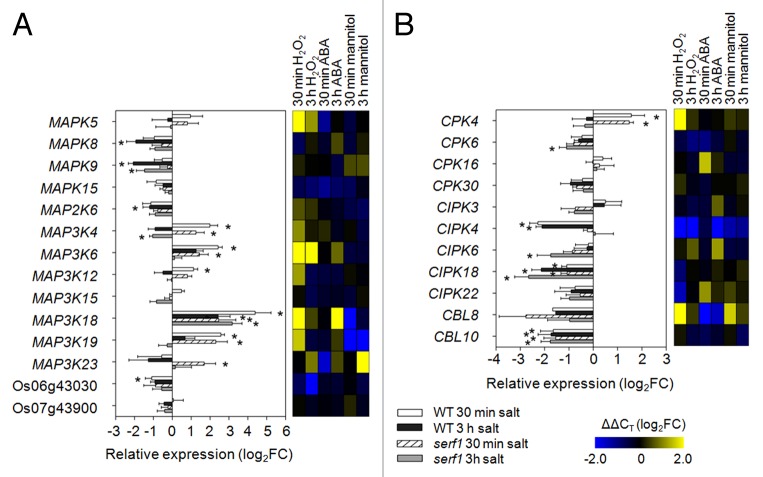
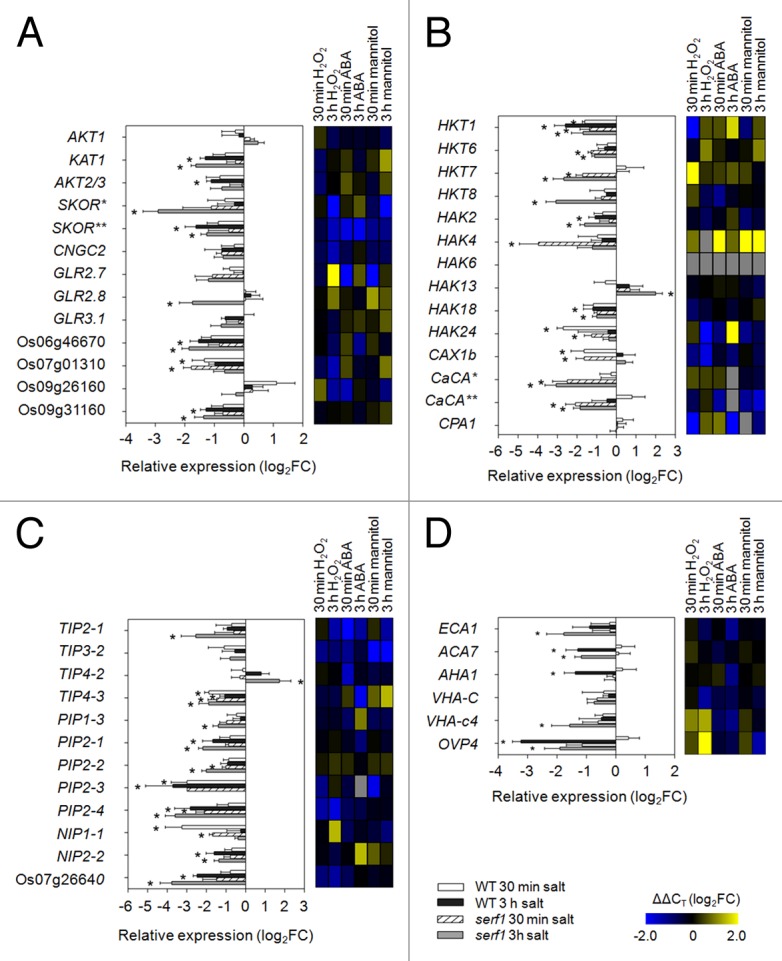
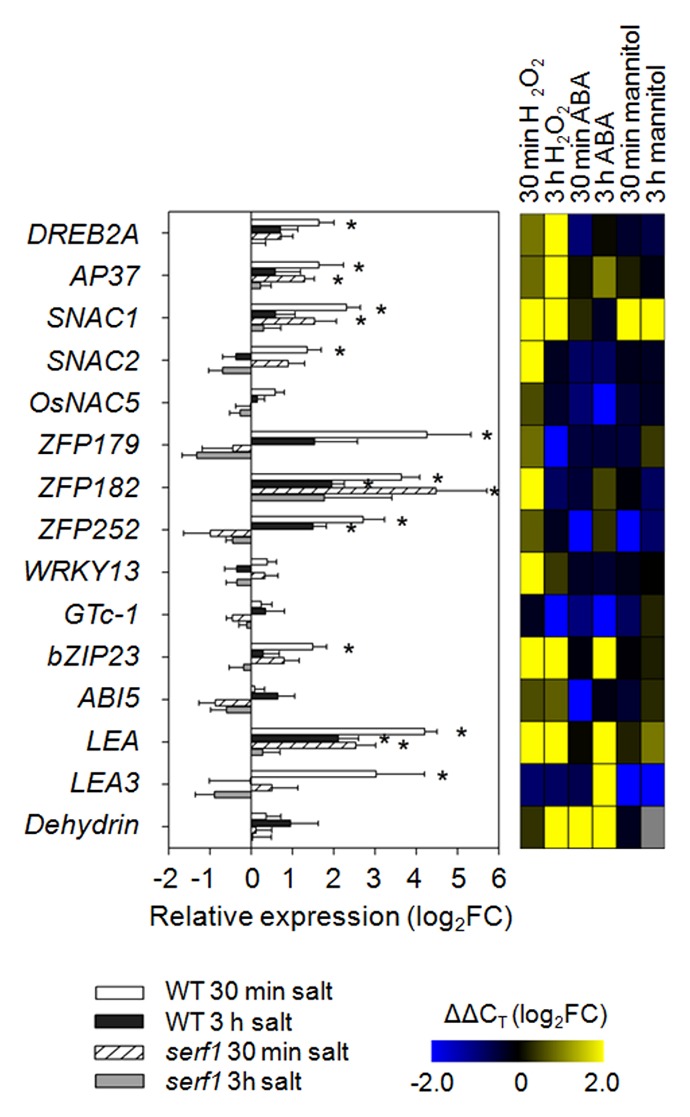
Stress perception and communication play important roles in the adaptation of plants to changing environmental conditions. Plant roots are the first organs to detect changes in the soil water potential induced by salt stress. In the presence of salinity stress, root-to-shoot communication occurs to adjust the growth of the whole plant. So far, the phytohormone abscisic acid (ABA), hydraulic signals and reactive oxygen species (ROS) have been proposed to mediate this communication under salt stress. Recently, we identified the rice transcription factor SALT-RESPONSIVE ERF1 (SERF1), which regulates a ROS-dependent transcriptional cascade in roots required for salinity tolerance. Upon salt stress, SERF1 knockout mutant plants show an increased leaf temperature as compared with wild type. As this occurs within the first 20 min of salt stress, we here evaluated the involvement of SERF1 in the perception of salt stress in the shoot. By metabolic profiling and expression analysis we show that the action of SERF1 in signal communication to the shoot is independent from ABA, but does affect the accumulation of ROS-related metabolites and transcripts under short-term salt stress.
Keywords: Oryza sativa; metabolism; reactive oxygen species; root-to-shoot; salt stress; transcription factor.
Figures
Similar articles
-
Salt-responsive ERF1 regulates reactive oxygen species-dependent signaling during the initial response to salt stress in rice.Plant Cell. 2013 Jun;25(6):2115-31. doi: 10.1105/tpc.113.113068. Epub 2013 Jun 25. Plant Cell. 2013. PMID: 23800963 Free PMC article.
-
The abiotic stress-responsive NAC-type transcription factor SlNAC4 regulates salt and drought tolerance and stress-related genes in tomato (Solanum lycopersicum).Plant Cell Rep. 2014 Nov;33(11):1851-63. doi: 10.1007/s00299-014-1662-z. Epub 2014 Jul 26. Plant Cell Rep. 2014. PMID: 25063324
-
The trihelix transcription factor OsGTγ-2 is involved adaption to salt stress in rice.Plant Mol Biol. 2020 Jul;103(4-5):545-560. doi: 10.1007/s11103-020-01010-1. Epub 2020 Jun 5. Plant Mol Biol. 2020. PMID: 32504260
-
Transcription Factors Interact with ABA through Gene Expression and Signaling Pathways to Mitigate Drought and Salinity Stress.Biomolecules. 2021 Aug 5;11(8):1159. doi: 10.3390/biom11081159. Biomolecules. 2021. PMID: 34439825 Free PMC article. Review.
-
Root Development and Stress Tolerance in rice: The Key to Improving Stress Tolerance without Yield Penalties.Int J Mol Sci. 2020 Mar 6;21(5):1807. doi: 10.3390/ijms21051807. Int J Mol Sci. 2020. PMID: 32155710 Free PMC article. Review.
Cited by
-
Transcriptome and Cell Physiological Analyses in Different Rice Cultivars Provide New Insights Into Adaptive and Salinity Stress Responses.Front Plant Sci. 2018 Mar 5;9:204. doi: 10.3389/fpls.2018.00204. eCollection 2018. Front Plant Sci. 2018. PMID: 29556243 Free PMC article.
-
Physiological and Proteomic Responses of Mulberry Trees (Morus alba. L.) to Combined Salt and Drought Stress.Int J Mol Sci. 2019 May 20;20(10):2486. doi: 10.3390/ijms20102486. Int J Mol Sci. 2019. PMID: 31137512 Free PMC article.
-
Transcriptome Analysis of Storage Roots and Fibrous Roots of the Traditional Medicinal Herb Callerya speciosa (Champ.) ScHot.PLoS One. 2016 Aug 3;11(8):e0160338. doi: 10.1371/journal.pone.0160338. eCollection 2016. PLoS One. 2016. PMID: 27486800 Free PMC article.
-
Involvement of Hormone- and ROS-Signaling Pathways in the Beneficial Action of Humic Substances on Plants Growing under Normal and Stressing Conditions.Biomed Res Int. 2016;2016:3747501. doi: 10.1155/2016/3747501. Epub 2016 Jun 5. Biomed Res Int. 2016. PMID: 27366744 Free PMC article. Review.
-
Haplotype and diversity analysis of indigenous rice for salinity tolerance in early-stage seedling using simple sequence repeat markers.Biotechnol Rep (Amst). 2021 Aug 9;31:e00666. doi: 10.1016/j.btre.2021.e00666. eCollection 2021 Sep. Biotechnol Rep (Amst). 2021. PMID: 34557392 Free PMC article.
References
-
- Negrão S, Courtois B, Ahmadi N, Abreu I, Saibo N, Oliveira MM. Recent updates on salinity stress in rice: from physiological to molecular responses. Crit Rev Plant Sci. 2011;30:329–77. doi: 10.1080/07352689.2011.587725. - DOI
-
- Dionisio-Sese ML, Tobita S. Antioxidant responses of rice seedlings to salinity stress. Plant Sci. 1998;135:1–9. doi: 10.1016/S0168-9452(98)00025-9. - DOI
Publication types
MeSH terms
Substances
LinkOut - more resources
Full Text Sources
Other Literature Sources
Research Materials