. 2013;4(6):155.
doi: 10.1186/scrt385.

Apoptotic adipose-derived mesenchymal stem cell therapy protects against lung and kidney injury in sepsis syndrome caused by cecal ligation puncture in rats

Apoptotic adipose-derived mesenchymal stem cell therapy protects against lung and kidney injury in sepsis syndrome caused by cecal ligation puncture in rats

Pei-Hsun Sung et al. Stem Cell Res Ther. 2013.

Abstract

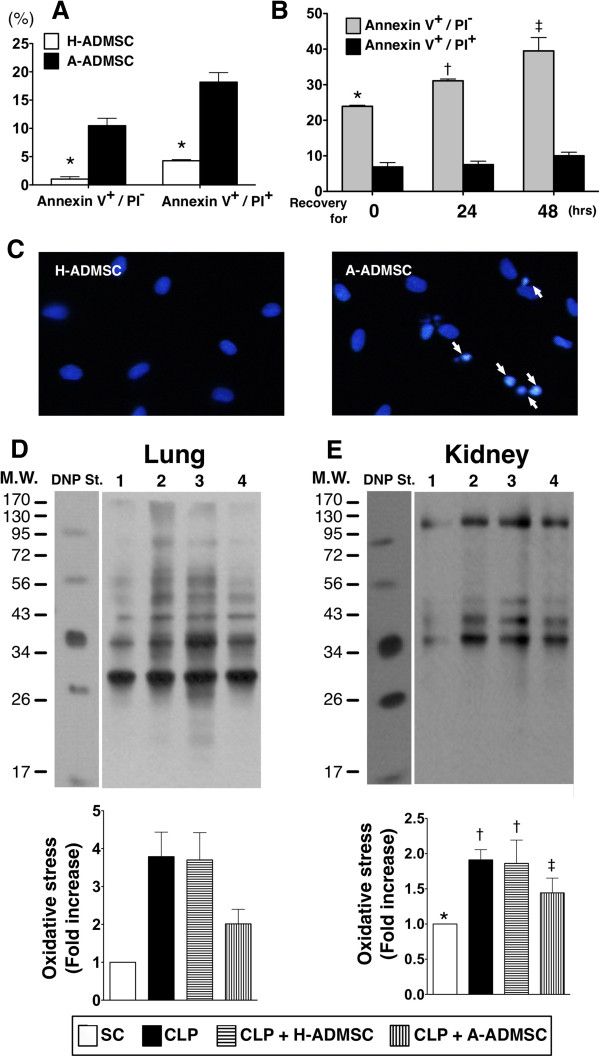
Introduction: We tested the hypothesis that apoptotic adipose-derived mesenchymal stem cells (A-ADMSC) are superior to healthy (H)-ADMSC in attenuating cecal ligation puncture (CLP)-induced sepsis-mediated lung and kidney injuries.

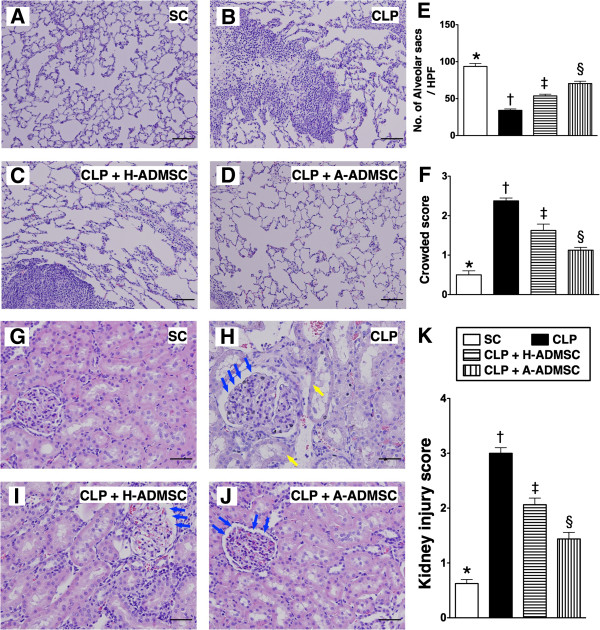
Methods: Adult male rats divided into group 1 (sham controls), group 2 (CLP), group 3 [CLP + H-ADMSC administered at 0.5, 6, and 18 hours after CLP], and group 4 [CLP + A-ADMSC administered as in group 3] were sacrificed 72 hours after CLP with blood, lung, and kidney collected for studies.

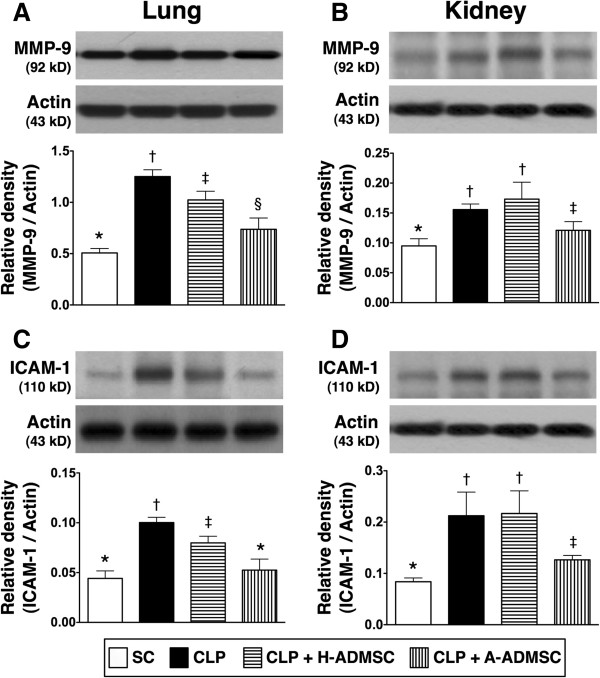
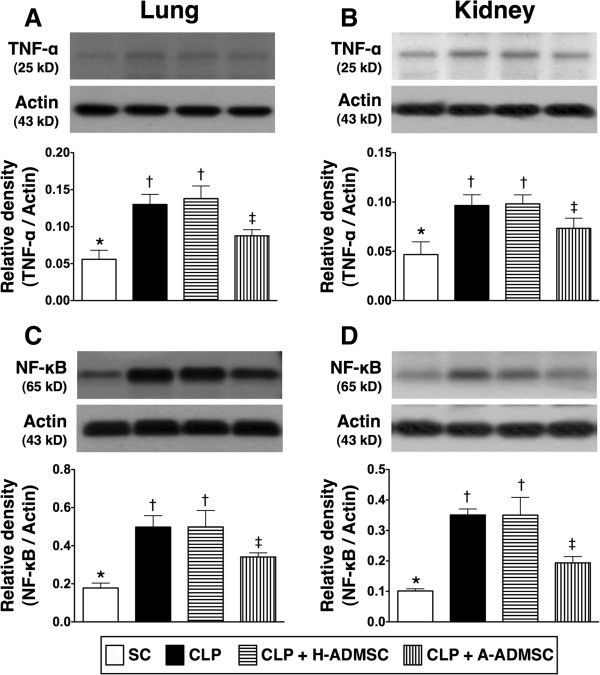
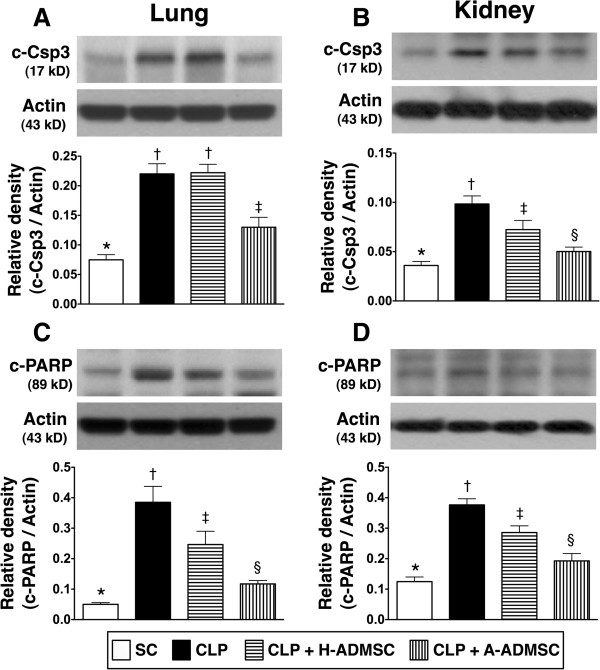
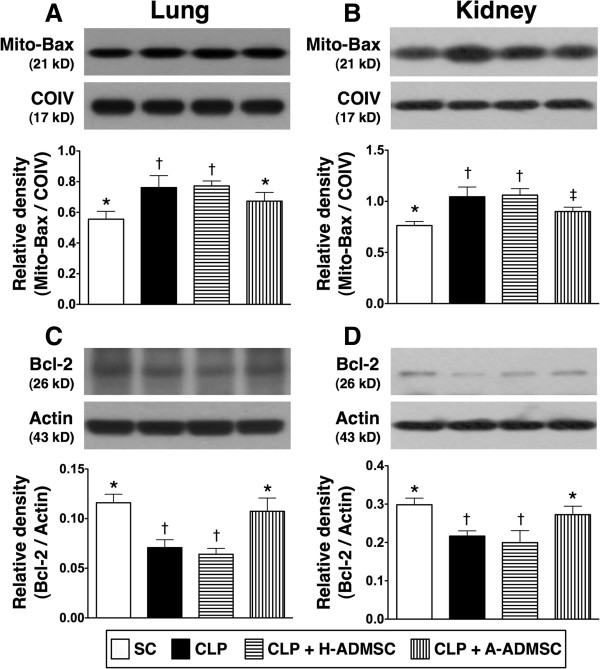
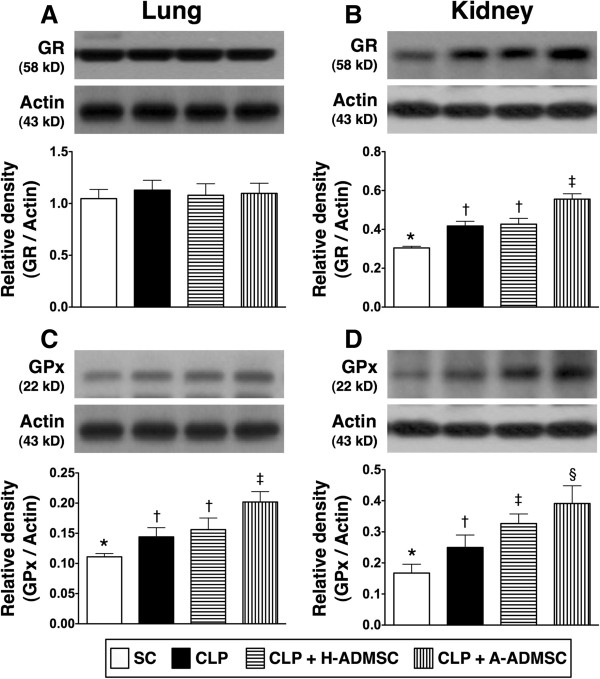
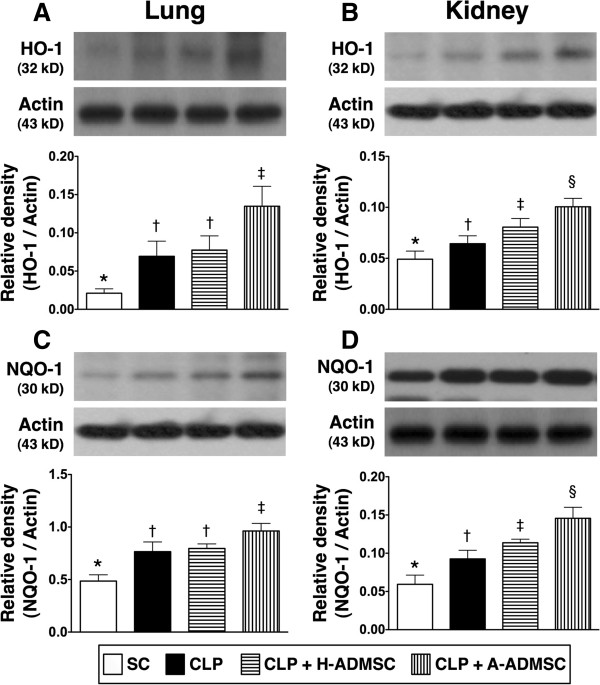
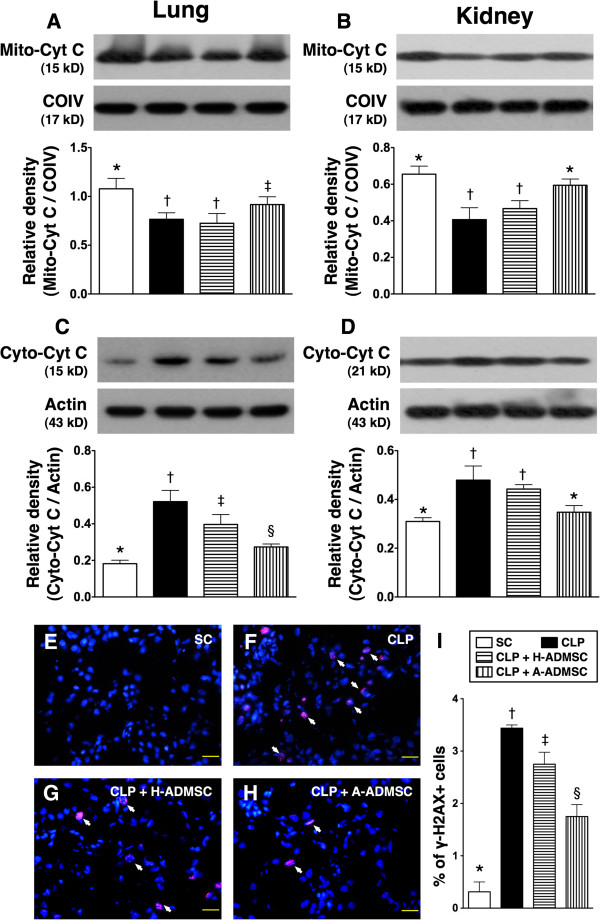
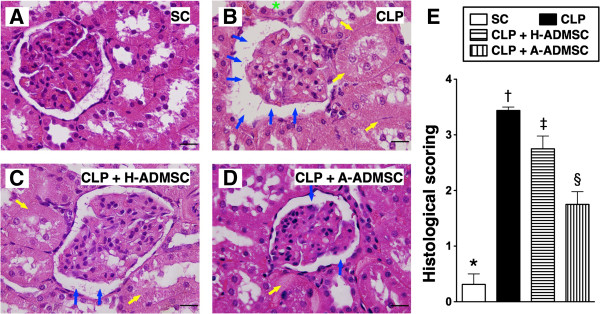
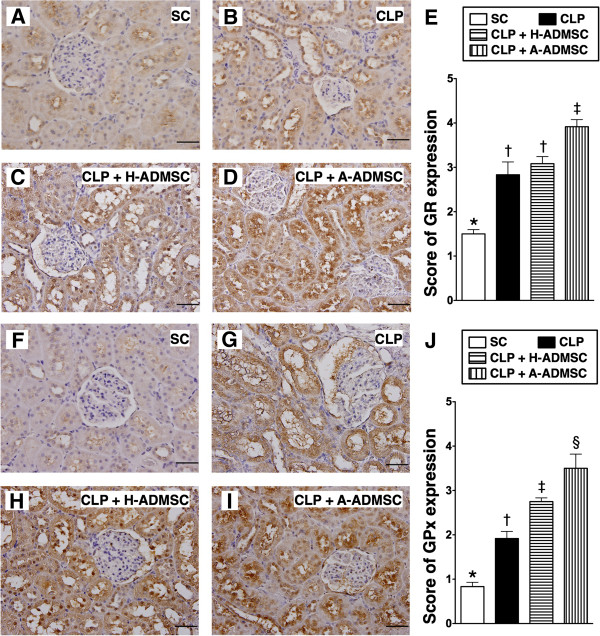
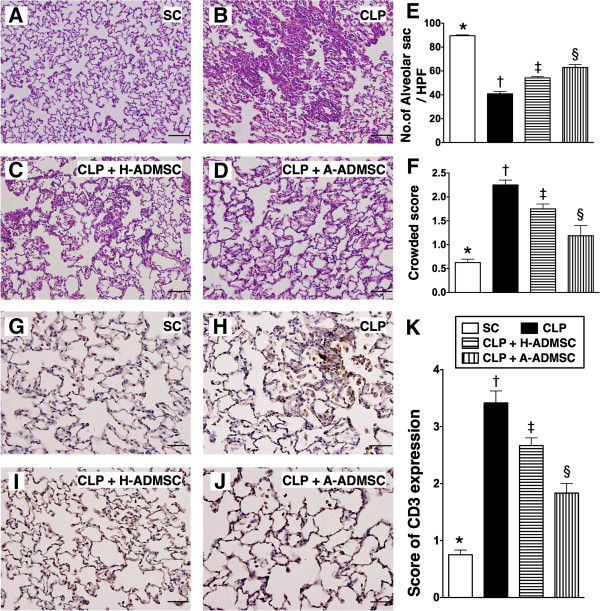
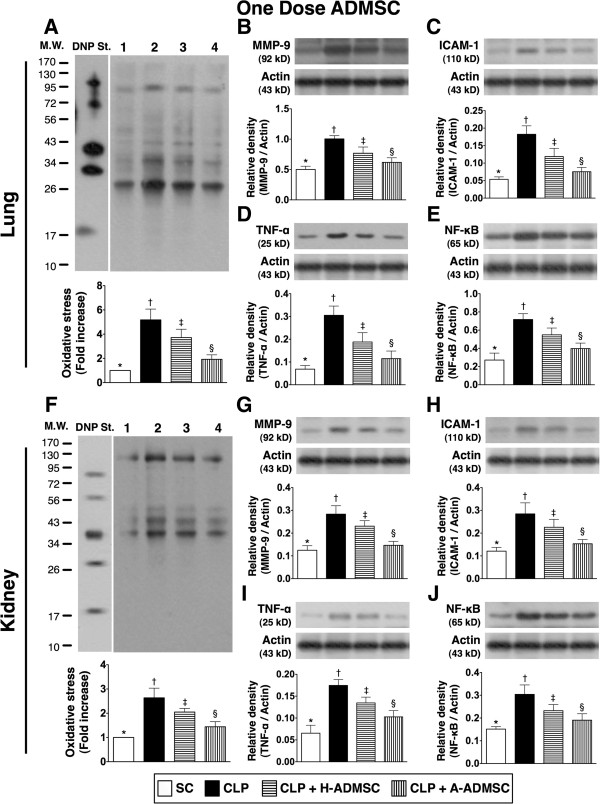
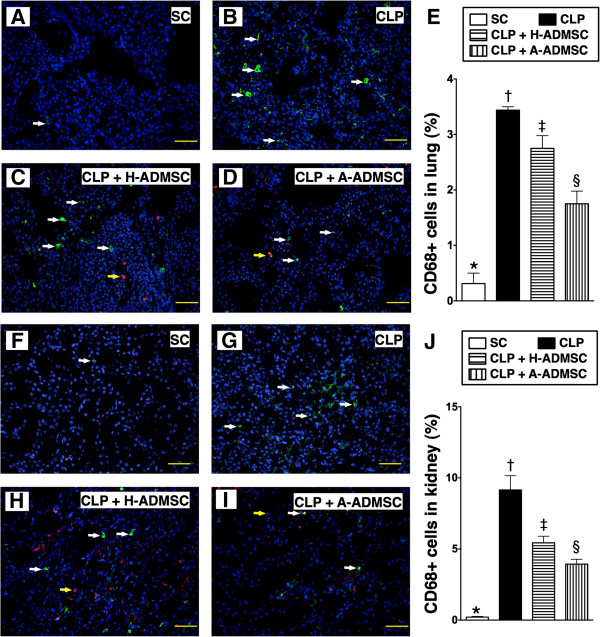
Results: White blood cell (WBC) count, circulating TNF-α and creatinine levels were higher in groups 2 and 3 than in groups 1 and 4 (all P < 0.001). Kidney and lung damage scores were highest in group 2, lowest in group 1, significantly higher in group 3 than in group 4 (all P < 0.0001). Protein expressions of inflammatory (ICAM-1, MMP-9, TNF-α, NF-κB), oxidative, and apoptotic (Bax, caspase-3, PARP) biomarkers were higher in groups 2 and 3 than groups 1 and 4, whereas anti-apoptotic (Bcl-2) and mitochondrial integrity (cytochrome-C) biomarkers were lower in groups 2 and 3 than in groups 1 and 4 (all P < 0.001). Expressions of anti-oxidant biomarkers at protein (GR, GPx, NQO-1, HO-1) and cellular (GR, GPx) levels were highest in group 4 (all P < 0.001). The number of inflammatory cells (CD3+) in lungs and levels of DNA damage marker (γ-H2AX) in kidneys were higher in groups 2 and 3 than in groups 1 and 4 (all P < 0.001).

Conclusions: A-ADMSC therapy was superior to H-ADMSC therapy in protecting major organs from damage in rats with CLP-induced sepsis syndrome.


Figures

Figure 1
Figure 1
Flow cytometric results of cellular apoptosis and Western blot results of oxidative stress. A) Compares the incidence of early (annexin V+/PI-) and late (annexin V+/PI+) phases of apoptosis between healthy adipose-derived mesenchymal stem cells (H-ADMSC) and apoptotic (A) (that is, 96 hours of serum-free cell culture) ADMSC (A-ADMSC). B) For A-ADMSCs, early apoptosis and late apoptosis increased at 24 hours and further increased by 48 hours after re-culture (after 96 hours of serum-free cell culture) in normal culture medium with adequate nutrition. * versus H-ADMSC in early or late phase of cellular apoptosis, P <0.0001. C) DAPI stain (nuclei were stained in blue color) indicated the cell apoptosis (white arrows). Apoptosis (white arrows) in A-ADMSC was markedly increased at 48 hours after being re-cultured in normal culture medium with adequate nutrition. D and E) Oxidized protein in lung (D) and kidney (E) at 72 hours after cecal ligation and puncture (CLP) procedure. DNP, 1–3 dinitrophenylhydrazone; M.W., molecular weight (Note: The right lane and left lane shown on the upper panel represent control oxidized molecular protein standard and protein molecular weight marker, respectively). 1, sham control (SC); 2, cecal ligation and puncture (CLP); 3, CLP + H-ADMSC; 4, CLP + A-DMSC. * versus other groups with different symbols, P <0.001. Statistical analysis using one-way ANOVA, followed by the Bonferroni multiple comparison post hoc test (n = 8). Symbols (*, †, ‡) indicate significant difference (<0.05). ANOVA, analysis of variance; DAPI, 4',6-diamidino-2-phenylindole.
Figure 2
Figure 2
Protein expressions of MMP-9 and ICAM-1 in lung and kidney at 72 hours after the CLP procedure. A and B) The protein expression of matrix metalloproteinase (MMP)-9 in lung (A) and kidney (B). For lung: * versus other groups with different symbols, P <0.001. For kidney: * versus other groups with different symbols, P <0.001. C and D) The protein expressions of intercellular adhesion molecule (ICAM)-1 in lung (C) and kidney (D). For lung: * versus other groups with different symbols, P <0.001. For kidney: * versus other groups with different symbols, P <0.001. Statistical analysis using one-way ANOVA, followed by the Bonferroni multiple comparison post hoc test (n = 8). Symbols (*, †, ‡, §) indicate significant difference (<0.05). SC, sham control; CLP, cecal ligation and puncture; H-ADMSC, healthy adipose-derived mesenchymal stem cell; A-ADMSC, apoptotic adipose-derived mesenchymal stem cell. ANOVA, analysis of variance.
Figure 3
Figure 3
Protein expression of TNF-α and NF-κB in lung and kidney at 72 hours after the CLP procedure. A and B) The protein expression of tumor necrosis factor alpha (TNF-α) in lung (A) and kidney (B). For lung: * versus other groups with different symbols, P <0.001. For kidney: * versus other groups with different symbols, P <0.001. C and D) The protein expression of nuclear factor (NF)- κB in lung (C) and kidney (D). For lung: * versus other groups with different symbols, P <0.001. For kidney: * versus other groups with different symbols, P <0.0001. Statistical analysis using one-way ANOVA, followed by the Bonferroni multiple comparison post hoc test (n = 8). Symbols (*, †, ‡, §) indicate significant difference (<0.05). SC, sham control; CLP, cecal ligation and puncture; H-ADMSC, healthy adipose-derived mesenchymal stem cell; A-ADMSC, apoptotic adipose-derived mesenchymal stem cell. ANOVA, analysis of variance.
Figure 4
Figure 4
The protein expressions of apoptotic biomarkers in lung and kidney at 72 hours after the CLP procedure. A and B) The protein expression of cleaved caspase 3 (C-Csp3) in lung (A) and kidney (B). For lung: * versus other groups with different symbols, P <0.001. For kidney: * versus other groups with different symbols, P <0.001. C and D) The protein expression of cleaved poly (ADP-ribose) polymerase (C-PARP) in lung (C) and kidney (D). For lung: * versus other groups with different symbols, P <0.0001. For kidney: * versus other groups with different symbols, P <0.001. Statistical analysis using one-way ANOVA, followed by the Bonferroni multiple comparison post hoc test (n = 8). Symbols (*, †, ‡, §) indicate significant difference (<0.05). SC, sham control; CLP, cecal ligation and puncture; H-ADMSC, healthy adipose-derived mesenchymal stem cell; A-ADMSC, apoptotic adipose-derived mesenchymal stem cell. ANOVA, analysis of variance.
Figure 5
Figure 5
The protein expressions of apoptotic and anti-apoptotic biomarkers in lung and kidney at 72 hours after the CLP procedure. A and B) The protein expression of mitochondrial (Mito) Bax in lung (A) and kidney (B). For lung: * versus other groups with different symbols, P <0.01. For kidney: * versus other groups with different symbols, P <0.01. C and D) The protein expression of Bcl-2 in lung (C) and kidney (D). For lung: * versus other groups with different symbols, P <0.001. For kidney: * versus other groups with different symbols, P <0.01. Statistical analysis using one-way ANOVA, followed by the Bonferroni multiple comparison post hoc test (n = 8). Symbols (*, †, ‡) indicate significant difference (<0.05). SC, sham control; CLP, cecal ligation and puncture; H-ADMSC, healthy adipose-derived mesenchymal stem cell; A-ADMSC, apoptotic adipose-derived mesenchymal stem cell. ANOVA, analysis of variance.
Figure 6
Figure 6
The protein expression of GR and GPx in lung and kidney at 72 hours after the CLP procedure. A and B) The protein expression of glutathione reductase (GR) in lung (A) and kidney (B). For lung: * versus other groups with different symbols, P >0.1. For kidney: * versus other groups with different symbols, P <0.001. C and D) The protein expression of glutathione peroxidase (GPx) in lung (C) and kidney (D). For lung: * versus other groups with different symbols, P <0.008. For kidney: * versus other groups with different symbols, P <0.0001. Statistical analysis using one-way ANOVA, followed by the Bonferroni multiple comparison post hoc test (n = 8). Symbols (*, †, ‡, §) indicate significant difference (<0.05). SC, sham control; CLP, cecal ligation and puncture; H-ADMSC, healthy adipose-derived mesenchymal stem cell; A-ADMSC, apoptotic adipose-derived mesenchymal stem cell. ANOVA, analysis of variance.
Figure 7
Figure 7
The protein expression of HO-1 and NQO 1 in lung and kidney at 72 hours after the CLP procedure. A and B) The protein expression of heme oxygense (HO)-1 in lung (A) and kidney (B). For lung: * versus other groups with different symbols, P <0.0001. For kidney: * versus other groups with different symbols, P <0.001. C and D) The protein expression of NAD(P)H quinone oxidoreductase (NQO) 1 in lung (C) and kidney (D). For lung: * versus other groups with different symbols, P <0.001. For kidney: * versus other groups with different symbols, P <0.001. Statistical analysis using one-way ANOVA, followed by the Bonferroni multiple comparison post hoc test (n = 8). Symbols (*, †, ‡, §) indicate significant difference (<0.05). SC, sham control; CLP, cecal ligation and puncture; H-ADMSC, healthy adipose-derived mesenchymal stem cell; A-ADMSC, apoptotic adipose-derived mesenchymal stem cell. ANOVA, analysis of variance.
Figure 8
Figure 8
The protein expression of mitochondrial integrity in both lung and kidney and DNA damage marker in kidney at 72 hours after the CLP procedure. A and B) The protein expression of mitochondrial cytochrome C (Mito-Cyt C) in lung (A) and kidney (B). For lung: * versus other groups with different symbols, P <0.01. For kidney: * versus other groups with different symbols, P <0.001. C and D) The protein expression of mitochondrial cytochrome C (Cyto-Cyt C) in lung (C) and kidney (D). For lung: * versus other groups with different symbols, P <0.001. For kidney: * versus other groups with different symbols, P < 0.01. E to H) Immunofluorescent stain (400x) for γ-H2AX + cells (white arrows) in kidney. I) Quantitative analysis of γ-H2AX + cells (%), P <0.0001). DAPI stain for identification of nuclei (blue color). Scale bars in the right lower corner represent 20 μm. Statistical analysis using one-way ANOVA, followed by the Bonferroni multiple comparison post hoc test (n = 8). Symbols (*, †, ‡, §) indicate significant difference (<0.05). SC, sham control; CLP, cecal ligation and puncture; H-ADMSC, healthy adipose-derived mesenchymal stem cell; A-ADMSC, apoptotic adipose-derived mesenchymal stem cell. ANOVA, analysis of variance; DAPI, 4',6-diamidino-2-phenylindole.
Figure 9
Figure 9
Histopathological scoring of kidney injury at 72 hours after the CLP procedure. A to D) H & E stain (400x) showing a significantly higher degree of loss of brush border in renal tubules (yellow arrows), tubular necrosis (green asterisk) and dilatation of Bowman’s capsule (blue arrows) in the CLP group than in the other groups. E) * versus other groups with different symbols (*, †, ‡, §), P <0.0001. All statistical analyses using one-way ANOVA, followed by the Bonferroni multiple comparison post hoc test (n = 8). Symbols (*, †, ‡, §) indicate significance (at 0.05 level). Scale bars in the right lower corner represent 20 μm. SC, sham control; CLP, cecal ligation and puncture; H-ADMSC, healthy adipose-derived mesenchymal stem cell; A-ADMSC, apoptotic adipose-derived mesenchymal stem cell. ANOVA, analysis of variance.
Figure 10
Figure 10
Immunohistochemical (IHC) staining for kidney expressions of anti-oxidative markers at 72 hours after the CLP procedure. A to D) Microscopic findings of IHC stain (200x) for glutathione reductase (GR)-positive cells (brown) in renal parenchyma of the four groups. Scale bars in the right lower corner represent 50 μm. E) * versus other groups with different symbols (*, †, ‡), P <0.0001. F to I) Microscopic findings of IHC stain (200x) for glutathione peroxidase (GPx)-positive cells (brown) in renal parenchyma of the four groups. Scale bars in the right lower corner represent 50 μm. J) * versus other groups with different symbols (*, †, ‡, ¶), P <0.0001. All statistical analyses using one-way ANOVA, followed by the Bonferroni multiple comparison post hoc test (n = 8). Symbols (*, †, ‡, §) indicate significance (at 0.05 level). SC ,sham control; CLP, cecal ligation and puncture; H-ADMSC, healthy adipose-derived mesenchymal stem cell; A-ADMSC, apoptotic adipose-derived mesenchymal stem cell. ANOVA, analysis of variance.
Figure 11
Figure 11
Histopathological changes and inflammatory cell infiltration in lung parenchyma at 72 hours after the CLP procedure. A to D) Microscopic findings of H & E stain (100x) of lung parencyma at 72 hours after the procedure. Scale bars in the right lower corners represent 100 μm. E) Quantitative analysis of the number of alveolar sacs. * versus other groups with different symbols (*, †, ‡, §), P <0.0001. F) Quantitative analysis of crowded score. * versus other groups with different symbols (*, †, ‡, §), P <0.001. G to J) Immunohistochemical stain (200x) for CD3+ cells in lung parencyma at 72 hours after the procedure. Scale bars in right lower corners represent 50 μm. K) Quantitative analysis of CD3+ cells. * versus other groups with different symbols (*, †, ‡, §), P <0.0001. All statistical analyses using one-way ANOVA, followed by the Bonferroni multiple comparison post hoc test (n = 8). Symbols (*, †, ‡, §) indicate significance (at 0.05 level). SC, sham control; CLP, cecal ligation and puncture; H-ADMSC, healthy adipose-derived mesenchymal stem cell; A-ADMSC, apoptotic adipose-derived mesenchymal stem cell. ANOVA, analysis of variance.
Figure 12
Figure 12
The protein expressions of oxidative stress and inflammatory biomarkers in both lung and kidney at 72 hours after the CLP procedure with one dose of ADMSC treatment. The protein expressions of oxidized protein (A, F), matrix metalloproteinase (MMP)-9 (B, G), intercellular adhesion molecule (ICAM) (C, H), tumor necrosis factor alpha (TNF-α) (D, I), and nuclear factor (NF)- κB (E, J) in lung and kidney were highest in CLP and lowest in SC, and significantly higher in CLP + H-ADMSC than in CLP + A-ADMSC (all P values <0.005). * versus other groups with different symbols (*, †, ‡, §), P <0.005. DNP, 1–3 dinitrophenylhydrazone; M.W., molecular weight (Note: Right lane and left lane shown on the upper panel represent control oxidized molecular protein standard and protein molecular weight marker, respectively). 1, sham control (SC); 2, cecal ligation and puncture (CLP); 3, CLP + H-ADMSC; 4, CLP + A-ADMSC. All statistical analyses using one-way ANOVA, followed by the Bonferroni multiple comparison post hoc test (n = 6). Symbols (*, †, ‡, §) indicate significance (at 0.05 level). SC, sham control; CLP, cecal ligation and puncture; H-ADMSC, healthy adipose-derived mesenchymal stem cell; A-ADMSC, apoptotic adipose-derived mesenchymal stem cell. ANOVA, analysis of variance.
Figure 13
Figure 13
Histopathological changes in lung and kidney at 72 hours after the CLP procedure with one dose of ADMSC treatment. A to D) Microscopic findings of H & E stain (100x) of lung parenchyma at 72 hours after the procedure. Scale bars in the right lower corners represent 100 μm. E) Quantitative analysis of the number of alveolar sacs. * versus other groups with different symbols (*, †, ‡, §), P <0.001. F) Quantitative analysis of crowded score. * versus other groups with different symbols (*, †, ‡, §), P <0.001. G to J) H & E stain (200x) showing the pathological findings in kidney at 72 hours after the CLP procedure. Scale bars in the right lower corners represent 50 μm. yellow arrows = loss of brush border in renal tubules; blue arrows = dilatation of Bowman’s capsule. K) * versus other groups with different symbols (*, †, ‡, §), P <0.001. All statistical analyses using one-way ANOVA, followed by the Bonferroni multiple comparison post hoc test (n = 6). Symbols (*, †, ‡, §) indicate significance (at 0.05 level). SC, sham control; CLP, cecal ligation and puncture; H-ADMSC, healthy adipose-derived mesenchymal stem cell; A-ADMSC ,apoptotic adipose-derived mesenchymal stem cell. ANOVA, analysis of variance.
Figure 14
Figure 14
Immunofluorescent staining for identifying infiltration of CD68+ cells in lung and kidney at 72 hours after the CLP procedure with one dose of ADMSC treatment. A to D) and F to I) IF microscopic findings (200x) of the number of CD68+ cells (white arrows indicate CD68+ cells) in lung and kidney parenchyma, respectively. Scale bars in the right lower corners represent 50 μm. E) and J) Quantitative analysis of the number of CD68+ cells in lung and kidney, respectively. Yellow arrows indicated the ADMSCs. * versus other groups with different symbols (*, †, ‡, §), P <0.0001. All statistical analyses using one-way ANOVA, followed by the Bonferroni multiple comparison post hoc test (n = 6). Symbols (*, †, ‡, §) indicate significance (at 0.05 level). SC, sham control; CLP, cecal ligation and puncture; H-ADMSC, healthy adipose-derived mesenchymal stem cell; A-ADMSC, apoptotic adipose-derived mesenchymal stem cell. ANOVA, analysis of variance.

Similar articles

Cited by

References

    1. Dellinger RP, Levy MM, Carlet JM, Bion J, Parker MM, Jaeschke R, Reinhart K, Angus DC, Brun-Buisson C, Beale R, Calandra T, Dhainaut JF, Gerlach H, Harvey M, Marini JJ, Marshall J, Ranieri M, Ramsay G, Sevransky J, Thompson BT, Townsend S, Vender JS, Zimmerman JL, Vincent JL. International Surviving Sepsis Campaign Guidelines Committee; American Association of Critical-Care Nurses; American College of Chest Physicians; American College of Emergency Physicians; Canadian Critical Care Society; European Society of Clinical Microbiology and Infectious Diseases et al.Surviving Sepsis Campaign: international guidelines for management of severe sepsis and septic shock: 2008. Crit Care Med. 2008;4:296–327. doi: 10.1097/01.CCM.0000298158.12101.41. - DOI - PubMed
    1. Cronshaw HL, Daniels R, Bleetman A, Joynes E, Sheils M. Impact of the Surviving Sepsis Campaign on the recognition and management of severe sepsis in the emergency department: are we failing? Emerg Med J. 2011;4:670–675. doi: 10.1136/emj.2009.089581. - DOI - PubMed
    1. Tipler PS, Pamplin J, Mysliwiec V, Anderson D, Mount CA. Use of a protocolized approach to the management of sepsis can improve time to first dose of antibiotics. J Crit Care. 2013;4:148–151. doi: 10.1016/j.jcrc.2012.08.021. - DOI - PubMed
    1. Grozdanovski K, Milenkovic Z, Demiri I, Spasovska K. Prediction of outcome from community-acquired severe sepsis and septic shock in tertiary-care university hospital in a developing country. Crit Care Res Pract. 2012;4:182324. - PMC - PubMed
    1. Aziz M, Jacob A, Yang WL, Matsuda A, Wang P. Current trends in inflammatory and immunomodulatory mediators in sepsis. J Leukoc Biol. 2013;4:329–342. doi: 10.1189/jlb.0912437. - DOI - PMC - PubMed

Publication types

MeSH terms