. 2014 Mar 7;289(10):6451-6461.
doi: 10.1074/jbc.M113.529503. Epub 2014 Jan 22.

Shear stress-induced redistribution of vascular endothelial-protein-tyrosine phosphatase (VE-PTP) in endothelial cells and its role in cell elongation

Affiliations

Shear stress-induced redistribution of vascular endothelial-protein-tyrosine phosphatase (VE-PTP) in endothelial cells and its role in cell elongation

Kemala Isnainiasih Mantilidewi et al. J Biol Chem. .

Abstract

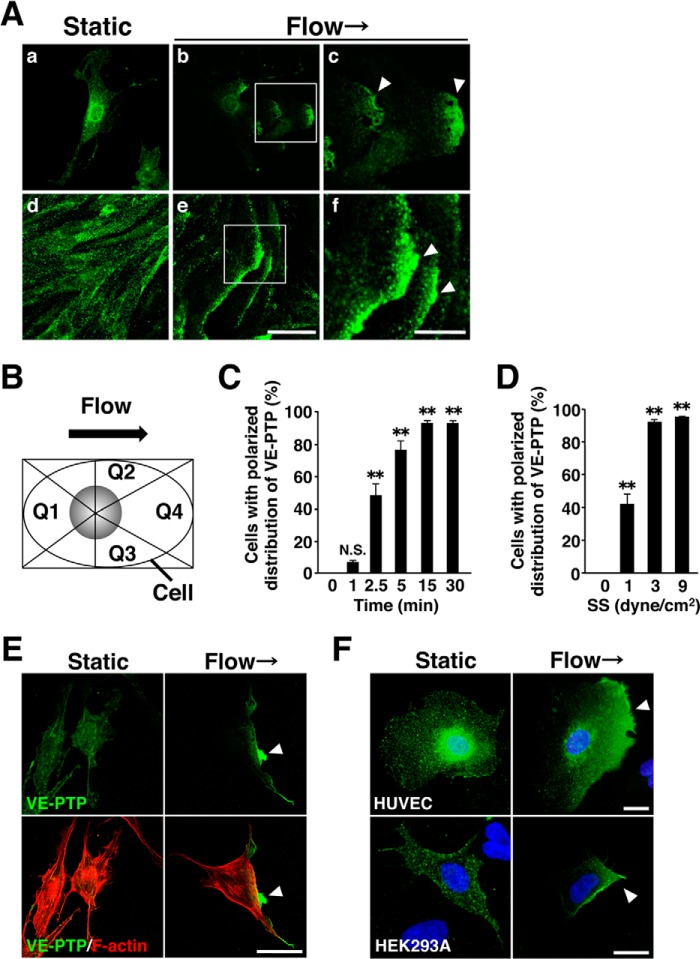
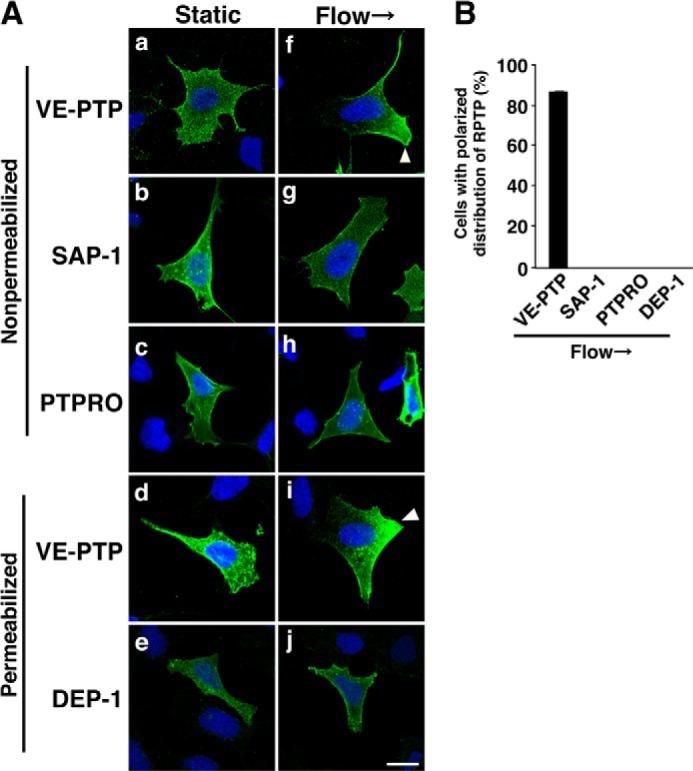
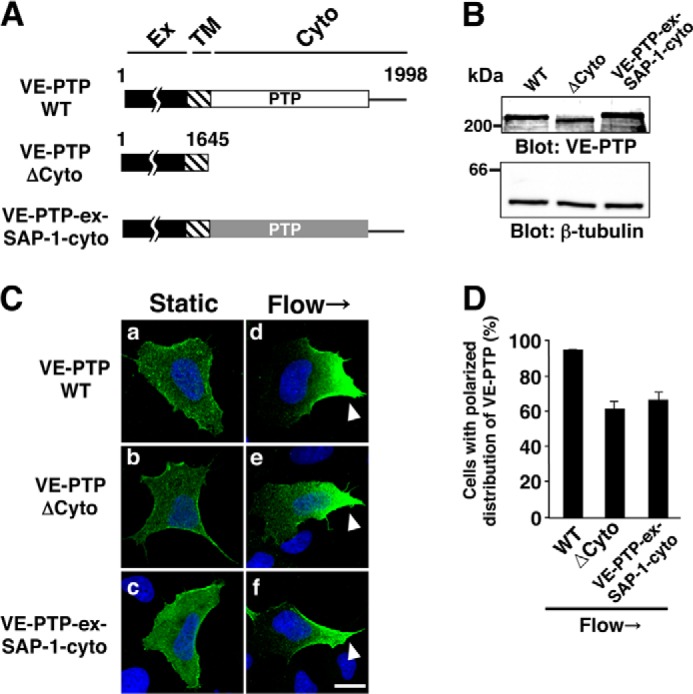
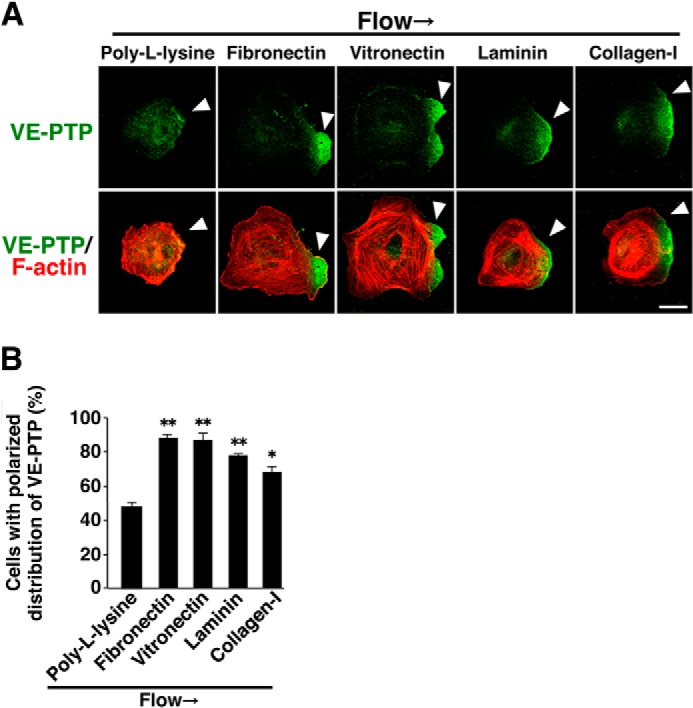
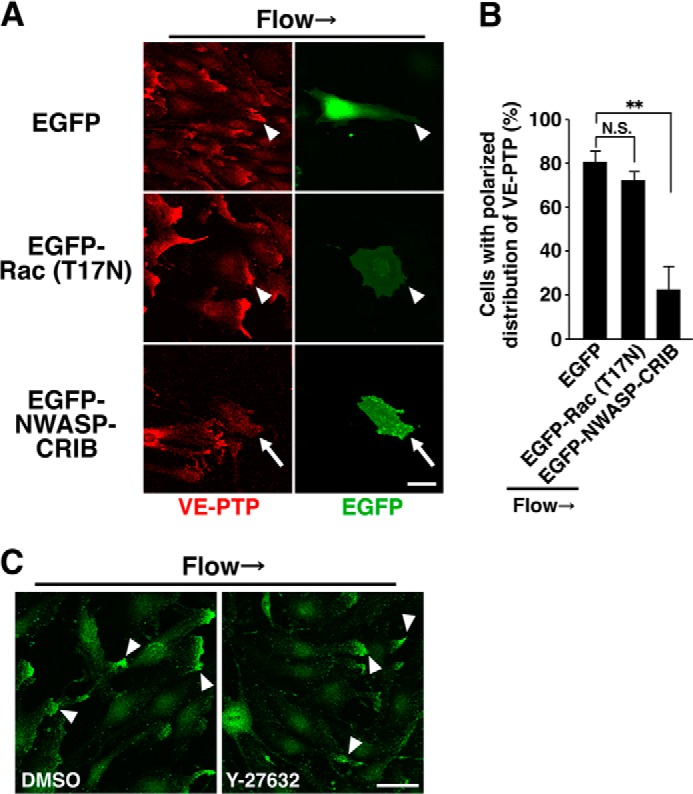
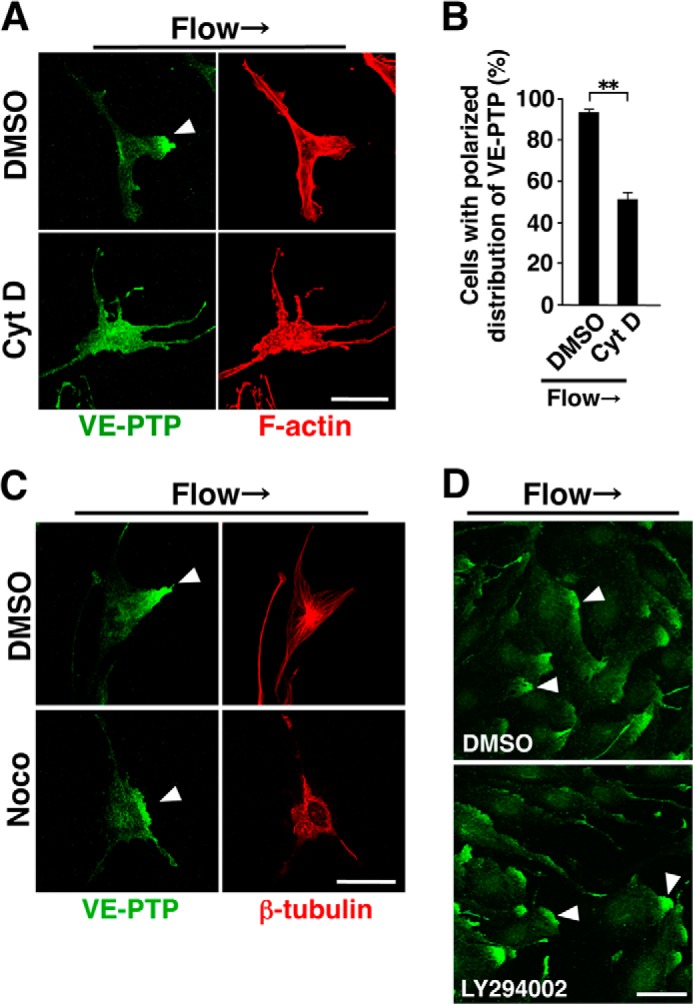
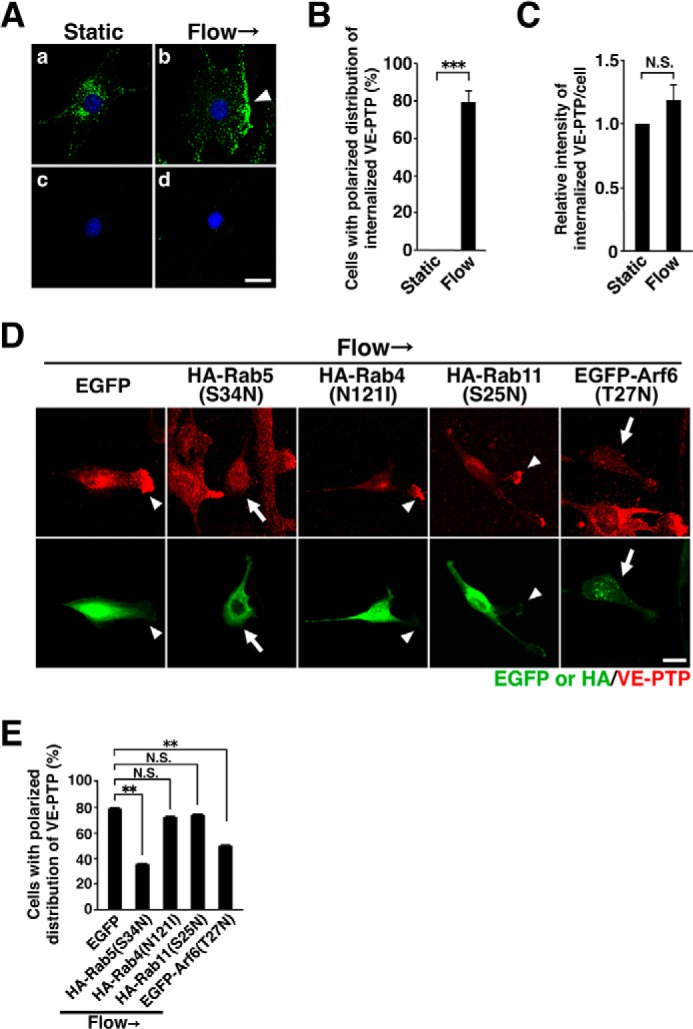
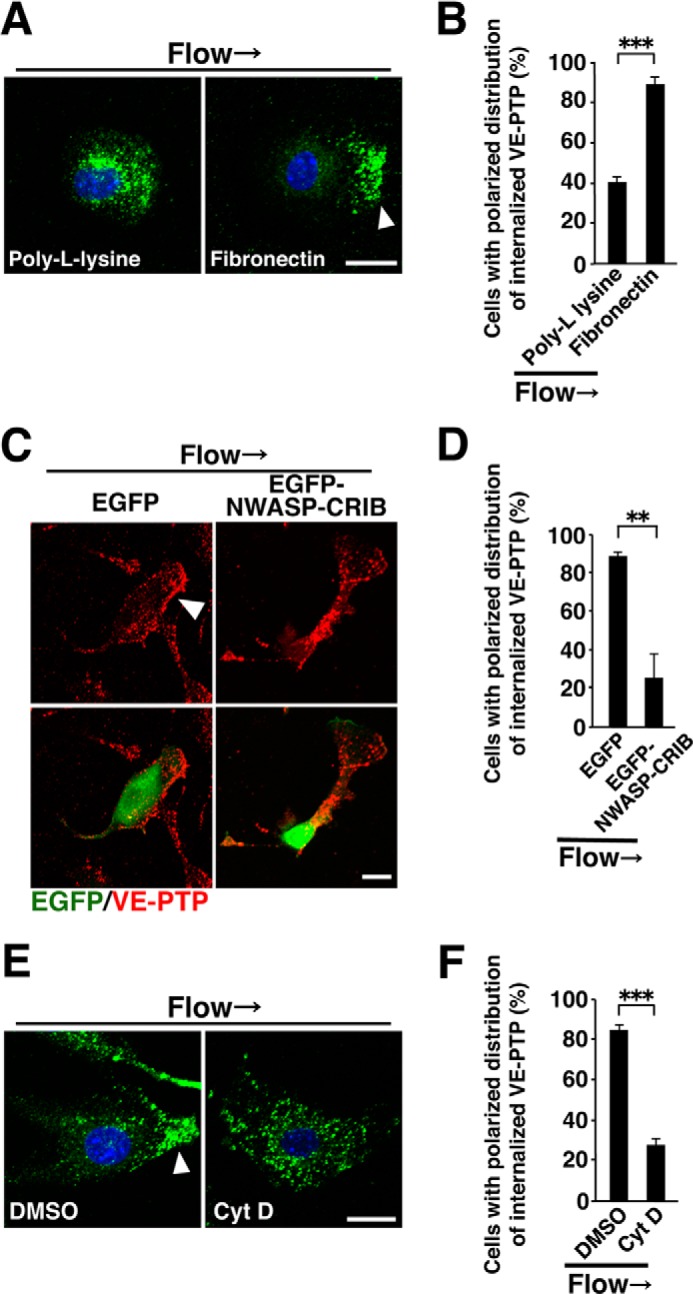
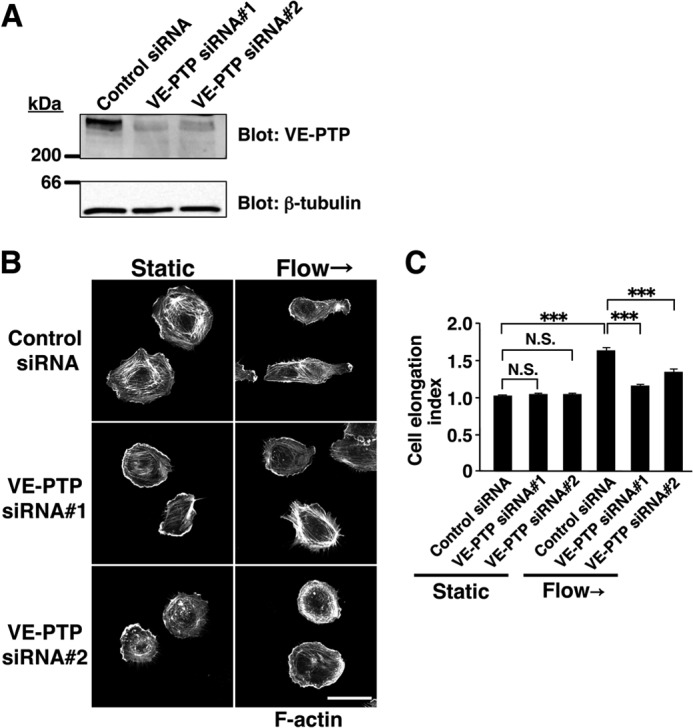
Vascular endothelial cells (ECs) are continuously exposed to shear stress (SS) generated by blood flow. Such stress plays a key role in regulation of various aspects of EC function including cell proliferation and motility as well as changes in cell morphology. Vascular endothelial-protein-tyrosine phosphatase (VE-PTP) is an R3-subtype PTP that possesses multiple fibronectin type III-like domains in its extracellular region and is expressed specifically in ECs. The role of VE-PTP in EC responses to SS has remained unknown, however. Here we show that VE-PTP is diffusely localized in ECs maintained under static culture conditions, whereas it undergoes rapid accumulation at the downstream edge of the cells relative to the direction of flow in response to SS. This redistribution of VE-PTP triggered by SS was found to require its extracellular and transmembrane regions and was promoted by integrin engagement of extracellular matrix ligands. Inhibition of actin polymerization or of Cdc42, Rab5, or Arf6 activities attenuated the SS-induced redistribution of VE-PTP. VE-PTP also underwent endocytosis in the static and SS conditions. SS induced the polarized distribution of internalized VE-PTP. Such an effect was promoted by integrin engagement of fibronectin but prevented by inhibition of Cdc42 activity or of actin polymerization. In addition, depletion of VE-PTP by RNA interference in human umbilical vein ECs blocked cell elongation in the direction of flow induced by SS. Our results suggest that the polarized redistribution of VE-PTP in response to SS plays an important role in the regulation of EC function by blood flow.

Keywords: Endothelial Cell; Membrane Proteins; Protein-tyrosine Phosphatase (Tyrosine Phosphatase); Shear Stress; Small GTPases.


Figures

FIGURE 1.
FIGURE 1.
SS induces the rapid accumulation of VE-PTP at the downstream edge of ECs. A, bEnd.3 cells were cultured on fibronectin-coated glass coverslips at low (panels a–c) or high (panels d–f) cell density and were either maintained under the static condition (panels a and d) or exposed to SS at 3 dyne/cm2 for 15 min (panels b, c, e, and f). The cells were then subjected to immunofluorescence staining with a mAb to VE-PTP (green). The boxed regions in panels b and e are shown at higher magnification in panels c and f, respectively. Arrowheads indicate accumulation of VE-PTP at the downstream edge of the cells relative to the direction of flow indicated by the arrow. Scale bars, 50 μm in panel e and 20 μm in panel f. B, for quantification of VE-PTP distribution, images of sheared or static cells were divided into quadrants (Q1, Q2, Q3, and Q4). C, bEnd.3 cells were exposed to SS at 3 dyne/cm2 for the indicated times and then subjected to immunostaining as in A. The percentage of cells showing a polarized distribution of VE-PTP was determined. Data are the means ± S.E. from three separate experiments, with 20 cells being examined for each condition in each experiment. **, p < 0.01 (one-way ANOVA and Tukey's test) versus the static condition (0 min). N.S., not significant. D, b.End3 cells were exposed to SS at the indicated levels for 15 min and then examined for the percentage of cells showing a polarized distribution of VE-PTP as in C. **, p < 0.01 (one-way ANOVA and Tukey's test) versus the static condition (0 dyne/cm2). E, bEnd.3 cells were cultured at low density and either maintained under the static condition or exposed to SS as in A. The cells were then subjected to immunostaining without cell permeabilization with the mAb to VE-PTP (green), which recognizes the extracellular domain of the protein, after which they were permeabilized and stained with rhodamine-phalloidin to visualize F-actin (red). Arrowheads indicate accumulation of VE-PTP. Scale bar, 50 μm. F, HUVECs or HEK293A cells were transfected with an expression vector for VE-PTP, plated on fibronectin-coated glass coverslips, and cultured for 12 h, after which they were either maintained under the static condition or exposed to SS as in A. They were then subjected to immunostaining for VE-PTP (green) and to staining of nuclei with DAPI (blue). Arrowheads indicate accumulation of VE-PTP in response to SS. Scale bars, 20 μm. Results in A, E, and F are representative of at least three separate experiments.
FIGURE 2.
FIGURE 2.
Effect of SS on the subcellular localization of other R3-subtype PTPs. A, HEK293A cells transfected with expression vectors for either VE-PTP (panels a, d, f, and i), SAP-1 (panels b and g), PTPRO (panels c and h), or HA-tagged DEP-1 (panels e and j) were plated on fibronectin-coated glass coverslips, cultured for 12 h, and then either maintained under the static condition (panels a–e) or exposed to SS at 3 dyne/cm2 for 15 min (panels f–j). The cells were then subjected to immunostaining (green) with mAbs to VE-PTP (panels a, d, f, and i), to SAP-1 (panels b and g), to PTPRO (panels c and h), or to HA (panels e and j) under nonpermeabilized (panels a–c and f–h) or permeabilized (panels d, e, i, and j) conditions (the mAbs to VE-PTP, to SAP-1, and to PTPRO each recognize the extracellular domain of the corresponding PTP). Nuclei were also stained with DAPI (blue). Arrowheads indicate accumulation of VE-PTP at the downstream edge of cells in response to SS. Scale bar, 20 μm. B, the percentage of cells with a polarized distribution of exogenously expressed RPTP after exposure to SS was determined for HEK293A cells transfected and treated as in A. Data are the means ± S.E. from three separate experiments, with 20 cells being examined for each condition in each experiment.
FIGURE 3.
FIGURE 3.
Importance of the extracellular and transmembrane regions of VE-PTP for its SS-induced redistribution. A, schematic representation of WT and mutant forms of mouse VE-PTP. Ex, extracellular domain; TM, transmembrane domain; Cyto, cytoplasmic domain; PTP, protein-tyrosine phosphatase domain. B, HEK293A cells transfected with expression vectors for the indicated VE-PTP proteins were subjected to immunoblot analysis with a mAb that recognizes the extracellular domain of VE-PTP as well as with a mAb to β-tubulin (loading control). C, HEK293A cells transfected with expression vectors for the indicated VE-PTP proteins were plated on fibronectin-coated glass coverslips, cultured for 12 h, and then either maintained under the static condition (panels a–c) or exposed to SS at 3 dyne/cm2 for 15 min (panels d–f). They were then subjected to immunostaining with the mAb to VE-PTP (green) and to staining of nuclei with DAPI (blue). Arrowheads indicate accumulation of the WT or mutant forms of VE-PTP at the downstream edge of cells relative to the direction of flow. Scale bar, 20 μm. D, HEK293A cells were transfected and treated as in C, after which the percentage of transfected cells showing a polarized distribution of either WT or mutant VE-PTP in response to SS was determined. Data are the means ± S.E. from three separate experiments, with 20 cells being examined for each condition in each experiment.
FIGURE 4.
FIGURE 4.
Role of integrins in the SS-induced redistribution of VE-PTP. A, bEnd.3 cells were plated on glass coverslips coated with either fibronectin, vitronectin, laminin, collagen-I, or poly-l-lysine, cultured for 2 h in serum-free medium, and then exposed to SS at 3 dyne/cm2 for 15 min. The cells were then subjected to immunostaining with a mAb to VE-PTP (green) as well as to staining with rhodamine-phalloidin to visualize F-actin (red). Arrowheads indicate accumulation of VE-PTP at the downstream edge of cells relative to the direction of flow. Scale bar, 20 μm. B, the percentage of cells with a polarized distribution of VE-PTP was determined for cells treated as in A. Data are the means ± S.E. from three separate experiments, with 20 cells being examined for each condition in each experiment. *, p < 0.05; **, p < 0.01 (one-way ANOVA and Tukey's test) versus cells plated on poly-l-lysine.
FIGURE 5.
FIGURE 5.
Importance of Cdc42 in the SS-induced redistribution of VE-PTP. A, bEnd.3 cells transfected with expression vectors for either EGFP, EGFP-Rac(T17N), or EGFP-NWASP-CRIB were plated on fibronectin-coated glass coverslips and cultured for 12 h before exposure to SS at 3 dyne/cm2 for 15 min. They were then subjected to immunostaining with a mAb to VE-PTP (red). EGFP fluorescence was monitored to identify transfected cells (green). Arrowheads or arrows indicate cells with or without accumulation of VE-PTP at their downstream edge relative to the direction of flow, respectively. Scale bar, 20 μm. B, the percentage of EGFP-positive cells with a polarized distribution of VE-PTP was determined for cells treated as in A. Data are the means ± S.E. from three separate experiments, with 20 cells being examined for each condition in each experiment. **, p < 0.01 (one-way ANOVA and Tukey's test). N.S., not significant. C, bEnd.3 cells plated on fibronectin-coated glass coverslips were incubated with either DMSO (0.2%, vehicle) or Y-27632 (5 μm) for 30 min and then exposed to SS at 3 dyne/cm2 for 15 min. They were then subjected to immunostaining with a mAb to VE-PTP (green). Arrowheads indicate accumulation of VE-PTP at the downstream edge of cells relative to the direction of flow. Scale bar, 50 μm. Results in A and C are representative of at least three separate experiments.
FIGURE 6.
FIGURE 6.
Importance of the actin cytoskeleton in the SS-induced redistribution of VE-PTP. A, bEnd.3 cells plated (at low density) on fibronectin-coated glass coverslips were incubated with either 1 μm cytochalasin D (Cyt D) or DMSO (0.2%, vehicle) for 1 h and then exposed to SS at 3 dyne/cm2 for 15 min. The cells were then subjected to immunostaining with a mAb to VE-PTP (green) and to staining of F-actin with rhodamine-phalloidin (red). The arrowhead indicates accumulation of VE-PTP at the downstream edge of a cell relative to the direction of flow. Scale bar, 50 μm. B, the percentage of cells with a polarized distribution of VE-PTP was determined for cells treated as in A. Data are the means ± S.E. from three separate experiments, with 20 cells being examined for each condition in each experiment. **, p < 0.01 (Student's t test). C and D, bEnd.3 cells plated on fibronectin-coated glass coverslips were incubated with 20 μm nocodazole (C; Noco), LY294002 (D; 30 μm), or DMSO (C and D; 0.2%, vehicle) for 30 min, exposed to SS at 3 dyne/cm2 for 15 min, and then subjected to immunostaining with mAbs to VE-PTP (C and D; green) and to β-tubulin (C; red). Arrowheads indicate accumulation of VE-PTP at the downstream edge of cells relative to the direction of flow. Scale bars, 50 μm. Results in A, C, and D are representative of at least three separate experiments.
FIGURE 7.
FIGURE 7.
Role of Rab5 and Arf6 in the SS-induced redistribution of VE-PTP. A, bEnd.3 cells were cultured on fibronectin-coated glass coverslips at low cell density, incubated with a mAb to VE-PTP on ice for 15 min, and then either maintained under the static condition (panels a and c) or exposed to SS at 3 dyne/cm2 for 30 min (panels b and d). The cells were then washed with acid solution and subjected to immunostaining with (panels a and b) or without (panels c and d) cell permeabilization with secondary antibodies to visualize antibody-labeled VE-PTP and to staining of nuclei with DAPI (blue). The arrowhead indicates accumulation of internalized VE-PTP at the downstream edge of the cells relative to the direction of flow. Scale bar, 20 μm. B, the percentage of cells with a polarized distribution of internalized VE-PTP was determined for cells treated as in A. ***, p < 0.001 (Student's t test). C, the fluorescence intensity of internalized VE-PTP per cell was measured for cells treated as in A and presented as -fold increase relative to the values for cells under the static conditions. N.S., not significant. D, bEnd.3 cells transfected with expression vectors for the indicated proteins were plated on fibronectin-coated glass coverslips, cultured for 12 h, and exposed to SS at 3 dyne/cm2 for 15 min. The cells were then subjected to immunostaining with mAbs to VE-PTP (red) or to HA (green; for detection of HA-tagged Rab mutants). Cells expressing EGFP or EGFP-tagged Arf6(T27N) were identified by direct monitoring of EGFP fluorescence (green). Arrowheads or arrows indicate cells with or without a polarized distribution of VE-PTP, respectively. Scale bar, 20 μm. E, the percentage of cells with a polarized distribution of VE-PTP was determined for cells transfected and treated as in D. **, p < 0.01 (one-way ANOVA and Tukey's test). Data in B, C, and E are the means ± S.E. from three separate experiments, with 15 cells (B and C) or 20 cells (E) being examined for each condition in each experiment.
FIGURE 8.
FIGURE 8.
Role of integrins, Cdc42 and the actin cytoskeleton in the SS-induced redistribution of internalized VE-PTP. A, bEnd.3 cells were plated on glass coverslips coated with either fibronectin or poly-l-lysine and cultured in serum-free medium for 1.5 h, after which the cells were further cultured in serum-free medium containing 3% BSA for 0.5 h, incubated with a mAb to VE-PTP on ice for 15 min, and then exposed to SS at 3 dyne/cm2 for 30 min. The cells were then washed with acid solution and subjected to immunostaining with cell permeabilization, with secondary antibodies to visualize antibody-labeled VE-PTP, and to staining of nuclei with DAPI (blue). Scale bar, 20 μm. B, the percentage of cells with a polarized distribution of internalized VE-PTP was determined for cells treated as in A. C, bEnd.3 cells plated on fibronectin-coated glass coverslips were transfected with expression vectors for the indicated proteins and cultured for 24 h. The cells were then incubated with a mAb to VE-PTP, exposed to SS, and subjected to immunostaining as in A. Cells expressing EGFP or EGFP-tagged NWASP-CRIB were identified by direct monitoring of EGFP fluorescence (green). Scale bar, 20 μm. D, b.End3 cells were treated as in C and then examined for the percentage of cells showing a polarized distribution of internalized VE-PTP. E, bEnd.3 cells plated on fibronectin-coated glass coverslips were incubated with either 1 μm cytochalasin D (Cyt D) or DMSO (0.2%, vehicle) for 30 min. The cells were then incubated with a mAb to VE-PTP, exposed to SS, and then subjected to immunostaining as in A. Scale bar, 20 μm. F, b.End3 cells were treated as in E and then examined for the percentage of cells with a polarized distribution of internalized VE-PTP. Results in A, C, and E are representative of at least three separate experiments. Arrowheads in A, C, and E indicate accumulation of antibody-labeled VE-PTP at the downstream edge of the cells relative to the direction of flow. Data in B, D, and F are the means ± S.E. from three separate experiments, with 20 cells being examined for each condition in each experiment. **, p < 0.01; ***, p < 0.001 (Student's t test).
FIGURE 9.
FIGURE 9.
Participation of VE-PTP in SS-induced cell spreading and elongation. A, HUVECs transfected with control or VE-PTP (#1 or #2) siRNAs were subjected to immunoblot analysis with pAbs to VE-PTP and a mAb to β-tubulin (loading control). B, HUVECs transfected with the indicated siRNAs were plated on fibronectin-coated cover glasses, cultured in serum-free medium for 1 h, and then either maintained under the static conditions or exposed to SS at 9 dyne/cm2 for 30 min. The cells were then subjected to staining with rhodamine-phalloidin to visualize cell shape. Scale bar, 50 μm. C, cell elongation index (ratio of the maximum length of a cell in the direction of flow to that in the perpendicular direction) for HUVECs transfected and treated as in B. Data are the means ± S.E. for a total of 150 cells for each condition in three separate experiments. ***, p < 0.001 (Kruskal-Wallis test and Dunn's post hoc test). N.S., not significant.

Similar articles

Cited by

References

    1. Hahn C., Schwartz M. A. (2009) Mechanotransduction in vascular physiology and atherogenesis. Nat. Rev. Mol. Cell Biol. 10, 53–62 - PMC - PubMed
    1. Davies P. F., Mundel T., Barbee K. A. (1995) A mechanism for heterogeneous endothelial responses to flow in vivo and in vitro. J. biomech. 28, 1553–1560 - PubMed
    1. Ando J., Yamamoto K. (2009) Vascular mechanobiology. Endothelial cell responses to fluid shear stress. Circ. J. 73, 1983–1992 - PubMed
    1. Li Y. S., Haga J. H., Chien S. (2005) Molecular basis of the effects of shear stress on vascular endothelial cells. J. Biomech. 38, 1949–1971 - PubMed
    1. Tai L. K., Okuda M., Abe J., Yan C., Berk B. C. (2002) Fluid shear stress activates proline-rich tyrosine kinase via reactive oxygen species-dependent pathway. Arterioscler. Thromb. Vasc. Biol. 22, 1790–1796 - PubMed

Publication types

MeSH terms

Substances

LinkOut - more resources