. 2014 Mar 7;289(10):6513-6525.
doi: 10.1074/jbc.M113.532523. Epub 2014 Jan 22.

p53 protein regulates Hsp90 ATPase activity and thereby Wnt signaling by modulating Aha1 expression

Affiliations

p53 protein regulates Hsp90 ATPase activity and thereby Wnt signaling by modulating Aha1 expression

Sachiyo Okayama et al. J Biol Chem. .

Retraction in

Abstract

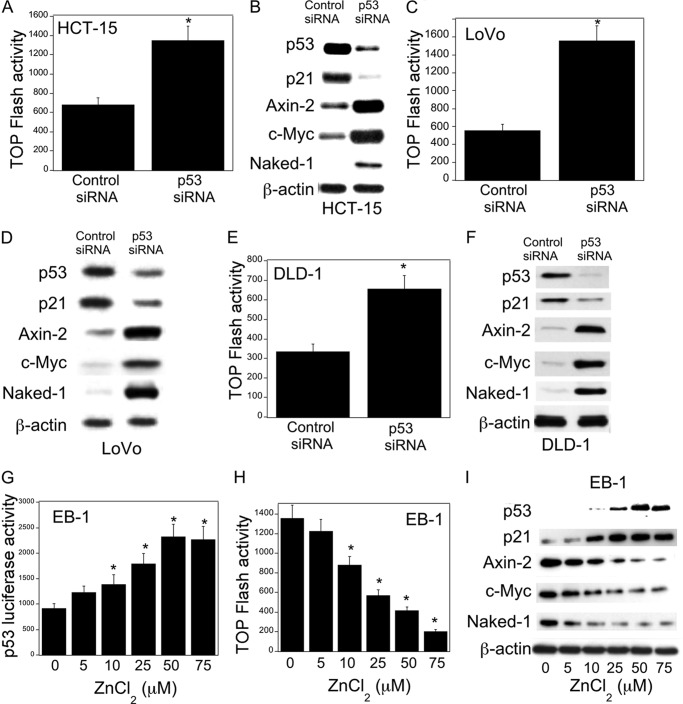
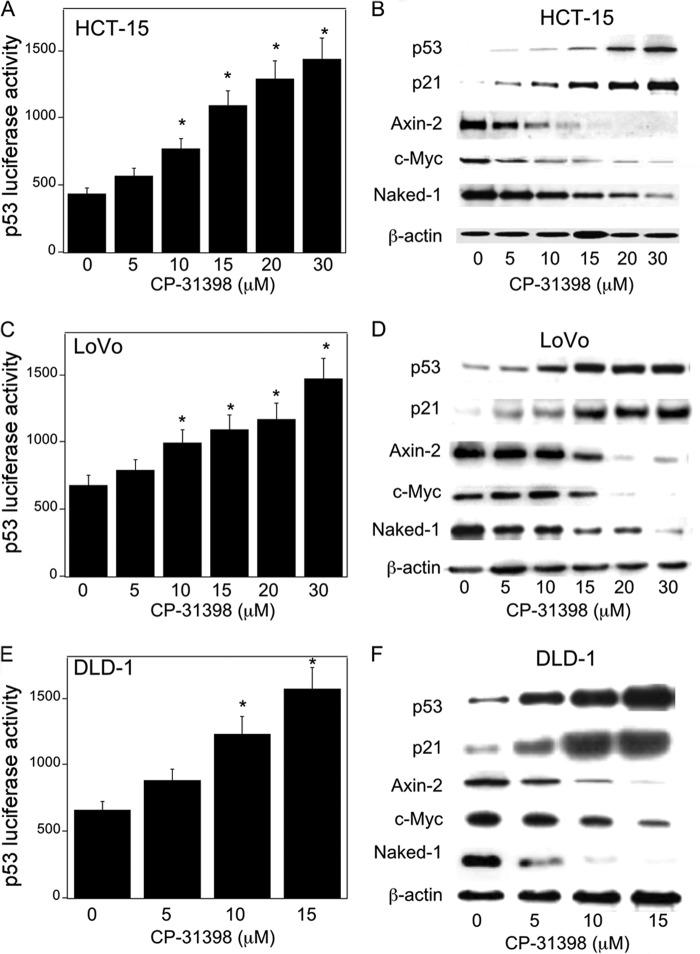
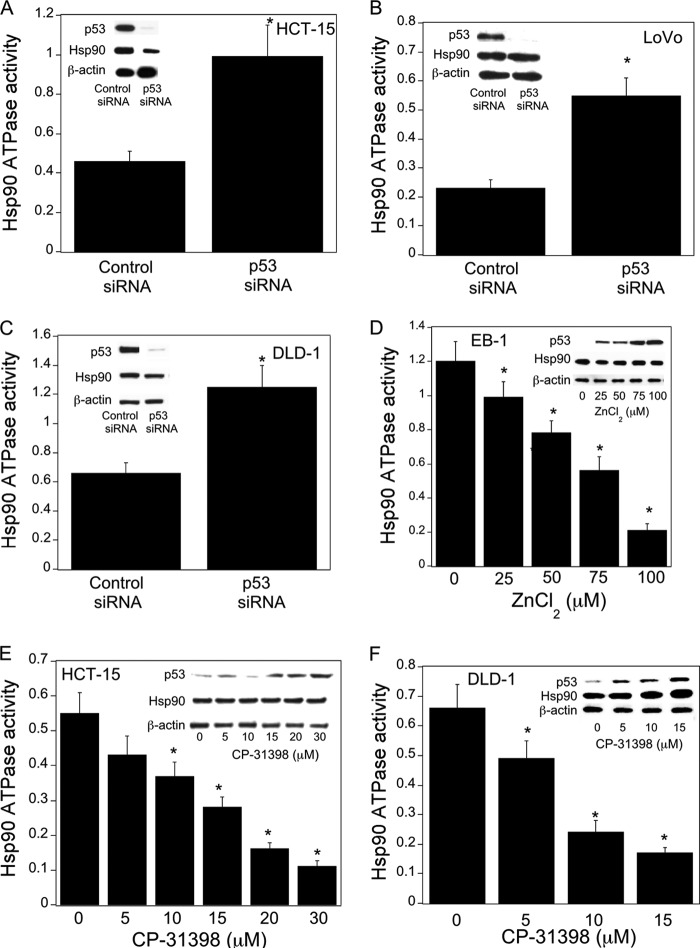
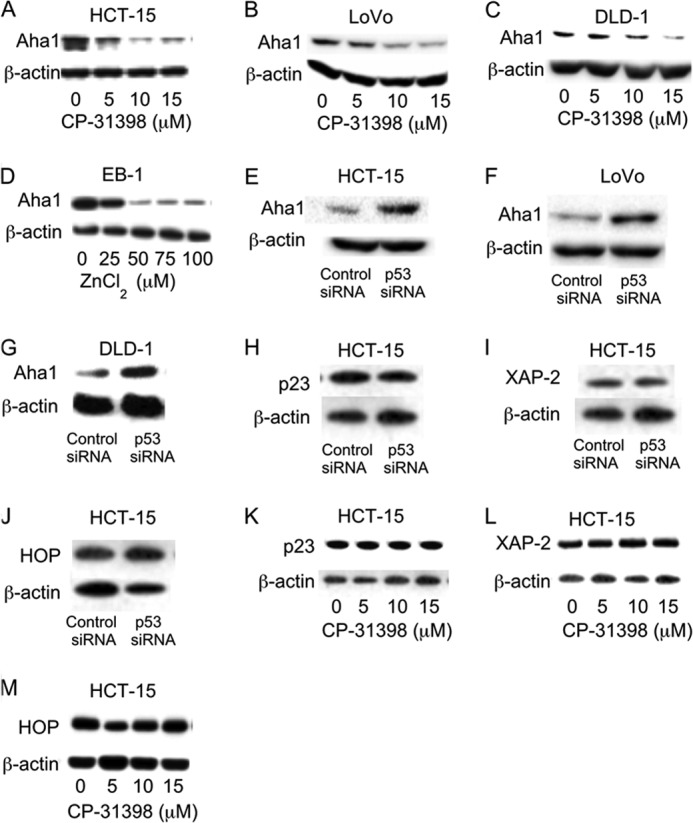
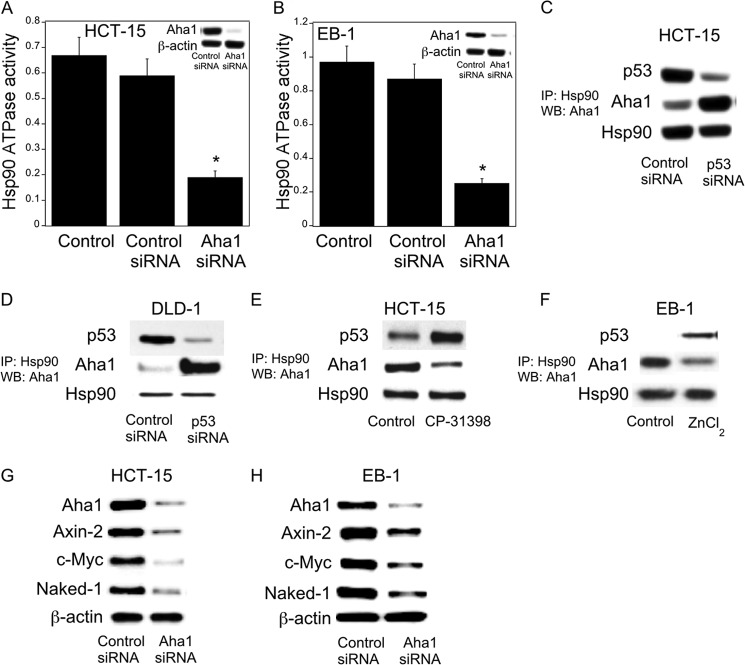
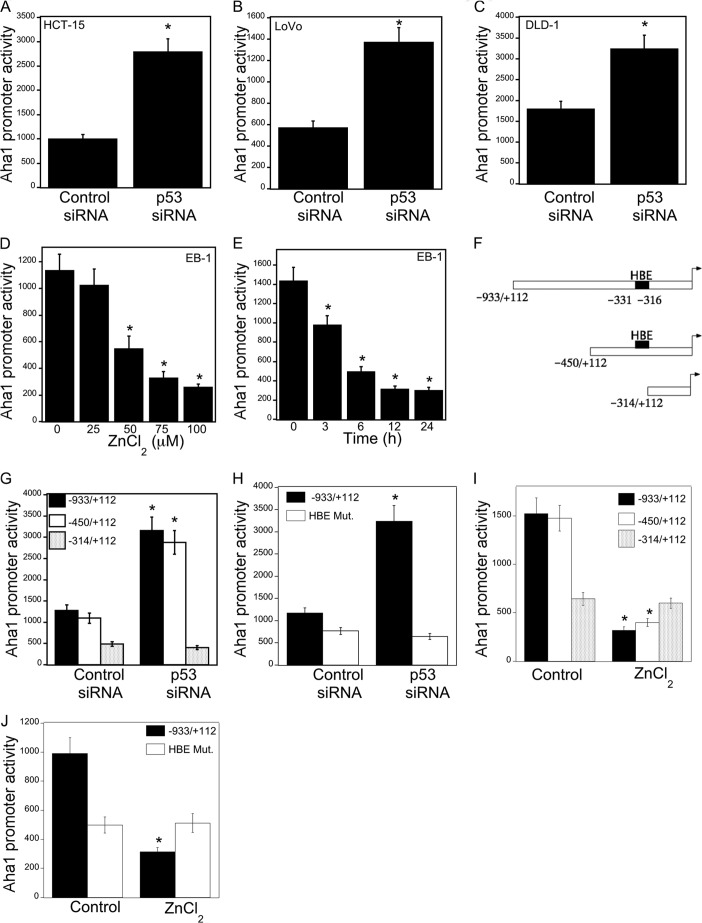
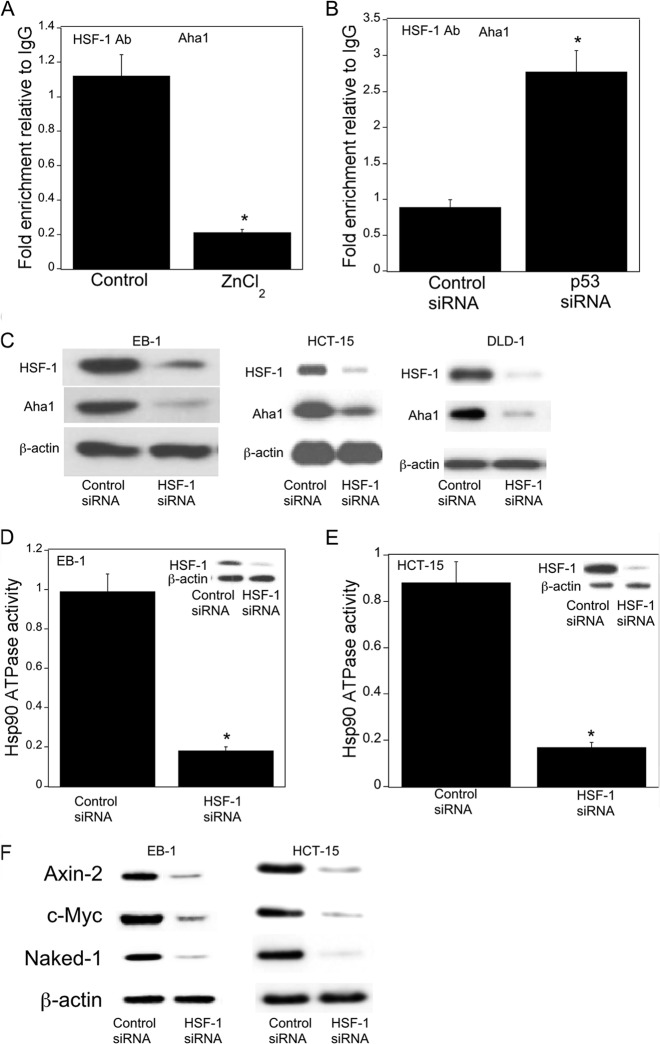
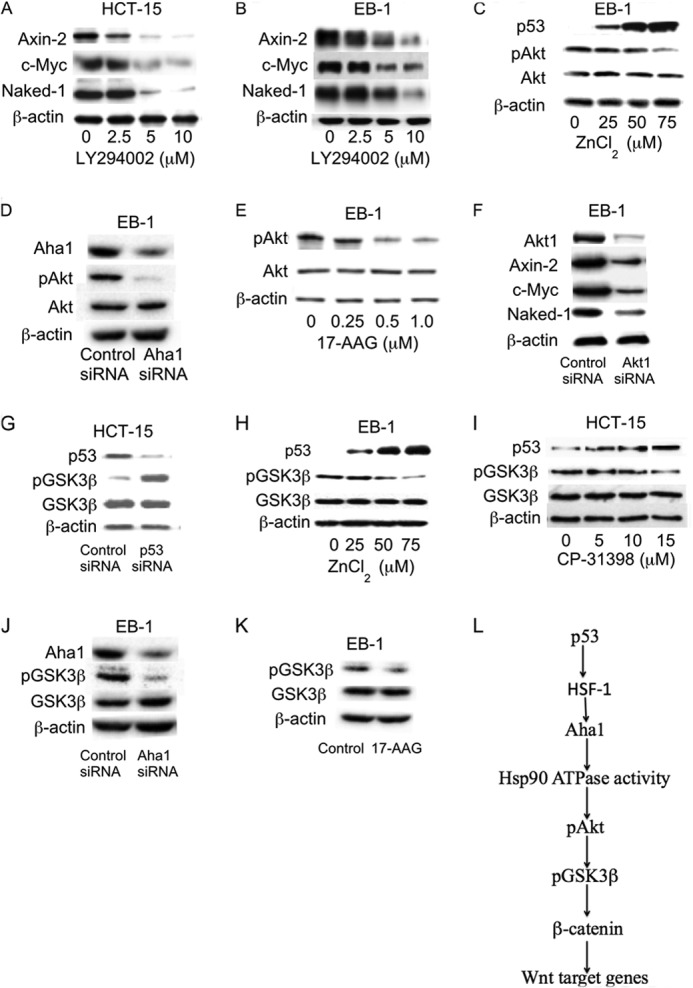
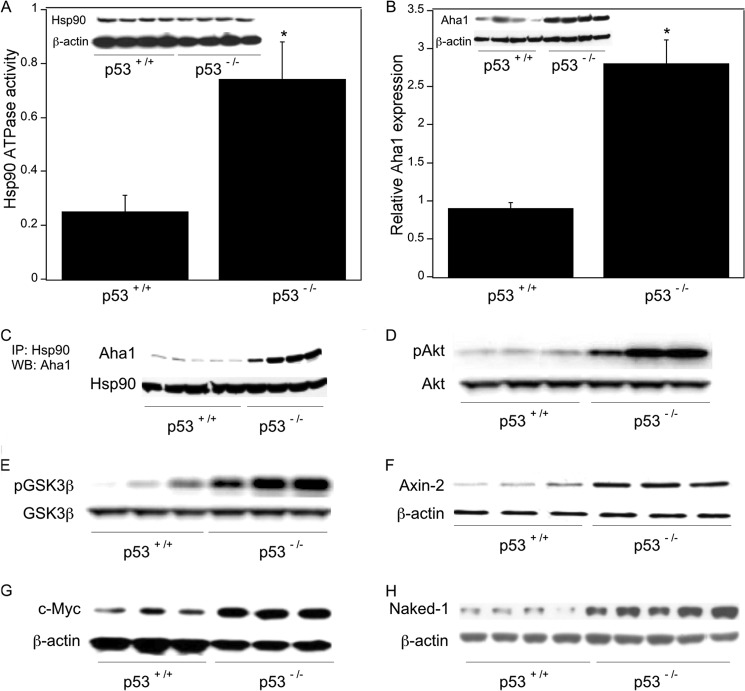
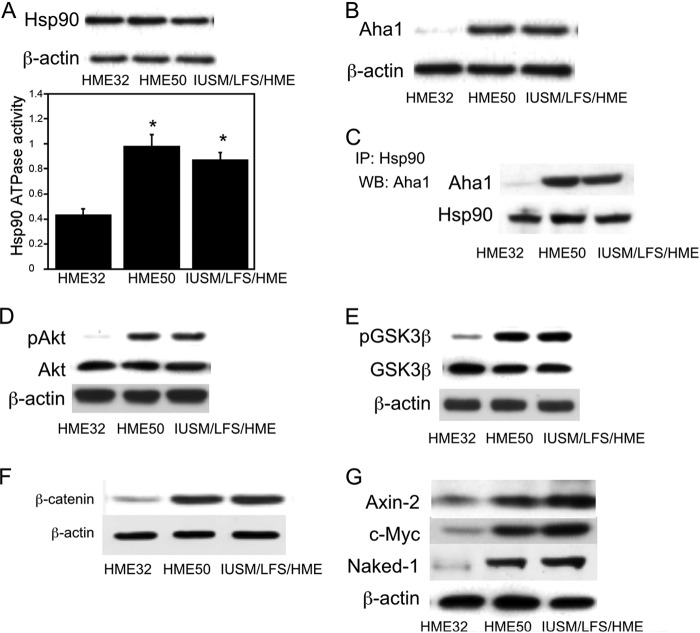
The p53 tumor suppressor gene encodes a homotetrameric transcription factor which is activated in response to a variety of cellular stressors, including DNA damage and oncogene activation. p53 mutations occur in >50% of human cancers. Although p53 has been shown to regulate Wnt signaling, the underlying mechanisms are not well understood. Here we show that silencing p53 in colon cancer cells led to increased expression of Aha1, a co-chaperone of Hsp90. Heat shock factor-1 was important for mediating the changes in Aha1 levels. Increased Aha1 levels were associated with enhanced interactions with Hsp90, resulting in increased Hsp90 ATPase activity. Moreover, increased Hsp90 ATPase activity resulted in increased phosphorylation of Akt and glycogen synthase kinase-3β (GSK3β), leading to enhanced expression of Wnt target genes. Significantly, levels of Aha1, Hsp90 ATPase activity, Akt, and GSK3β phosphorylation and expression of Wnt target genes were increased in the colons of p53-null as compared with p53 wild type mice. Using p53 heterozygous mutant epithelial cells from Li-Fraumeni syndrome patients, we show that a monoallelic mutation of p53 was sufficient to activate the Aha1/Hsp90 ATPase axis leading to stimulation of Wnt signaling and increased expression of Wnt target genes. Pharmacologic intervention with CP-31398, a p53 rescue agent, inhibited recruitment of Aha1 to Hsp90 and suppressed Wnt-mediated gene expression in colon cancer cells. Taken together, this study provides new insights into the mechanism by which p53 regulates Wnt signaling and raises the intriguing possibility that p53 status may affect the efficacy of anticancer therapies targeting Hsp90 ATPase.

Keywords: Colon Cancer; Hsp90; Wnt Pathway; p53; β-Catenin.


Figures

FIGURE 1.
FIGURE 1.
p53 regulates Wnt signaling. A, C, and E, cells were transfected with 0.45 μg each of TOP Flash and FOP Flash constructs and 0.2 μg of pSVβgal. Cells also received 0.9 μg of siRNA to GFP (control siRNA) or p53. 48 h after transfection, cells were harvested, and luciferase activity was measured. TOP Flash activity was determined by the ratio of pTOP-flash to pFOP-flash luciferase activity, each normalized to β-galactosidase enzymatic activity levels. B, D, and F, cells were transfected with 2 μg of siRNA (control) to GFP or p53 for 48 h. Following transfection, cells were harvested, and cell lysates were subjected to Western blotting. The blots were probed with antibodies to the indicated proteins. G and H, EB-1 cells were transfected with 1.8 μg of p53 luciferase construct (G) or 0.9 μg each of TOP Flash and FOP Flash constructs and 0.2 μg of pSVβgal for 24 h. 24 h later, cells were treated with indicated concentrations of ZnCl2 for 12 h, and then cells were harvested, and luciferase activity was measured. Luciferase activity was normalized to β-galactosidase activity. I, cells were treated with the indicated concentrations of ZnCl2 for 12 h. Cell lysates were subjected to Western blotting, and the blots were probed as indicated. A, C, E, G, and H, mean ± S.D. (error bars) are shown, n = 6. *, p < 0.01 compared with control siRNA-treated cells (A, C, and E) or vehicle-treated cells (G and H).
FIGURE 2.
FIGURE 2.
CP-31398 inhibits Wnt signaling. A, C, and E, HCT-15 (A), LoVo (C), and DLD-1 (E) cells were transfected with 1.8 μg of p53 luciferase construct and 0.2 μg of pSVβgal. 24 h later, the cells were treated with the indicated concentrations of CP-31398 for 24 h, and then luciferase activity was measured. Luciferase activity was normalized to β-galactosidase activity. B, D, and F, HCT-15 (B), LoVo (D), and DLD-1 (F) cells were treated with CP-313198 for 24 h, and cell lysates were harvested for Western blot analysis. Immunoblots were probed with antibodies as indicated. A, C, E, mean ± S.D. (error bars) are shown, n = 6. *, p < 0.01 compared with vehicle-treated cells.
FIGURE 3.
FIGURE 3.
p53 is a determinant of Hsp90 ATPase activity. A–C, cells were transfected with 2 μg of p53 siRNA or GFP (control) siRNA for 48 h. Cells were then harvested. D, EB-1 cells were treated with the indicated concentrations of ZnCl2 for 12 h prior to being harvested. E and F, cells were treated with CP-31398 as indicated for 24 h before being harvested. A–F, cell lysates were used to measure Hsp90 ATPase activity using the method described under “Experimental Procedures.” Mean ± S.D. (error bars) are shown, n = 6. *, p < 0.01 compared with control siRNA-treated cells (A–C) or vehicle-treated cells (D–F). Cell lysates were also subjected to Western blotting, and the blots were probed as indicated in the insets.
FIGURE 4.
FIGURE 4.
p53 regulates Aha1 expression. A–C and K–M, cells were treated with indicated concentrations of CP-31398 for 24 h. D, EB-1 cells were treated with the indicated concentrations of ZnCl2 for 12 h. E–J, cells were transfected with 2 μg of p53 siRNA or control siRNA for 48 h. A–M, cells were harvested, and cell lysates were subjected to immunoblotting and probed as indicated.
FIGURE 5.
FIGURE 5.
Aha1 is a determinant of Hsp90 ATPase activity. A and B, HCT-15 (A) and EB-1 (B) cells were transfected with 2 μg of Aha1 or control siRNA for 48 h. Hsp90 ATPase activity was then measured as described under “Experimental Procedures.” Mean ± S.D. (error bars) are shown, n = 6. *, p < 0.01 compared with control siRNA-treated cells. Cell lysates were also subjected to Western blotting and the lysates probed as indicated (see insets). C and D, cells were transfected with 2 μg of p53 siRNA or control siRNA for 48 h. E, cells were treated with 15 μm CP-31398 for 24 h. F, EB-1 cells were treated with 75 μm ZnCl2 for 12 h. C–F, cells were lysed, and Hsp90 was immunoprecipitated (IP). Immunoprecipitates were subjected to immunoblotting (WB), and the blots were probed as indicated. G and H, cells were transfected with 2 μg of Aha1 siRNA or control siRNA for 48 h. Cell lysate were subjected to Western blotting and the blots probed as indicated.
FIGURE 6.
FIGURE 6.
HSF-1 is important for p53-mediated regulation of Aha1. A–C, the indicated cells were transfected with 0.9 μg of Aha1 promoter luciferase construct and 0.2 μg of pSVβgal. Cells also received 0.9 μg of siRNA to GFP (control siRNA) or p53. 48 h after transfection, cells were harvested, and luciferase activity was measured. Luciferase activity was normalized to β-galactosidase activity. D and E, EB-1 cells were transfected with 1.8 μg of Aha1 promoter luciferase construct and 0.2 μg of pSVβgal. Subsequently, the cells were treated with the indicated concentrations of ZnCl2 for 12 h (D) or with 100 μm ZnCl2 (E) for the indicated time period. Cells were harvested, and luciferase activity was measured. Luciferase activity was normalized to β-galactosidase activity. F, schematic represents Aha1 promoter deletion constructs that were used. HBE, represents the HSF-1-binding element. G and H, HCT-15 cells were transfected with 0.9 μg of Aha1 promoter deletion luciferase constructs as indicated and 0.2 μg of pSVβgal. Cells also received 0.9 μg of siRNA to GFP (control siRNA) or p53. 48 h after transfection, cells were harvested, and luciferase activity was measured. Luciferase activity was normalized to β-galactosidase activity. I and J, EB-1 cells were transfected with the 1.8 μg of the indicated Aha1 promoter luciferase constructs and 0.2 μg of pSVβgal. Subsequently, cells were treated with 100 μm ZnCl2 for 12 h, and luciferase activity was measured. Luciferase activity was normalized to β-galactosidase activity. A–C, G, and H, mean ± S.D. (error bars) are shown, n = 6. *, p < 0.01 compared with control siRNA-treated cells. D, E, I, and J, mean ± S.D. (error bars) are shown, n = 6. *, p < 0.01 compared with vehicle (control)-treated cells.
FIGURE 7.
FIGURE 7.
Wnt target gene expression is regulated by HSF-1. A, EB-1 cells were treated with 75 μm ZnCl2 for 4 h. B, HCT-15 cells were transfected with 2 μg of siRNA to GFP (control) or p53 for 48 h. A and B, ChIP assays were performed. Chromatin fragments were immunoprecipitated with antibodies against HSF-1, and the Aha1 promoter was amplified by real-time PCR. DNA sequencing was carried out, and the PCR products were confirmed to be the Aha1 promoter. This promoter was not detected when normal IgG was used or when antibody was omitted from the immunoprecipitation step. Columns, means (n = 6); error bars, S.D. *, p < 0.01. C–F, cells were transfected with 2 μg of siRNA to GFP (control) or HSF-1 for 48 h. C, cell lysates were subjected to Western blotting, and the blots were probed as indicated. D and E, Hsp90 ATPase activity was measured. Cell lysates were also subjected to Western blotting and the blots probed as indicated (insets). Mean ± S.D. (error bars) are shown, n = 6. *, p < 0.01 compared with control siRNA-treated cells. F, cell lysates were subjected to Western blotting and the blots probed as indicated.
FIGURE 8.
FIGURE 8.
p53 regulates Akt and GSK3β phosphorylation via effects on Aha1 and Hsp90. A and B, cells were treated with LY294002 as indicated for 24 h. C and H, EB-1 cells were treated with indicated concentrations of ZnCl2 for 6 h. D, cells were transfected with 2 μg of Aha1 siRNA or control siRNA for 48 h. E, cells were treated with the indicated concentrations of 17-AAG for 0.5 h. F, cells were transfected with 2 μg of control siRNA or Akt1 siRNA for 48 h. G, cells were transfected with 2 μg of control siRNA or p53 siRNA for 48 h. I, cells were treated with indicated concentration of CP-31398 for 6 h. J, cells were transfected with 2 μg of control siRNA or Aha1 siRNA for 48 h. K, cells were treated as indicated with 1.0 μm 17-AAG for 0.5 h. A–K, cell lysates were subjected to Western blot analysis. The blots were probed as indicated. L, p53 regulates Aha1 levels leading to altered Hsp90 ATPase activity. This results in modulation of the Akt/GSK3β signaling axis and thereby the expression of Wnt target genes.
FIGURE 9.
FIGURE 9.
Wnt signaling is activated in p53-null mice. Colon tissue from p53 wild type and p53-null mice was used. Poly(A) RNA was isolated from total RNA extracted from colon tissues. Additionally, tissues were homogenized, and protein lysates were prepared. A, tissue lysates were used to measure Hsp90 ATPase activity using a protocol described under “Experimental Procedures.” Mean ± S.D. (error bars) are shown, n = 6. *, p < 0.01 compared with p53+/+ mice. Lysates were also subjected to immunoprecipitation with Hsp90 or β-actin antibodies; Western blotting was carried out, and the blot was probed for Hsp90 and β-actin as indicated. B, relative expression of Aha1 was quantified by real-time PCR. Values were normalized to levels of β-actin. Mean ± S.D. are shown, n = 6. *, p < 0.01 compared with p53+/+ mice. Tissue lysates were also immunoprecipitated with Aha1 or β-actin antibody; Western blotting was carried out, and the blots were probed for Aha1 and β-actin as indicated. C, tissue lysates were immunoprecipitated (IP) with Hsp90 antibody, and the immunoprecipitates were subjected to Western blotting (WB) for Aha1 and Hsp90 as indicated. D and E, tissue lysates were immunoprecipitated with antibodies to Akt (D) or GSK3β (E), and the blots were probed for pAkt and Akt (D) or pGSK3β and GSK3β (E) as indicated. F–H, tissue lysates were immunoprecipitated with Axin-2, c-Myc, Naked-1, or β-actin antibodies, and the blots were probed with the same antibodies.
FIGURE 10.
FIGURE 10.
Wnt signaling is activated in cells derived from in Li-Fraumeni syndrome patients. LFS epithelial cells (HME50, IUSM/LFS/HME) and wild type epithelial cells (HME32) were compared. A, cell lysates were prepared, and Hsp90 ATPase activity was measured as described under “Experimental Procedures.” Mean ± S.D. (error bars) are shown, n = 6. *, p < 0.01 compared with HME32 cells. Upper panel, cell lysates were subjected to immunoblotting, and the blot was probed for Hsp90 and β-actin. B, cell lysates were subjected to immunoblotting and probed for Aha1 or β-actin. C, cell lysates were immunoprecipitated with Hsp90 antibody, and the blot was probed for Aha1 and Hsp90 as indicated. D and E, cell lysates were subjected to immunoblotting and the blots probed as indicated. F and G, cell lysates were subjected to Western blotting and probed as indicated.

Comment in

  • Findings of Research Misconduct.
    [No authors listed] [No authors listed] Fed Regist. 2023 Sep 13;88(176):62800-62803. Fed Regist. 2023. PMID: 37736072 Free PMC article. No abstract available.
  • Findings of Research Misconduct.
    [No authors listed] [No authors listed] Fed Regist. 2023 Sep 13;88(176):62803-62807. Fed Regist. 2023. PMID: 37736073 Free PMC article. No abstract available.

Similar articles

Cited by

References

    1. Schneikert J., Behrens J. (2007) The canonical Wnt signalling pathway and its APC partner in colon cancer development. Gut 56, 417–425 - PMC - PubMed
    1. Polakis P. (2000) Wnt signaling and cancer. Genes Dev. 14, 1837–1851 - PubMed
    1. Bienz M., Clevers H. (2000) Linking colorectal cancer to Wnt signaling. Cell 103, 311–320 - PubMed
    1. Kinzler K. W., Vogelstein B. (1996) Lessons from hereditary colorectal cancer. Cell 87, 159–170 - PubMed
    1. Mikels A. J., Nusse R. (2006) Wnts as ligands: processing, secretion and reception. Oncogene 25, 7461–7468 - PubMed

Publication types

MeSH terms