. 2014 Mar 14;289(11):7275-92.
doi: 10.1074/jbc.M113.533786. Epub 2014 Jan 22.

In situ dimerization of multiple wild type and mutant zinc transporters in live cells using bimolecular fluorescence complementation

Affiliations

In situ dimerization of multiple wild type and mutant zinc transporters in live cells using bimolecular fluorescence complementation

Inbal Lasry et al. J Biol Chem. .

Abstract

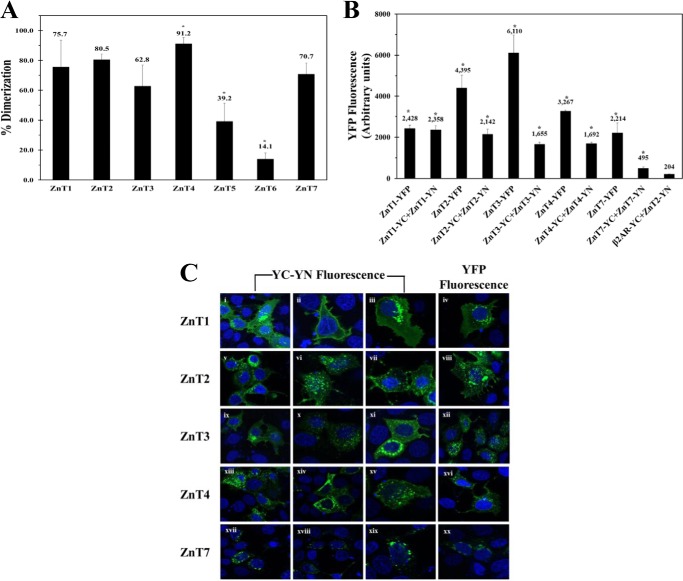
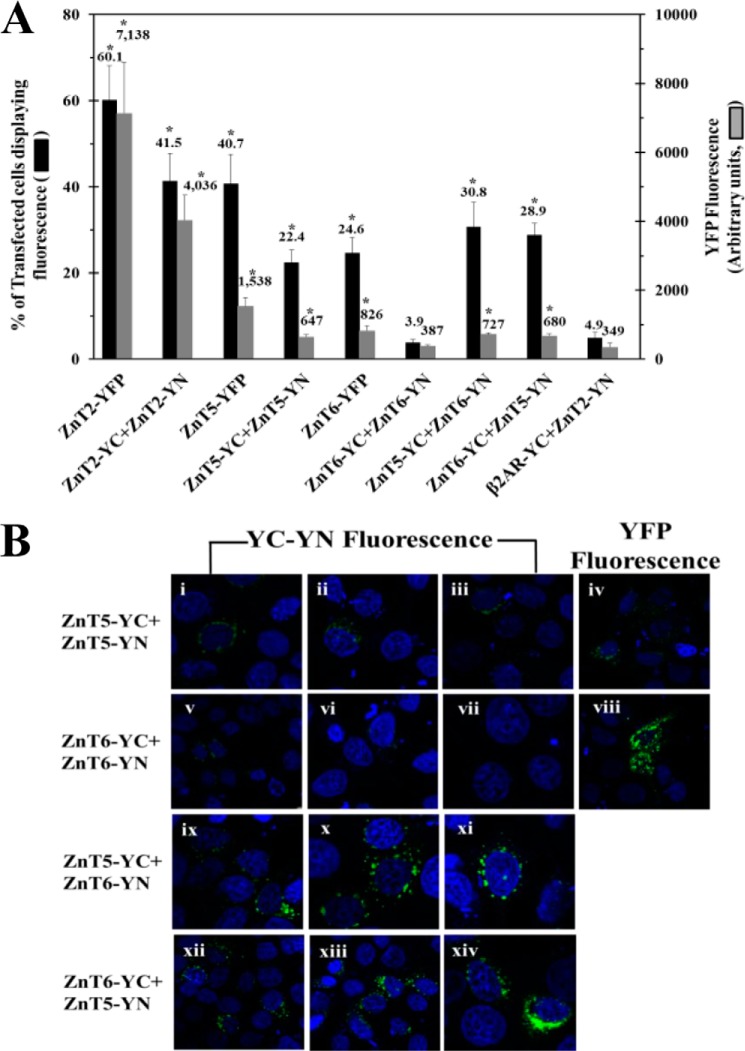
Zinc transporters (ZnTs) facilitate zinc efflux and zinc compartmentalization, thereby playing a key role in multiple physiological processes and pathological disorders, presumed to be modulated by transporter dimerization. We recently proposed that ZnT2 homodimerization is the underlying basis for the dominant negative effect of a novel heterozygous G87R mutation identified in women producing zinc-deficient milk. To provide direct visual evidence for the in situ dimerization and function of multiple normal and mutant ZnTs, we applied here the bimolecular fluorescence complementation (BiFC) technique, which enables direct visualization of specific protein-protein interactions. BiFC is based upon reconstitution of an intact fluorescent protein including YFP when its two complementary, non-fluorescent N- and C-terminal fragments (termed YN and YC) are brought together by a pair of specifically interacting proteins. Homodimerization of ZnT1, -2, -3, -4, and -7 was revealed by high subcellular fluorescence observed upon co-transfection of non-fluorescent ZnT-YC and ZnT-YN; this homodimer fluorescence localized in the characteristic compartments of each ZnT. The validity of the BiFC assay in ZnT dimerization was further corroborated when high fluorescence was obtained upon co-transfection of ZnT5-YC and ZnT6-YN, which are known to form heterodimers. We further show that BiFC recapitulated the pathogenic role that ZnT mutations play in transient neonatal zinc deficiency. Zinquin, a fluorescent zinc probe applied along with BiFC, revealed the in situ functionality of ZnT dimers. Hence, the current BiFC-Zinquin technique provides the first in situ evidence for the dimerization and function of wild type and mutant ZnTs in live cells.

Keywords: Metal Homeostasis; Mutant; Protein-Protein Interactions; Transport Metals; Zinc.


Figures

FIGURE 1.
FIGURE 1.
Endogenous expression of ZnT1–7 in MCF-7 cells. RNA was purified from MCF-7 cells and reverse transcribed into cDNA. RT-PCR was performed using primers targeted to the ORFs of ZnT1–7. PCR products were resolved on 2% agarose gel, and a marker of 100 bp was used in order to evaluate the size of the PCR products. Blank sample (cDNA-free reaction) of each primer is shown beside the reaction containing cDNA. Shown is a representative gel of three independent experiments.
FIGURE 2.
FIGURE 2.
Western blot analysis of ZnT2 expression in various transfectants. MCF-7 cells were transiently transfected with equal amounts of either ZnT2-YC, ZnT2-YN, or ZnT2-YFP expression plasmids. In addition, cells were co-transfected with equal amounts of both ZnT2-YC and ZnT2-YN plasmid DNA. Western blot analysis was performed after SDS-PAGE under denaturing conditions using an anti-ZnT2 antibody (A). Equal protein loading (40 μg) was verified using an antibody directed to the α subunit of Na+/K+ ATPase (B). The asterisk shown in the second lane on the left represents the putative complex of ZnT2-YC and ZnT2-YN with a molecular mass of ∼110 kDa.
FIGURE 3.
FIGURE 3.
ZnT1–4 and ZnT7 form homodimers based on the BiFC analysis. A, MCF-7 cells were transiently co-transfected with YC- and YN-tagged ZnT1–7 independently. MCF-7 cells were also transiently transfected with YFP-tagged ZnT1–7 in order to take protein expression levels into consideration. The percentage of dimerization was evaluated using flow cytometry and represents the fraction of YC-YN ZnT-positive cells divided by the fraction of ZnT-YFP-positive cells. The negative control (co-transfection of ZnT2-YC and β2AR-YN) resulted in 5.0 ± 1.3% of cells displaying BiFC fluorescence (not shown due to the inability to calculate the percentage of dimerization for this negative control). *, values shown are significantly different (p < 0.05) when compared with ZnT2-YC-YN. B, the mean YFP BiFC fluorescence of MCF-7 cells transiently transfected with ZnT-YC-YN or ZnT-YFP was examined using flow cytometry. *, values obtained are significantly higher (p < 0.05) when compared with co-transfection of ZnT2-YC and β2AR-YN. C, MCF-7 cells were transiently co-transfected with ZnT1-YC and ZnT1-YN (i–iii), ZnT2-YC and ZnT2-YN (v–vii), ZnT3-YC and ZnT3-YN (ix–xi), ZnT4-YC and ZnT4-YN (xiii–xv), and ZnT7-YC and ZnT7-YN (xvii–xix). Additionally, cells were transiently transfected with ZnT1-YFP through ZnT7-YFP (iv, viii, xii, xvi, and xx, respectively). The green YFP fluorescence signal indicates dimer formation (YC-YN fluorescence). Hoechst 33342 (blue fluorescence) was used to stain nuclei. Error bars shown in A and B represent S.D.
FIGURE 4.
FIGURE 4.
Establishment of BiFC as a novel dissection tool for the analysis of ZnT dimerization of various ZnTs. A, MCF-7 cells were transiently co-transfected with ZnT2-YC-YN as a positive control for dimerization as well as with ZnT2-YC and β2AR-YN as a negative control. Co-transfection of ZnT5-YC-YN, ZnT6-YC-YN, ZnT5-YC with ZnT6YN as well as ZnT6-YN with ZnT5-YC was performed in order to evaluate ZnT5-ZnT6 heterodimerization using BiFC analysis. Transfection of ZnT2-YFP, ZnT5-YFP, and ZnT6-YFP was also performed in order to take ectopic protein expression into consideration. Cells were analyzed using a flow cytometer for the percentage of cells showing YFP fluorescence as well as for mean YFP fluorescence. In this case, the percentage of dimerization cannot be calculated due to heterodimerization between two different proteins (i.e. ZnT5 and ZnT6). *, values obtained are significantly higher (p < 0.05) when compared with co-transfection of ZnT2-YC and β2AR-YN. B, MCF-7 cells were transiently co-transfected with ZnT5-YC and ZnT5-YN (i–iii), ZnT6-YC and ZnT6-YN (v–vii), ZnT5-YC and ZnT6-YN (ix–xi), and ZnT6-YC and ZnT5-YN (xii–xiv) or transfected with either ZnT5-YFP (iv) or ZnT6-YFP (viii). Green YFP fluorescence signal indicates dimer formation (YC-YN fluorescence). Hoechst 33342 (blue fluorescence) was used to stain nuclei. Error bars shown in A represent S.D.
FIGURE 5.
FIGURE 5.
Putative transmembrane topology of ZnT2 and localization of mutations associated with TNZD. ZnT2 is predicted to have six transmembrane domains with cytoplasmic N- and C-terminal regions. Gray circles indicate the location of the mutations Gly-87, Trp-152, and Ser-296, which were identified in mothers producing zinc-deficient milk, the infants of whom harbored TNZD.
FIGURE 6.
FIGURE 6.
Three-dimensional model of ZnT2 and localization of ZnT2 mutations associated with TNZD. A, i, ribbon representation of the three-dimensional ZnT2 model. The two monomers are colored in sky blue and tan. The mutation positions in each monomer are shown in a CPK representation and colored in dodger blue and orange red. ii, 90º rotation in the y axis of the ZnT2 model. According to our three-dimensional model, the Trp-152 is at the center of the monomer-monomer interface in the transmembrane domain, Gly-87 faces the phospholipid membrane core, and Ser-296 faces the solvent in the cytoplasmic C-terminal domain. B, the homodimer model is shown in a CPK representation and color-coded by the hydrophobicity scale of Kyte and Doolittle. The model is colored from blue (highly hydrophilic) to red (highly hydrophobic) amino acids. The approximate transmembrane domain limits are marked by two parallel horizontal black lines. The insets show a zoom into the location of each mutation. Trp-152 is boxed by a green square, Gly-87 is boxed by a white square, and Ser-296 is boxed by a yellow square.
FIGURE 7.
FIGURE 7.
Vesicular Zinquin accumulation and cell viability was evaluated as a function of increasing extracellular ZnSO4 concentrations. Untransfected MCF-7 cells (solid line with filled circles) or MCF-7 cells co-transfected with ZnT2-YC-YN (hatched line with triangles) were incubated in RPMI 1640 growth medium containing increasing concentrations of ZnSO4 (0.1–100 μm) for 2 h. Then, cells were incubated with the fluorescent zinc probe, Zinquin ethyl ester (40 μm), for 1 h and examined by flow cytometry for the following parameters: the percentage of cells showing Zinquin fluorescence (A); mean Zinquin fluorescence per cell (B) (one representative experiment is presented); and the percentage of cells showing PI staining (see “Experimental Procedures” for details) (C), determined in order to assess the fraction of dead cells. For A and C, asterisks indicate that the values obtained are significantly different when compared with untransfected cells (p < 0.05). Error bars shown in A, B, and C represent S.D.
FIGURE 8.
FIGURE 8.
Characterization of the G87R mutant ZnT2 using BiFC analysis and vesicular Zinquin accumulation. A, MCF-7 cells were transiently transfected with WT and mutant ZnT2 and examined for dimerization formation as well as for vesicular Zinquin accumulation. Cells were transfected with YFP empty vector (i–iii) as a negative control as well as with ZnT2-YFP (iv–vi) or with ZnT2-YC-YN (vii–ix) as a positive control. Cells were also transfected with half of the total amount of WT ZnT2-YC-YN plasmid DNA (x–xii) along with YC empty vector. In order to examine the putative dominant negative effect of TNZD ZnT2 mutations, MCF-7 cells were further transfected with G87R ZnT2-YFP (xiii–xv), as well as with G87R ZnT2-YC-YN (xvi–xviii) or with G87R ZnT2-YC and WT ZnT2-YN (xix–xxi). YFP (green fluorescence) indicates homodimer formation. RedDot (red fluorescence) was used to stain nuclei. Zinquin (blue fluorescence) accumulation in live cells was visualized after incubating transfected cells with the fluorescent zinc probe, Zinquin ethyl ester (40 μm), for 1 h (blue fluorescence). B, MCF-7 cells transfected with the constructs described along the x axis, were examined for the percentage of cells showing YFP fluorescence (dark bars) as well as for mean YFP fluorescence (gray bars) using flow cytometry. C, MCF-7 cells transfected with the constructs described along the x axis were examined for the percentage of transfected cells displaying Zinquin fluorescence (dark bars) as well as for Zinquin fluorescence levels (gray bars). The percentage of transfected cells displaying Zinquin fluorescence was calculated by dividing the fraction of YFP fluorescent cells (YC-YN or YFP) displaying Zinquin fluorescence by the total fraction of cells displaying YFP fluorescence (YC-YN or YFP). For B and C, asterisks indicate that the values obtained are significantly different (p < 0.05) when compared with ZnT2-YC-YN (p < 0.05). Error bars shown in B and C represent S.D.
FIGURE 9.
FIGURE 9.
Characterization of S296L and W152R ZnT2 mutants using BiFC analysis and Zinquin accumulation. A, the impact of the compound mutations S296L and W152R was further examined as follows; cells were transfected with WT ZnT2-YC-YN (i–iii), S296L-YFP (iv–vi), S296L-YC and S296L-YN (vii–ix), and S296L-YC and WT ZnT2-YN (x–xii). In addition, cells were transfected with W152R ZnT2-YFP (xiii–xv), W152R ZnT2-YC and W152R ZnT2-YN (xvi–xviii), W152R ZnT2-YC and WT ZnT2-YN (xix–xxi), and both W152R ZnT2-YC and S296L ZnT2-YN (xxii–xxiv). Cells were examined as described in the legend to Fig. 8A. B, MCF-7 cells transfected with the constructs described along the x axis were examined for the same parameters indicated in the legend to Fig. 8B. C, MCF-7 cells transfected with the constructs described along the x axis were examined for the same parameters indicated in the legend to Fig. 8C. For B and C, asterisks indicate that the values obtained are significantly different (p < 0.05) when compared with ZnT2-YC-YN (p < 0.05). Error bars shown in B and C represent S.D.

Similar articles

Cited by

References

    1. Eide D. J. (2006) Zinc transporters and the cellular trafficking of zinc. Biochim. Biophys. Acta 1763, 711–722 - PubMed
    1. Palmiter R. D., Huang L. (2004) Efflux and compartmentalization of zinc by members of the SLC30 family of solute carriers. Pflugers Arch. 447, 744–751 - PubMed
    1. Huang L., Tepaamorndech S. (2013) The SLC30 family of zinc transporters. A review of current understanding of their biological and pathophysiological roles. Mol. Aspects Med. 34, 548–560 - PubMed
    1. Jeong J., Eide D. J. (2013) The SLC39 family of zinc transporters. Mol. Aspects Med. 34, 612–619 - PMC - PubMed
    1. Gustin J. L., Zanis M. J., Salt D. E. (2011) Structure and evolution of the plant cation diffusion facilitator family of ion transporters. BMC Evol. Biol. 11, 76. - PMC - PubMed

MeSH terms