. 2014:5:3078.
doi: 10.1038/ncomms4078.

The splicing activator DAZAP1 integrates splicing control into MEK/Erk-regulated cell proliferation and migration

Affiliations

The splicing activator DAZAP1 integrates splicing control into MEK/Erk-regulated cell proliferation and migration

Rajarshi Choudhury et al. Nat Commun. 2014.

Abstract

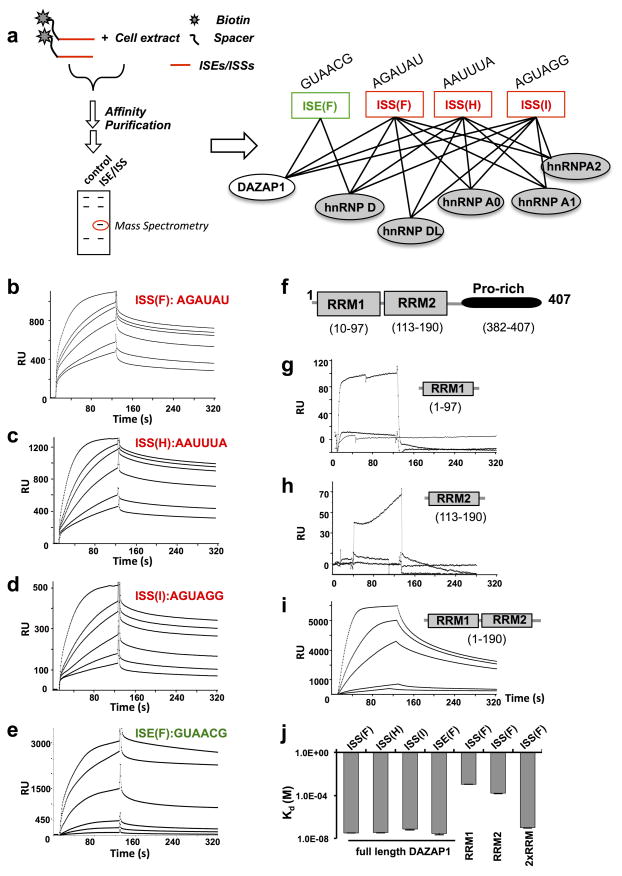
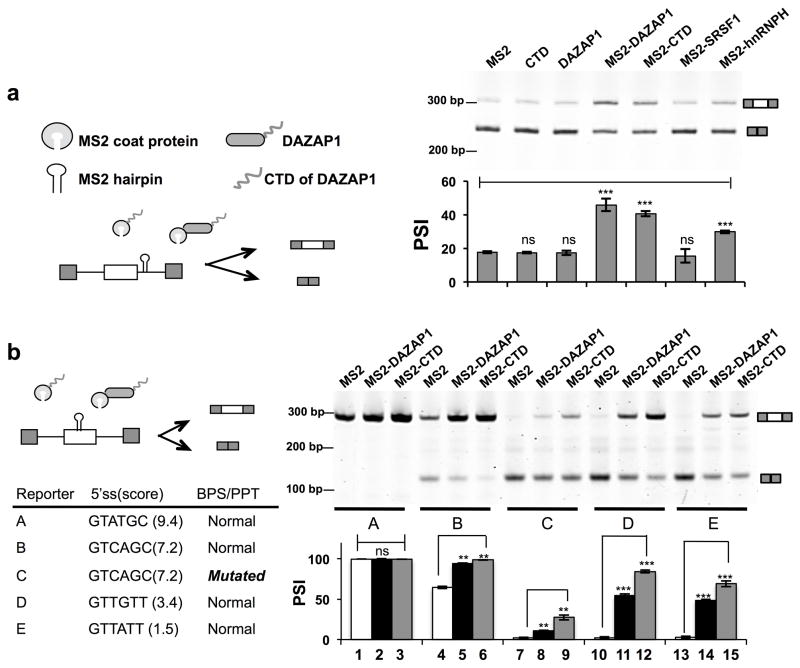
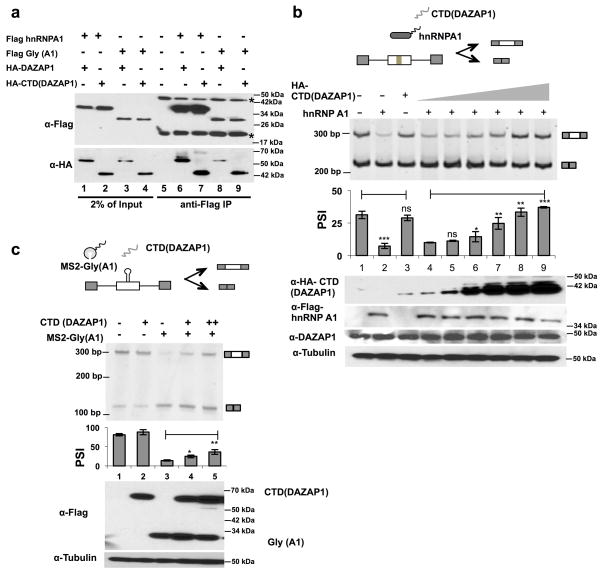
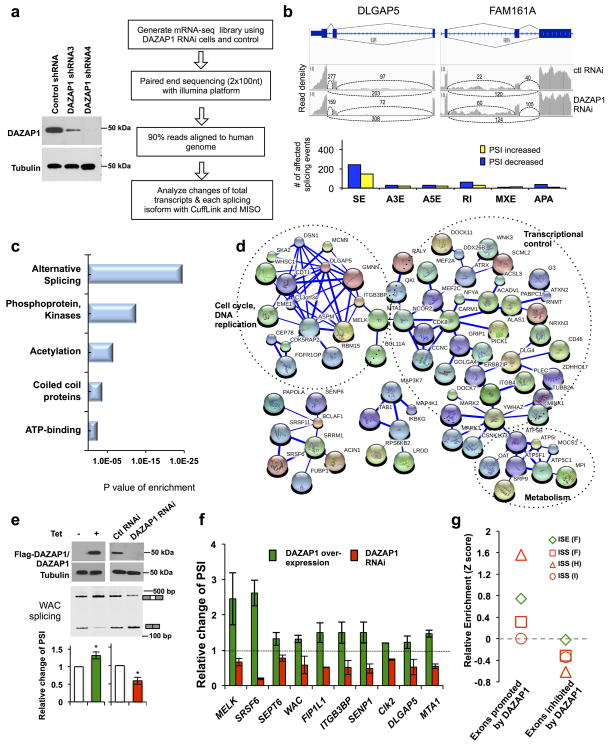
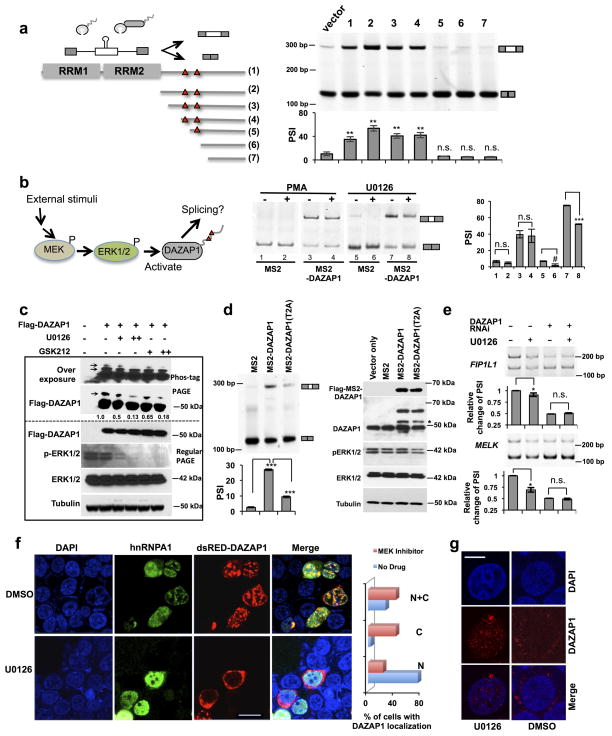
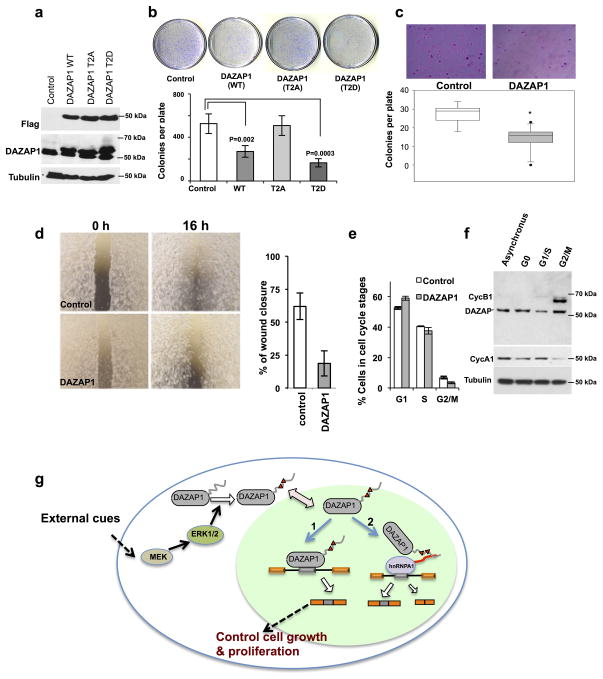
Alternative splicing of pre-messenger RNA (mRNA) is a critical stage of gene regulation in response to environmental stimuli. Here we show that DAZAP1, an RNA-binding protein involved in mammalian development and spermatogenesis, promotes inclusion of weak exons through specific recognition of diverse cis-elements. The carboxy-terminal proline-rich domain of DAZAP1 interacts with and neutralizes general splicing inhibitors, and is sufficient to activate splicing when recruited to pre-mRNA. This domain is phosphorylated by the MEK/Erk (extracellular signal-regulated protein kinase) pathway and this modification is essential for the splicing regulatory activity and the nuclear/cytoplasmic translocation of DAZAP1. Using mRNA-seq, we identify endogenous splicing events regulated by DAZAP1, many of which are involved in maintaining cell growth. Knockdown or over-expression of DAZAP1 causes a cell proliferation defect. Taken together, these studies reveal a molecular mechanism that integrates splicing control into MEK/Erk-regulated cell proliferation.


Conflict of interest statement

Conflict of interest statement

The authors declare that they have no conflict of interest.

Figures

Figure 1
Figure 1. DAZAP1 specifically interact with multiple RNA motifs
(a). Schematic diagram of RNA-protein interactions identified by affinity chromatography. The binding of different intronic SREs (ISSs or ISEs) by DAZAP1 and other hnRNPs were presented by an overlapping network. The ISE was colored green whereas ISSs were represented in red. The representative sequence in each motif was also shown. (b–e). Full-length DAZAP1 protein interacts with four different RNA sequences as indicated above each figure. The RNA-protein interactions were measured by SPR assay using purified protein and in vitro synthesized RNA oligos representing consensus motifs of each group. From bottom to top, the DAZAP1 concentrations were 200 nM, 300 nM, 600 nM, 1μM, 1.5 μM and 3 μM for panels b–d, and 60 nM, 100 nM 200 nM, 500 nM, 1μM and 1.5 μM for panel e. (f) A diagram of DAZAP1, the two RRM domains and the proline-rich C-terminal domain were shown. The recombinant proteins containing RRM domains only were constructed according to the domain annotation. (g–i) The binding of different DAZAP1 fragments (RRM1, RRM2 and both RRMs) to the cognate RNA target (ISS group F). The experimental conditions were similar to panel b except the protein concentrations were 1 to 5 μM for panel g and h and 50–1000 nM for panel i from bottom to top. (j) The bindings between different protein-RNA pairs were presented as apparent disassociation constant (Kd). All experiments were repeated three times unless indicated otherwise and error bars indicate s.d. of mean.
Figure 2
Figure 2. Interaction of DAZAP1 with other hnRNPs
(a) Protein-protein interaction of full length DAZAP1 with other hnRNPs as measured by isothermal calorimetry (ITC) assay. All recombinant proteins were purified to homogeneity, and the DAZAP1 was titrated to purified full-length hnRNPA0, A1, A2 or hnRNP D in ITC reaction cells. Binding constants (Kd) and number of binding sites (N) were determined using by fitting the ITC data to Langmuir model. The means and ranges from two independent experiments were shown. (b) Interaction of DAZAP1 CTD with other hnRNPs as measured by ITC assay. Experimental conditions were identical to panel a. (c) Lack of interaction between DAZAP1 N-terminal fragment 2xRRMs with other hnRNPs as measured by ITC assay. Experimental conditions were identical to panel a.
Figure 3
Figure 3. DAZAP1 promotes splicing in exonic or intronic contexts via its CTD
(a) Schematic diagram of tethering experiments using different MS2-DAZAP1 fusion proteins and a splicing reporter (pZW2C) containing MS2 hairpin RNA in introns . The full length or CTD of DAZAP1 protein could promote splicing when tethered to introns. The MS2 only, CTD, and DAZAP1 alone were used as negative controls. As additional controls, two canonical splicing factors, SRSF1 and hnRNP H, were also expressed as MS2 fusion proteins. All experiments were repeated at least three times. The exon inclusion was detected by semi-quantitative RT-PCR and quantified as PSI values (percent-spliced-in). The plot of mean and s.d. was shown below a representative gel. P values were determined using t-test comparing to the MS2 control. (b) Schematic diagram of tethering experiments using a series of splicing reporters with various splice site strengths and an exonic MS2 site . The full length or CTD of DAZAP1 fused with MS2 coat protein were shown to promote splicing for constructs B to E. All experiments were repeated three times, and a plot of mean PSI and s.d. was shown below a representative gel. In all panels, **= p ≤ 0.002 ; *** = p ≤ 0.001; ns= not significant (t-test).
Figure 4
Figure 4. DAZAP1 binds and antagonizes hnRNPA1 in splicing regulation
(a) In vivo interaction of DAZAP1 and hnRNP A1 as judged by co-immunoprecipitation experiments. The Flag tagged hnRNP A1 (or Gly-rich domain of A1) and HA tagged DAZAP1 (or its CTD) were co-expressed and pulled down using anti-Flag beads. The input and the precipitates were probed with western blots. Asterisks indicate the heavy and light chains of IgG. (b) The modular splicing reporter inserted with specific binding site of hnRNP A1 and DAZAP1 (ISS group F) in an alternative exon was co-transfected with expression vectors of hnRNP A1 and CTD of DAZAP1 in different ratios, and the exon inclusion was detected by semi-quantitative RT-PCR and quantified. Expression vector alone was used as control (lane 1). The experiments were repeated at least three times, and the mean and s.d. was plotted below a representative gel. The protein levels were measured by western blots. P values were determined with paired t-test by comparing to lane 1 (sample 2 to 3) or 4 (sample 5 to 9). (c) The splicing reporter containing a MS2 tether site in test exon (construct B in Fig. 3b) was co-transfected with the MS2 fusion protein of Gly(hnRNP A1) and the CTD of DAZAP1 in different ratios. The MS2-Gly(A1) was tethered to the splicing reporter, and the DAZAP1 CTD alone was used as additional negative control. The experiments were repeated three times, and a plot of mean and s.d. was shown below a representative gel. The protein levels were measured by western blots. P values are determined with t-test by comparing lanes 4 and 5 to lane 3. In all panels, *= p ≤0.015; **= p ≤0.002 ; *** = p ≤0.0008; ns= not significant.
Figure 5
Figure 5. Identification of endogenous alternative splicing events controlled by DAZAP1
(a) The 293T cells stably transfected with shRNA to knock down DAZAP1 (left panel). The cells were subsequently used for mRNA-seq analyses as shown by schematic diagram in right panel. (b) Upper panel, two examples of alternative exons affected by DAZAP1 knockdown. The genes were chosen to show both the increase and decrease of exon inclusion, and the numbers of exon junction reads were indicated. Lower panel showed the numbers of different splicing events affected by DAZAP1 knockdown. SE, skipped exon; A3E, alternative 3′ splicing site exon; A5E, alternative 5′ splicing site exon; RI, retained intron; MXE, mutually exclusive exon; APA, alternative poly-A sites. (c) The gene ontology analyses of DAZAP1 targets with significant splicing changes after RNAi. The p values were plotted for each enriched functional category. (d) The functional association networks of DAZAP1 targets. Genes in the categories of phosphoproteins and acetylation from panel c were extracted and analyzed with STRING database, and the interaction networks containing more than five nodes were shown. The thickness of line indicates the confidence of interactions. The gene subgroups involved in cell cycle, metabolism and transcriptional control are marked. (e) Confirmation of splicing changes for one of the DAZAP1 targets (WAC) using semi-quantitative RT-PCR in cells with over-expression or RNAi of DAZAP1. The relative changes of PSI compared to controls were calculated, and the mean and s.d. from triplicate experiments were plotted. P values are calculated with t-test. *, p≤0.03. (f) Validation of additional DAZAP1 targets using semi-quantitative RT-PCR in cells with over-expression or RNAi of DAZAP1. The experiments were repeated three times and the relative changes of PSI compared to controls were plotted with s.d. as error bars. For all samples, p ≤0.05 in the paired t-test by comparing PSI value of each gene to that in mock transfected controls (See Supplementary Fig. 6 for detail). (g) Relative enrichment of RNA motifs bound by DAZAP1. Relative enrichment scores were computed for each group in the skipped exons that were positively or negatively regulated by DAZAP1.
Figure 6
Figure 6. DAZAP1 is regulated by Erk1/2 catalyzed threonine phosphorylation in the CTD
(a). A series of truncated CTDs of DAZAP1 were tethered to the exon of a splicing reporter to test which regions are critical for its activity. The full length DAZAP1 was used as positive control, and the two Erk1/2 phosphorylation sites (Thr269 and Thr315) are marked by red triangle. The experimental conditions were identical to Fig. 3b. The mean PSI values and s.d. are shown below a representative gel. P values were determined with paired t-test by comparing to vector-only control. In all panels, #: p ≤0.05; *= p ≤0.01; **= p ≤0.002 ; *** = p ≤0.0008; ns= not significant. (b) A schematic model showing that DAZAP1 activity is mediated by MEK/Erk pathway (left panel). The tethering experiments similar to panel a were conducted in cells treated with MEK/Erk activator (PMA) or inhibitor (U0126). (c). Phosphorylation of DAZAP1 was inhibited by two specific MEK inhibitors as judged by western blot with Phos-tag labeling. The phosphorylated forms of DAZAP1 were indicated with arrows. (d) Mutation of the two DAZAP1 threonine sites phosphorylated by Erk1/2 abolished DAZAP1 activity as judged by tethering experiments. The experiments were conducted in triplicates and the mean and s.d. of PSI values are plotted below a representative gel. The western blot was shown on the right to confirm equal expression between wild type and mutated DAZAP1. The band indicated by the asterisk is likely a degradation product of MS2-DAZAP1. (e) Inhibition of MEK/Erk by U0126 affected the splicing of endogenous DAZAP1 targets FIP1L1 and MELK. A representative gel from duplicated experiments and the relative changes of PSI were plotted with ranges as error bars. (f) Inhibition of MEK/Erk pathway affected nuclear/cytoplasmic translocation of DAZAP1. The cells were transfected with tagged DAZAP1 and hnRNP A1 and detected by corresponding antibodies. Bar, 5 μm. The percents of cells with DAZAP1 localized in nucleus (N), cytoplasm (C) or both compartments (N+C) were counted and plotted in the right panel (n=80 for each sample in two independent experiments). (g) Inhibition of MEK/Erk pathway affected nuclear/cytoplasmic translocation of endogenous DAZAP1. Scale bar, 2.5 μm.
Figure 7
Figure 7. DAZAP1 regulates cell proliferation
(a) Stable over-expression of DAZAP1 in non-small cell lung carcinoma NCI-H157 cells as detected by western blots. Control cells are stably transfected with vector only. (b) The expression of DAZAP1 inhibited cell proliferation as judged by colony formation assay with H157 cells. A representative picture from the triplicate experiments, the means and s.d. were plotted. (c) DAZAP1 inhibited the anchorage independent cell growth of H157 as judged by soft agar assays. A representative picture from the triplicates and the quantification were shown. The box plot was drawn using 25 and 75 quartiles in Sigma Plot with whiskers indicating max and min value and dots indicating outliers. P values were determined using paired t-test, *=p ≤ 5.0×10⁻⁵. (d) DAZAP1 inhibited cell migration as judged by wound healing assay. The picture of a representative plate (left panel) and the quantification of percent of gap closure were shown (right panel). Data from three independent assays were performed error bar indicate s.d. (e) The quantification of cell cycle stages (G1, S and G2/M phases) in DAZAP1 over-expressed or control cells. The cell cycle stages were analyzed by flow-cytometry measurement of DNA content. Data from two independent flow analysis, error bar indicate s.d. (f) Expression of endogenous DAZAP1 protein during cell cycle as detected by western blots. Tubulin and canonical cell cycle markers (cyclin A1 and B1) were also probed as controls. (g) An integrated model for DAZAP1 function and the regulation of its activity through the MEK/Erk pathway.

Similar articles

Cited by

References

    1. Nilsen TW, Graveley BR. Expansion of the eukaryotic proteome by alternative splicing. Nature. 2010;463:457–63. - PMC - PubMed
    1. Blencowe BJ. Alternative splicing: new insights from global analyses. Cell. 2006;126:37–47. - PubMed
    1. Wang ET, et al. Alternative isoform regulation in human tissue transcriptomes. Nature. 2008;456:470–6. - PMC - PubMed
    1. Pan Q, Shai O, Lee LJ, Frey BJ, Blencowe BJ. Deep surveying of alternative splicing complexity in the human transcriptome by high-throughput sequencing. Nat Genet. 2008;40:1413–5. - PubMed
    1. Wang Z, Burge CB. Splicing regulation: from a parts list of regulatory elements to an integrated splicing code. RNA. 2008;14:802–13. - PMC - PubMed

Publication types

MeSH terms

Substances

Associated data