The effects of pdr1, djr1.1 and pink1 loss in manganese-induced toxicity and the role of α-synuclein in C. elegans
- PMID: 24452053
- PMCID: PMC3954834
- DOI: 10.1039/c3mt00325f
The effects of pdr1, djr1.1 and pink1 loss in manganese-induced toxicity and the role of α-synuclein in C. elegans
Abstract
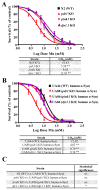
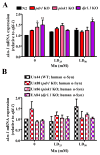
Parkinson's disease (PD) is a neurodegenerative brain disorder characterized by selective dopaminergic (DAergic) cell loss that results in overt motor and cognitive deficits. Current treatment options exist to combat PD symptomatology, but are unable to directly target its pathogenesis due to a lack of knowledge concerning its etiology. Several genes have been linked to PD, including three genes associated with an early-onset familial form: parkin, pink1 and dj1. All three genes are implicated in regulating oxidative stress pathways. Another hallmark of PD pathophysiology is Lewy body deposition, associated with the gain-of-function genetic risk factor α-synuclein. The function of α-synuclein is poorly understood, as it shows both neurotoxic and neuroprotective activities in PD. Using the genetically tractable invertebrate Caenorhabditis elegans (C. elegans) model system, the neurotoxic or neuroprotective role of α-synuclein upon acute Mn exposure in the background of mutated pdr1, pink1 or djr1.1 was examined. The pdr1 and djr1.1 mutants showed enhanced Mn accumulation and oxidative stress that was reduced by α-synuclein. Moreover, DAergic neurodegeneration, while unchanged with Mn exposure, returned to wild-type (WT) levels for pdr1, but not djr1.1 mutants expressing α-synuclein. Taken together, this study uncovers a novel, neuroprotective role for WT human α-synuclein in attenuating Mn-induced toxicity in the background of PD-associated genes, and further supports the role of extracellular dopamine in exacerbating Mn neurotoxicity.
Figures


Similar articles
-
α-synuclein expression from a single copy transgene increases sensitivity to stress and accelerates neuronal loss in genetic models of Parkinson's disease.Exp Neurol. 2018 Dec;310:58-69. doi: 10.1016/j.expneurol.2018.09.001. Epub 2018 Sep 5. Exp Neurol. 2018. PMID: 30194957 Free PMC article.
-
Age- and manganese-dependent modulation of dopaminergic phenotypes in a C. elegans DJ-1 genetic model of Parkinson's disease.Metallomics. 2015 Feb;7(2):289-98. doi: 10.1039/c4mt00292j. Metallomics. 2015. PMID: 25531510 Free PMC article.
-
Peiminine Reduces ARTS-Mediated Degradation of XIAP by Modulating the PINK1/Parkin Pathway to Ameliorate 6-Hydroxydopamine Toxicity and α-Synuclein Accumulation in Parkinson's Disease Models In Vivo and In Vitro.Int J Mol Sci. 2021 Sep 23;22(19):10240. doi: 10.3390/ijms221910240. Int J Mol Sci. 2021. PMID: 34638579 Free PMC article.
-
Caenorhabditis elegans as an experimental tool for the study of complex neurological diseases: Parkinson's disease, Alzheimer's disease and autism spectrum disorder.Invert Neurosci. 2011 Dec;11(2):73-83. doi: 10.1007/s10158-011-0126-1. Epub 2011 Nov 8. Invert Neurosci. 2011. PMID: 22068627 Review.
-
Impaired mitochondrial dynamics and function in the pathogenesis of Parkinson's disease.Exp Neurol. 2009 Aug;218(2):235-46. doi: 10.1016/j.expneurol.2009.03.006. Epub 2009 Mar 18. Exp Neurol. 2009. PMID: 19303005 Review.
Cited by
-
Untangling the Manganese-α-Synuclein Web.Front Neurosci. 2016 Aug 4;10:364. doi: 10.3389/fnins.2016.00364. eCollection 2016. Front Neurosci. 2016. PMID: 27540354 Free PMC article. Review.
-
Mass Surveilance of C. elegans-Smartphone-Based DIY Microscope and Machine-Learning-Based Approach for Worm Detection.Sensors (Basel). 2019 Mar 26;19(6):1468. doi: 10.3390/s19061468. Sensors (Basel). 2019. PMID: 30917520 Free PMC article.
-
Role of Caenorhabditis elegans AKT-1/2 and SGK-1 in Manganese Toxicity.Neurotox Res. 2018 Oct;34(3):584-596. doi: 10.1007/s12640-018-9915-1. Epub 2018 Jun 7. Neurotox Res. 2018. PMID: 29882004 Free PMC article.
-
A potential role for zinc in restless legs syndrome.Sleep. 2021 Apr 9;44(4):zsaa236. doi: 10.1093/sleep/zsaa236. Sleep. 2021. PMID: 33175142 Free PMC article.
-
Genetic Disorders Associated with Metal Metabolism.Cells. 2019 Dec 9;8(12):1598. doi: 10.3390/cells8121598. Cells. 2019. PMID: 31835360 Free PMC article. Review.
References
-
- ATSDR. Toxicological profile for manganese (Draft for Public Comment) U.S. Department of Health and Human Services, Public Service. 2008
-
- Zhang Y, Gao J, Chung KK, Huang H, Dawson VL, Dawson TM. Parkin functions as an E2-dependent ubiquitin- protein ligase and promotes the degradation of the synaptic vesicle-associated protein, CDCrel-1. Proceedings of the National Academy of Sciences of the United States of America. 2000;97:13354–9. doi: 10.1073/pnas.240347797. - DOI - PMC - PubMed
Publication types
MeSH terms
Substances
Grants and funding
LinkOut - more resources
Full Text Sources
Other Literature Sources
Medical
Research Materials

