. 2014 Jan 22;6(220):220ra11.
doi: 10.1126/scitranslmed.3008051.

Identifying gut microbe-host phenotype relationships using combinatorial communities in gnotobiotic mice

Affiliations

Identifying gut microbe-host phenotype relationships using combinatorial communities in gnotobiotic mice

Jeremiah J Faith et al. Sci Transl Med. .

Abstract

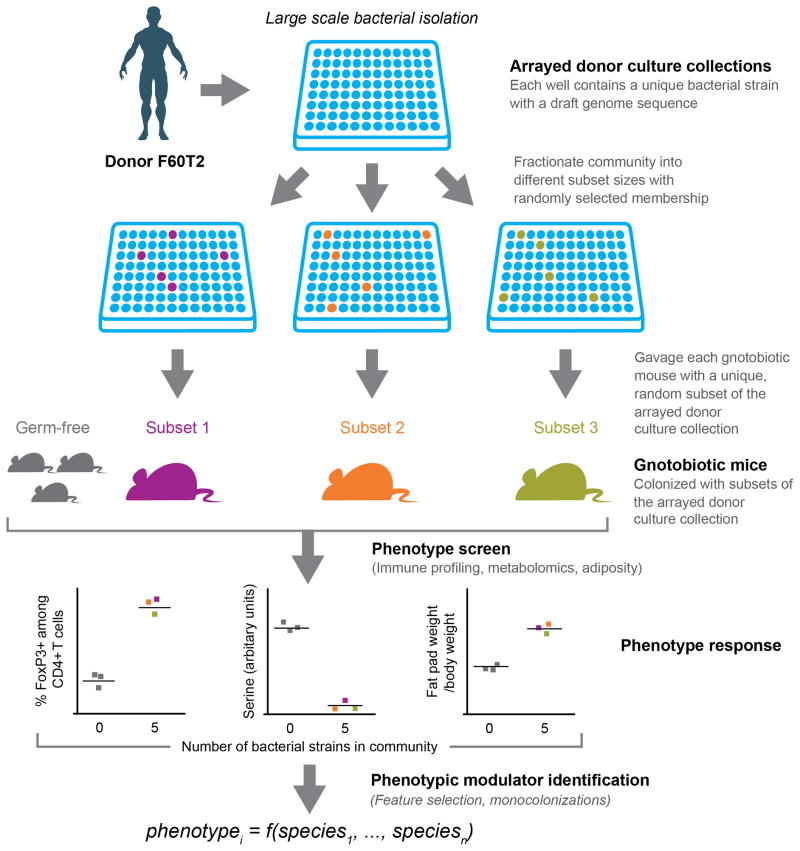
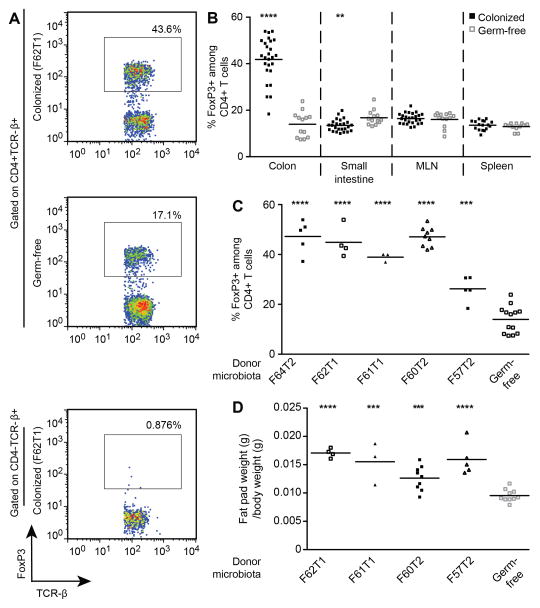
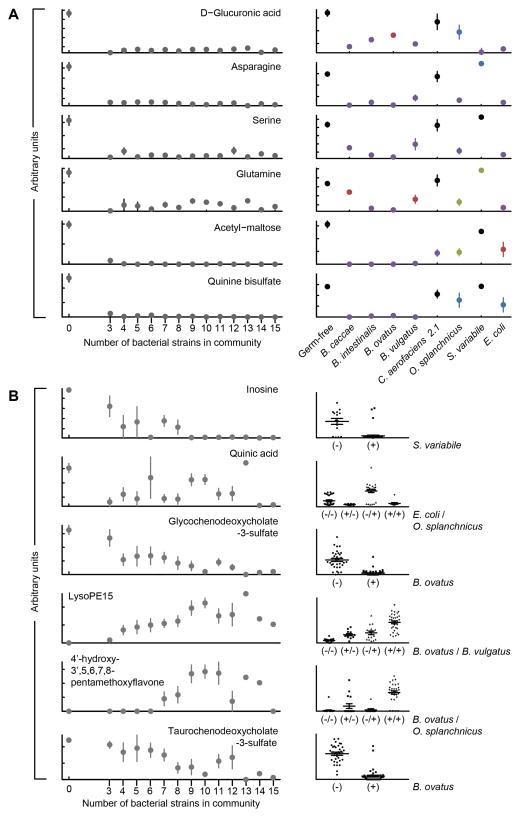
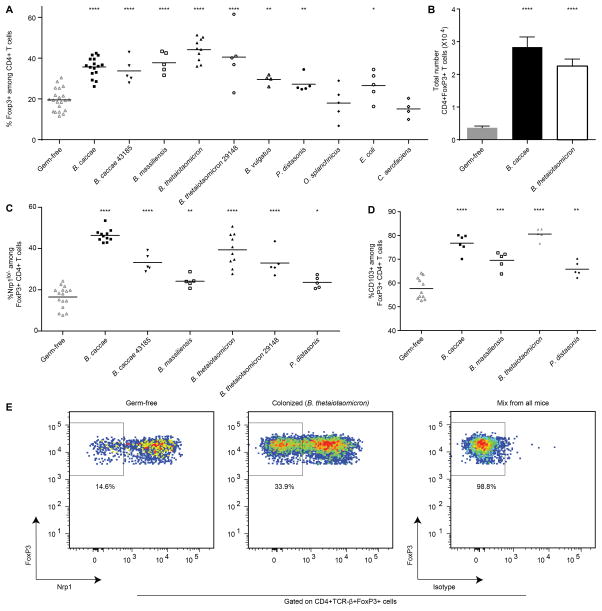
Identifying a scalable, unbiased method for discovering which members of the human gut microbiota influence specific physiologic, metabolic, and immunologic phenotypes remains a challenge. We describe a method in which a clonally arrayed collection of cultured, sequenced bacteria was generated from one of several human fecal microbiota samples found to transmit a particular phenotype to recipient germ-free mice. Ninety-four bacterial consortia of diverse size, randomly drawn from the culture collection, were introduced into germ-free animals. We identified an unanticipated range of bacterial strains that promoted accumulation of colonic regulatory T cells (T(regs)) and expansion of Nrp1(lo/-) peripheral T(regs), as well as strains that modulated mouse adiposity and cecal metabolite concentrations, using feature selection algorithms and follow-up monocolonizations. This combinatorial approach enables a systems-level understanding of microbial contributions to human biology.


Conflict of interest statement

Competing Interests

JIG is co-founder of Matatu, LLC, a company that is characterizing the role of diet-by-microbiota interactions in defining health. The other authors declare that they have no competing interests.

Figures

Fig. 1
Fig. 1. Overview of combinatorial ‘out-of-the-isolator’ gnotobiotics screen for identifying microbe-phenotype relationships
Bacterial culture collections are generated from an intact uncultured (human) gut microbiota sample whose transplantation into gnotobiotic mice has already been shown to alter the animal’s physiologic, metabolic, immunologic or other properties. Each strain in the culture collection is present in a separate well of a multi-well plate. The arrayed collection of sequenced bacterial strains is then fractioned into random subsets of various sizes [shown are subsets (consortia) of five strains]. Each subset is gavaged into an individual germ-free animal maintained in a separate filter-top gnotobiotic cage to observe the effect of the subset on phenotypes of interest. By repeating this process across many subsets, the effect of each strain in the arrayed culture collection is assayed in the context of a diverse background of community memberships and sizes. Feature selection algorithms (for non-saturated phenotypes) and follow-up mono-colonization experiments (for phenotypes saturating at small community sizes) are used to identify the strains whose presence or absence best explains the observed phenotypic variation.
Fig. 2
Fig. 2. Intact uncultured human fecal microbiota drives increases in colonic Tregs and adiposity in recipient gnotobiotic mice
Adult male germ-free C57BL/6J mice were gavaged with human fecal microbiota suspensions from one of five females living in the USA, or the mice were kept germ-free (see table S1 for donor metadata). Animals were fed a low-fat diet rich in plant polysaccharides. Two weeks after gavage, animals were sacrificed. Cells were prepared from the spleen, mesenteric lymph nodes plus small intestinal and colonic lamina propria (LP). FoxP3 expression was assessed in CD4+ T cells by intracellular flow cytometry. Epididymal fat pads were also harvested and weighed. (A) Representative flow cytometry plots showing FoxP3 expression in CD4+ T cells and CD4 T cells (staining control) isolated from the colonic lamina propria of mice containing a transplanted intact uncultured human fecal microbiota or CD4+ T cells from germ-free controls. The percentages shown represent frequency in the gate. (B) Frequency of FoxP3+ cells among CD4+ T cells in the indicated organs (data pooled from all recipient groups of mice, each harboring a transplanted microbiota from one of five donors, n=12–26 animals/group). (C) Frequency of FoxP3+ cells among colonic CD4+ T cells. Data are grouped according to the human microbiota donor rather than pooled (n=3–13 recipient mice/group). (D) Epididymal fat pat weight as a proportion of total body weight, measured at the time of sacrifice two weeks after gavage of the donor microbiota (n=3–10 recipient mice/group). Each point represents data from an individual mouse. Horizontal lines represent the mean. Statistical significance was determined using a two-tailed unpaired Student’s t-test. **, P<0.01; ***, P<0.001; ****, P<0.0001.
Fig. 3
Fig. 3. Bacterial strain-induced alterations in cecal metabolite concentrations
(A) Metabolites whose levels in the cecum saturate at small community sizes (≤3 strains). A zero on the x-axis refers to germ-free controls. Saturation at low consortia sizes indicates that multiple strains are capable of modulating the metabolite. Mono-colonization (right portion of the panel) directly establishes that specific bacterial strains can alter the level of a given metabolite. Significance of the values are color coded: blue, P<0.05; red, P<0.01; green, P<0.001; purple, P<0.0001 as judged by an unpaired two-tailed Student’s t-test. Shown are mean values ± SEM. These examples represent a subset of the small-community saturated metabolites with high confidence identifications. Data for additional metabolites are presented in table S4. (B) Metabolites with more diverse patterns of changes in their levels as a function of community size reveal cases where fewer community members modulate the metabolite and instances where saturation requires the cumulative influence of multiple bacterial strains. For these metabolites, model-based approaches such as stepwise regression can be used to identify the strains that best explain the alterations in metabolite abundance. Mean values ± SEM are plotted. Each point in the right-hand portion of panel B represents a different community of 3–15 members. The x-axis groups the points into columns based on the strains identified by stepwise regression whose presence (+) or absence (−) in a community best explains the observed variation in metabolite level (P<0.001, F-test). The number of columns represents all possible combinations for presence/absence for the effector strains. The middle and upper/lower lines in each column denote the mean and SEM for all communities in that group.
Fig. 4
Fig. 4. Mono-colonization with select bacterial strains modulates colonic Tregs
Adult male germ-free C57BL/6J mice were colonized with one bacterial strain as indicated, or were maintained as germ-free. Two weeks after gavage, mice were sacrificed. Cells from the colonic lamina propria were prepared and FoxP3, Neuropilin-1 (Nrp1) and CD103 expression were assessed in CD4+ T cells by flow cytometry. (A) Frequency of FoxP3+ cells among CD4+ T cells in germ-free versus mono-colonized mice (n=4–21 animals/group). (B) Total numbers of CD4+ FoxP3+ T cells for the indicated mono-colonized mice or germ free mice (n=10–16 animals/group). (C) Frequency of Nrp1lo/− cells among colonic FoxP3+ CD4+ T cells in germ-free versus mono-colonized mice (n=5–16 animals/group). (D) Frequency of CD103+ cells among colonic FoxP3+ CD4+ T cells recovered from germ-free or mono-colonized mice (n=5–11 animals/group). Horizontal lines in panels A, C and D represent the mean, and each point represents an individual mouse. Bars in B represent the mean and error bars show SEM. The statistical significance of difference observed between germ-free and colonized animals was determined using a two-tailed unpaired Student’s t-test. *, P<0.05; **, P<0.01; ***, P<0.001; ****, P<0.0001. (E) Representative flow cytometry plots showing Nrp1 expression in FoxP3+ CD4+ T cells recovered from the colonic lamina propria of germ-free versus mono-associated animals. The percentages shown represent frequency in the gate. Isotype stain (control) was performed on a mixture of colonic lamina propria cells from all groups.

References

    1. Cotillard A, Kennedy SP, Kong LC, Prifti E, Pons N, Le Chatelier E, Almeida M, Quinquis B, Levenez F, Galleron N, Gougis S, Rizkalla S, Batto JM, Renenault P, Dore J, Zucker JD, Clement K, Ehrlich SD, Blottiere H, Leclerc M, Juste C, de Woulters T, Lepage P, Fouqueray C, Basdevant A, Henegar C, Godard C, Fondacci M, Rohia A, Hajduch F, Weissenbach J, Pelletier E, Le Paslier D, Gauchi JP, Gibrat JF, Louix V, Carre W, Maguin E, van de Guchte M, Jamet A, Boumezbeur F, Layec S ANR MicroObes consortium. Dietary intervention impact on gut microbial gene richness. Nature. 2013;500:585. - PubMed
    1. de Vos WM, de Vos EA. Role of the intestinal microbiome in health and disease: from correlation to causation. Nutr Rev. 2012;70(Suppl 1):S45. - PubMed
    1. Karlsson FH, Tremaroli V, Nookaew I, Bergstrom G, Behre CJ, Fagerberg B, Nielsen J, Backhed F. Gut metagenome in European women with normal, impaired and diabetic glucose control. Nature. 2013;498:99. - PubMed
    1. Le Chatelier E, Nielsen T, Qin J, Prifti E, Hildebrand F, Falony G, Almeida M, Arumugam M, Batto JM, Kennedy S, Leonard P, Li J, Burgdorf K, Grarup N, Jorgensen T, Brandslund I, Nielsen HB, Juncker AS, Bertalan M, Levenez F, Pons N, Rasmussen S, Sunagawa S, Tap J, Tims S, Zoetendal EG, Brunak S, Clement K, Dore J, Kleerebezem M, Kristiansen K, Renault P, Sicheritz-Ponten T, de Vos WM, Zucker JD, Raes J, Hansen T, Bork P, Wang J, Ehrlilch SD, Pedersen O, Guedon E, Delorme C, Layec S, Khaci G, van de Guchte M, Vandemeulebrouck G, Jamet A, Dervyn R, Sanchez N, Maguin E, Haimet F, Winogradski Y, Cultrone A, Leclerc M, Juste C, Blottiere H, Pelletier E, LePaslier D, Artiguenave F, Bruls T, Weissenbach J, Turner K, Parkhill J, Antolin M, Manichanh C, Casellas F, Boruel N, Varela E, Torrejon A, Guarner F, Denariaz G, Derrien M, van Hylckama Vlieg JE, Veiga P, Oozeer R, Knol J, Rescigno M, Brechot C, M’Rini C, Merieux A, Yamada T MetaHIT consortium. Richness of human gut microbiome correlates with metabolic markers. Nature. 2013;500:541. - PubMed
    1. Turnbaugh PJ, Hamady M, Yatsunenko T, Cantarel BL, duncan A, Ley RE, Sogin ML, Jones WJ, Roe BA, Affourtit JP, Egholm M, Henrissat B, Heath AC, Knight R, Gordon JI. A core gut microbiome in obese and lean twins. Nature. 2009;457:480. - PMC - PubMed

Publication types

MeSH terms