. 2014 Apr;85(4):618-29.
doi: 10.1124/mol.113.091488. Epub 2014 Jan 22.

Regulation of GluA1 α-amino-3-hydroxy-5-methyl-4-isoxazolepropionic acid receptor function by protein kinase C at serine-818 and threonine-840

Affiliations

Regulation of GluA1 α-amino-3-hydroxy-5-methyl-4-isoxazolepropionic acid receptor function by protein kinase C at serine-818 and threonine-840

Meagan A Jenkins et al. Mol Pharmacol. 2014 Apr.

Abstract

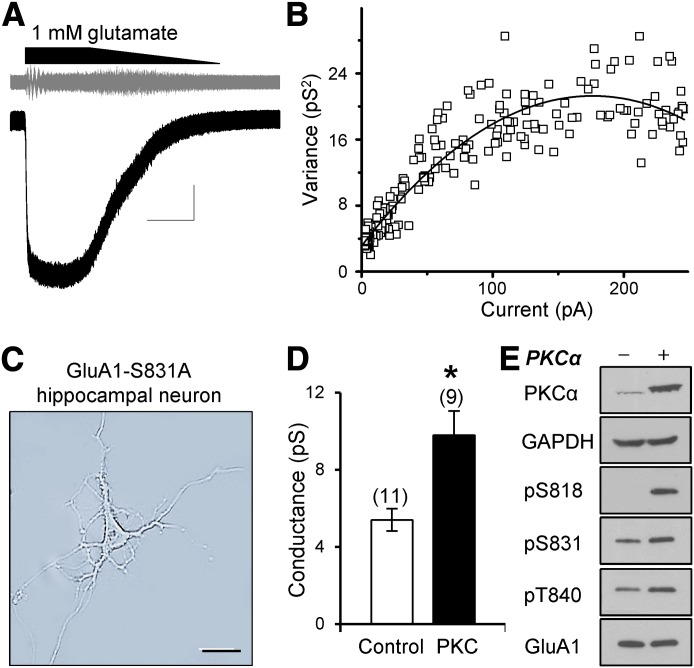
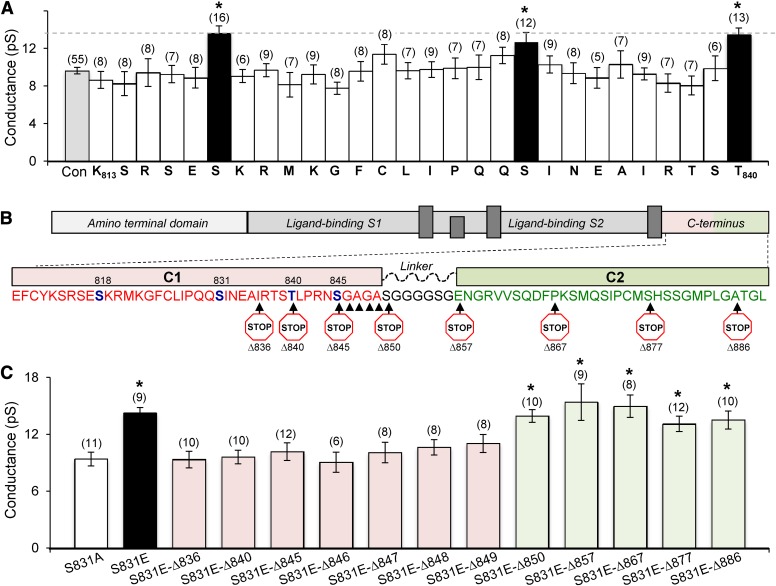
Three residues within the AMPA (α-amino-3-hydroxy-5-methyl-4-isoxazolepropionic acid) receptor subunit GluA1 C terminus (Ser818, Ser831, Thr840) can be phosphorylated by Ca(2+)/phospholipid-dependent protein kinase (PKC). Here, we show that PKC phosphorylation of GluA1 Ser818 or Thr840 enhances the weighted mean channel conductance without altering the response time course or agonist potency. These data support the idea that these residues constitute a hyper-regulatory domain for the AMPA receptor. Introduction of phosphomimetic mutations increases conductance only at these three sites within the proximal C terminus, consistent with a structural model with a flexible linker connecting the distal C-terminal domain to the more proximal domain containing a helix bracketed by Ser831 and Thr840. NMR spectra support this model and raise the possibility that phosphorylation can alter the configuration of this domain. Our findings provide insight into the structure and function of the C-terminal domain of GluA1, which controls AMPA receptor function and trafficking during synaptic plasticity in the central nervous system.


Figures

Fig. 1.
Fig. 1.
PKC increases conductance of neuronal AMPA receptors. (A) Representative AMPA receptor current response to 1 mM glutamate in outside-out patches excised from a cultured hippocampal pyramidal neuron from 129X1/Svj GluA1 S831A knock-in mice (Lee et al., 2010). Extracellular solutions contained 100 μM cyclothiazide to block AMPA-receptor desensitization, which allowed variance analysis of the response during agonist washout; 100 μM DL-APV and 1 mM Mg2+ were included to block NMDA receptors. The gray trace shows the response after high-pass filtering, illustrating the increase in membrane current noise during channel deactivation. Scale bar: 50 pA, and 20 seconds. (B) A representative current-variance relationship is superimposed on the fit of eq. 1 to the data (Materials and Methods). (C) Photomicrograph of a cultured hippocampal neuron isolated from 129X1/Svj GluA1 S831A knock-in mice (DIV 21; scale bar: 20 μm). (D) PKC enhances γMEAN of native AMPA receptors in cultured hippocampal neurons from GluA1 S831A knock-in mutant mice (mean ± S.E.M.). *P < 0.01 Student’s unpaired t test. The number of patches per condition is given in parentheses. (E) Coexpression of PKC increases phosphorylation of the GluA1 C terminus at Ser818, Ser831, and Thr840, as shown by Western blot analysis using phospho-specific antibodies. Quantification of six independent experiments normalized to control values yields significant increases in phosphorylation for Ser831 (control = 1.0, PKC = 3.68 ± 0.94-fold, P < 0.05) and Thr840 (PKC = 2.25 ± 0.58-fold, P < 0.05). Ser818 was not quantified because there is no basal signal in the absence of PKC, so the fold increase in phospho-Ser818 approaches infinity. GAPDH, glyceraldehyde-3-phosphate dehydrogenase.
Fig. 2.
Fig. 2.
Phosphomimetic mutations do not affect the glutamate EC50 at GluA1. (A) Representative whole-cell current trace from a HEK cell expressing GluA1-LY-AAAA receptors. Black boxes above the trace represent the agonist application time, with concentrations indicated above (in μM). Scale bar: 500 pA, and 5 seconds. (B and C) Concentration-response relationships were determined with glutamate concentrations ranging from 0.3 μM to 1000 μM for each GluA1 mutant receptor expressed in HEK cells. Composite data were plotted on a logarithmic scale and fitted with the Hill equation. Representative current traces are shown from outside-out patches excised from HEK cells transfected with the indicated (D) nondesensitizing GluA1-L497Y or (E) desensitizing GluA1-Leu497 held at −60 mV. Scale bars for D are 50 pA and 50 milliseconds for all GluA1-LY receptors except for GluA1-LY-EAAA (25 pA and 50 milliseconds). Scale bars for E WT receptors are 50 pA and 2 milliseconds for all except GluA1-WT-AAAA (100 pA and 2 milliseconds).
Fig. 3.
Fig. 3.
Structural determinants of C-terminal regulation of conductance. (A) Summary of results from glutamate-scan experiments in which all residues between GluA1 Lys813 and Thr840 were individually mutated to glutamate, and weighted mean conductance (γMEAN) was determined from variance analysis. Groups of three consecutive residues were paired with GluA1 controls for each experiment, and a statistical test was performed on these subgroupings to assess the changes in γMEAN (see Materials and Methods). *P < 0.01, one-way ANOVA, Tukey’s post hoc test. (B) Linear representation of the GluA1 subunit, indicating C-terminal residues at which stop codons were inserted to truncate the receptor. Represented above the C-terminal amino acid sequence is a schematic of the two domains, the membrane proximal region (C1 in light red) and the more distal C-terminal domain (C2 in green). C1 and C2 are connected via a glycine-rich flexible linker (black). The same color-coding is applicable to the residues in red, black, and green. (C) Summary of γMEAN values from a series of GluA1-AEAA truncation mutants (mean ± S.E.M.) with stop codons inserted in place of the indicated amino acid codons (*P < 0.05 compared with full-length GluA1-AAAA, one-way ANOVA, Tukey’s post hoc test). The number of outside-out patches per condition is in parentheses in all panels.
Fig. 4.
Fig. 4.
GluA1 C-terminal domain structural model. (A) Left panel: the antagonist-bound GluA2 crystal structure illustrates the extracellular and membrane bound regions of the GluA1 receptor (gray). Attached to the intracellular side of a single subunit is a molecular model of the predicted structure of the C-terminal domain. Right panel: expanded view of the predicted C-terminal domain structural model. C1 is composed of two helices, in green; the first helix contains GluA1 Ser818 whereas the second helix is flanked by GluA1 Ser831 and Thr840 (three phosphorylation sites are highlighted in blue). The Cα atoms of the critical G-A-G-A residues required for the phospho-Ser831 and phospho-Thr840 mediated conductance increase are also highlighted as yellow spheres (1.2 × van Der Waals radii). The glycine-rich flexible linker region C-terminal to GluA1 Ser850 is shown in orange. Only the initial portion of the C-terminal domain, C2, required for the phospho-Ser818 mediated conductance increase is shown. The proximal C1 region is absent. The GluA1 model is available in the Data Supplement. (B) The Phyre2 secondary structural prediction is compared with the helical elements detected by NMR analysis of a peptide corresponding to residues 828–849 (PQQSINEAIRTSTLPRNSGAGA). Cylinders indicated alpha-helices with the remainder of the sequence predicted to be disordered loops. (C) Natural abundance 1H,15N-HSQC spectrum for the unphosphorylated peptide (black) with the spectrum for the phosphorylated peptides in red. This two-dimensional spectrum shows through bond correlations between 1H and 15N, and provides chemical shift information for both. The spectrum includes the backbone NH for each amino acid in the peptide except proline and sidechain (sc) NH (Arg) and NH2 (Asn or Gln). Because very little change in the NH2 resonances was observed for the spectrum of the peptide phosphorylated at Ser845, the peaks were not labeled (see the labels for the unphosphorylated peptide in the spectrum on the right). The spectra were obtained at 500 MHz for proton using a cryogenic probe. A total of 128 complex points were obtained in the 15N dimension and 1024 in the 1H dimension.
Fig. 5.
Fig. 5.
Phosphorylation at Ser831 alters C-terminal structure. (A) Top panel: the twenty lowest energy structures calculated for the peptide phosphorylated on Ser831 are superimposed. The structures were aligned using the backbone atoms between Ile832 through Arg837 which form helical elements. Bottom panel: the twenty lowest energy structures calculated for the unphosphorylated peptide are shown. Alignment was done as for the unphosphorylated peptide. (B) Chemical shift changes are shown for wild-type peptide versus Ser831 phosphorylated (left panel) or Ser845 phosphorylated (right panel). The red bar indicates the phosphorylated serine. For ΔCα and ΔHα, the phosphorylated peptide chemical shift was subtracted from the unphosphorylated chemical shift. The value for ΔNHN was determined as: formula imagewhere ΔN is the difference in the nitrogen shift and ΔHN is the shift in the nitrogen proton.

Similar articles

Cited by

References

    1. Banke TG, Bowie D, Lee H, Huganir RL, Schousboe A, Traynelis SF. (2000) Control of GluR1 AMPA receptor function by cAMP-dependent protein kinase. J Neurosci 20:89–102 - PMC - PubMed
    1. Barria A, Derkach V, Soderling T. (1997a) Identification of the Ca2+/calmodulin-dependent protein kinase II regulatory phosphorylation site in the α-amino-3-hydroxyl-5-methyl-4-isoxazole-propionate-type glutamate receptor. J Biol Chem 272:32727–32730 - PubMed
    1. Barria A, Muller D, Derkach V, Griffith LC, Soderling TR. (1997b) Regulatory phosphorylation of AMPA-type glutamate receptors by CaM-KII during long-term potentiation. Science 276:2042–2045 - PubMed
    1. Benke TA, Lüthi A, Isaac JT, Collingridge GL. (1998) Modulation of AMPA receptor unitary conductance by synaptic activity. Nature 393:793–797 - PubMed
    1. Bliss TV, Collingridge GL. (1993) A synaptic model of memory: long-term potentiation in the hippocampus. Nature 361:31–39 - PubMed

MeSH terms

LinkOut - more resources