. 2014 Mar 15;306(6):F629-39.
doi: 10.1152/ajprenal.00516.2013. Epub 2014 Jan 22.

Insulin treatment attenuates renal ADAM17 and ACE2 shedding in diabetic Akita mice

Affiliations

Insulin treatment attenuates renal ADAM17 and ACE2 shedding in diabetic Akita mice

Esam S B Salem et al. Am J Physiol Renal Physiol. .

Abstract

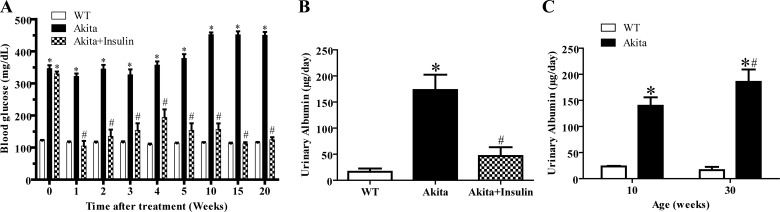
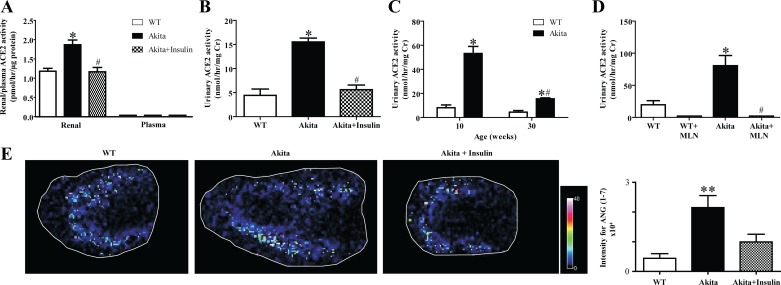
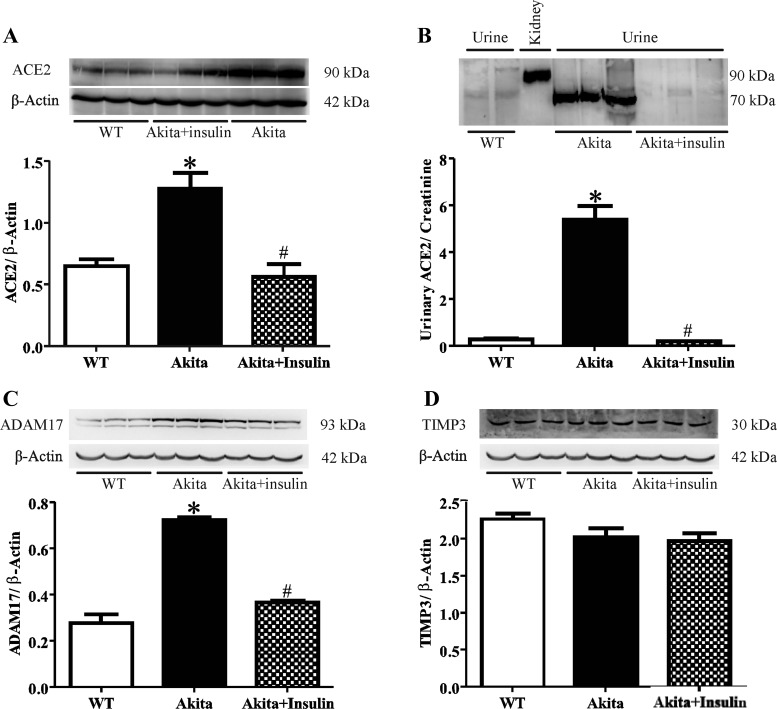
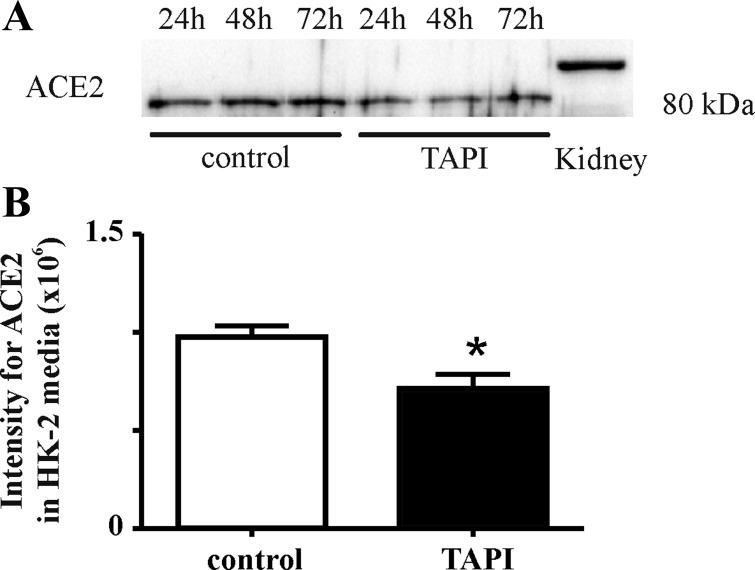
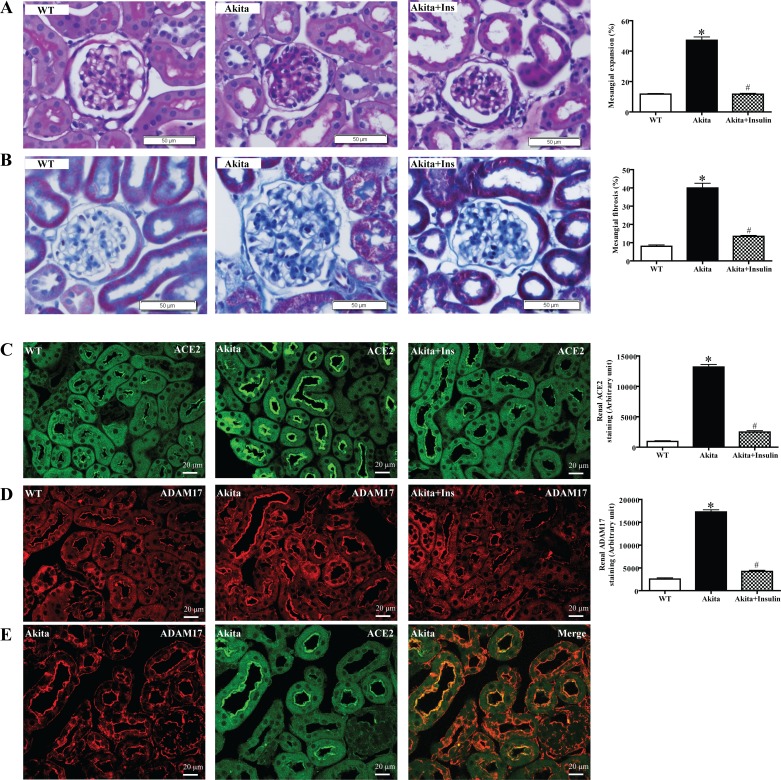
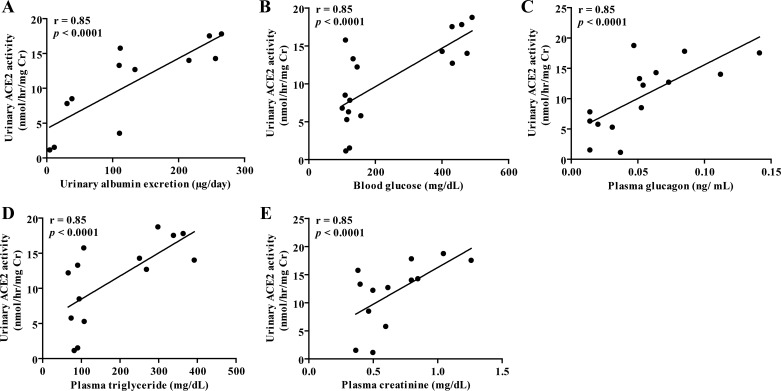
Angiotensin-converting enzyme 2 (ACE2) is located in several tissues and is highly expressed in renal proximal tubules, where it degrades the vasoconstrictor angiotensin II (ANG II) to ANG-(1-7). Accumulating evidence supports protective roles of ACE2 in several disease states, including diabetic nephropathy. A disintegrin and metalloprotease (ADAM) 17 is involved in the shedding of several transmembrane proteins, including ACE2. Our previous studies showed increased renal ACE2, ADAM17 expression, and urinary ACE2 in type 2 diabetic mice (Chodavarapu H, Grobe N, Somineni HK, Salem ES, Madhu M, Elased KM. PLoS One 8: e62833, 2013). The aim of the present study was to determine the effect of insulin on ACE2 shedding and ADAM17 in type 1 diabetic Akita mice. Results demonstrate increased renal ACE2 and ADAM17 expression and increased urinary ACE2 fragments (≈70 kDa) and albumin excretion in diabetic Akita mice. Immunostaining revealed colocalization of ACE2 with ADAM17 in renal tubules. Renal proximal tubular cells treated with ADAM17 inhibitor showed reduced ACE2 shedding into the media, confirming ADAM17-mediated shedding of ACE2. Treatment of Akita mice with insulin implants for 20 wk normalized hyperglycemia and decreased urinary ACE2 and albumin excretion. Insulin also normalized renal ACE2 and ADAM17 but had no effect on tissue inhibitor of metalloproteinase 3 (TIMP3) protein expression. There was a positive linear correlation between urinary ACE2 and albuminuria, blood glucose, plasma creatinine, glucagon, and triglycerides. This is the first report showing an association between hyperglycemia, cardiovascular risk factors, and increased shedding of urinary ACE2 in diabetic Akita mice. Urinary ACE2 could be used as a biomarker for diabetic nephropathy and as an index of intrarenal ACE2 status.

Keywords: ADAM17; TIMP3; albuminuria; diabetic Akita mice; renal and urinary ACE2.


Figures

Fig. 1.
Fig. 1.
Chronic treatment with insulin decreased hyperglycemia and urinary albumin excretion in Akita mice. A: time-related changes in blood glucose levels in wild-type (WT) mice, diabetic Akita mice, and diabetic Akita mice treated with insulin. Values are means ± SE of group size (n = 8–10). Repeated measurements 2-way ANOVA using a Bonferroni's post hoc test showed that treatment caused a significant decrease in blood glucose levels of Akita+insulin mice {[F (2, 20) = 1076.245], P < 0.0001}. Similarly, duration of treatment showed a significant decrease in blood glucose levels of Akita+insulin mice {[F (8, 80) = 43.172], P < 0.0001}. B: effect of normalizing hyperglycemia in diabetic Akita mice on urinary albumin excretion. One-way ANOVA showed that 20 wk after treatment commenced, there was a significant decrease in urinary albumin excretion in diabetic Akita mice treated with insulin compared with untreated diabetic Akita mice. Values are means ± SE of group size (n = 6–8). #P < 0.001 vs. untreated Akita mice, *P < 0.001 vs. WT. C: age-dependent changes in urinary albumin excretion in WT mice and diabetic Akita mice. There was a significant increase in urinary albumin excretion in 30-wk-old diabetic Akita mice compared with 10-wk-old diabetic Akita mice. Values are means ± SE of group size (n = 6–10). #P < 0.001, *P < 0.001 vs. WT.
Fig. 2.
Fig. 2.
Chronic treatment with insulin decreased renal and urinary angiotensin-converting enzyme 2 (ACE2) activity in Akita mice. A: renal and plasma ACE2 activity values determined in samples obtained from WT mice, diabetic Akita, and diabetic Akita mice treated with insulin. While plasma ACE2 activity was not detectable, 1-way ANOVA showed a significant increase in renal ACE2 activity in diabetic Akita mice compared with WT mice and diabetic Akita mice treated with insulin. Values are means ± SE of group size (n = 6–8). #P < 0.001 vs. untreated Akita mice. *P < 0.001 vs. WT. B: urinary ACE2 activity determined in samples obtained from WT mice, diabetic Akita mice, and diabetic Akita mice treated with insulin. One-way ANOVA showed a significant increase in urinary ACE2 activity in diabetic Akita mice compared with WT mice and diabetic Akita mice treated with insulin. Values are means ± SE of group size (n = 6–8). #P < 0.001 vs. untreated Akita mice. *P < 0.001 vs. WT. C: age-dependent changes in urinary ACE2 activity in WT mice and diabetic Akita mice. One-way ANOVA showed a significant decrease in urinary ACE2 activity of 30-wk-old diabetic Akita mice compared with 10-wk-old diabetic Akita mice. Values are means ± SE of group size (n = 6–10). #P < 0.001 vs. untreated Akita mice. *P < 0.001 vs. WT. D: urinary ACE2 activity significantly decreased in the presence of specific ACE2 inhibitor MLN-4760 (MLN). Values are means ± SE of group size (n = 10). #P < 0.001 vs. Akita mice, *P < 0.001 vs. WT. E: MALDI imaging of cortical ANG-(1–7) formation in 30-wk-old WT, Akita, and insulin-treated Akita mice. Quantitation of signal intensities showed a significant increase in cortical ANG-(1–7) formation in Akita mice compared with WT and insulin-treated Akita mice. Values are means ± SE of group size (n = 4). **P < 0.01 vs. WT.
Fig. 3.
Fig. 3.
Western blot analysis for renal and urinary ACE2 and renal a disintegrin and metalloprotease (ADAM) 17 and tissue inhibitor of metalloproteinase 3 (TIMP3) protein expression in WT, diabetic Akita, and Akita mice treated with insulin. A: renal ACE2 protein expression values determined in samples obtained from WT mice, diabetic Akita mice, and diabetic Akita mice treated with insulin. One-way ANOVA showed a significant increase in renal ACE2 protein expression of diabetic Akita mice compared with WT mice and diabetic Akita mice treated with insulin. Values are means ± SE of group size (n = 6–8). #P < 0.001 vs. untreated Akita mice. *P < 0.001 vs. WT. B: urinary ACE2 protein expression values determined in samples obtained from WT mice, diabetic Akita mice, and diabetic Akita mice treated with insulin. One-way ANOVA showed a significant increase in urinary ACE2 protein expression of diabetic Akita mice compared with WT mice and diabetic Akita mice treated with insulin. Values are means ± SE of group size (n = 6–10). #P < 0.001 vs. untreated diabetic Akita mice. *P < 0.001 vs. WT. C: renal ADAM17 protein expression values determined in samples obtained from WT mice, diabetic Akita mice, and diabetic Akita mice treated with insulin. One-way ANOVA showed a significant increase in renal ADAM17 protein expression of diabetic Akita mice compared with WT mice and diabetic Akita mice treated with insulin. #P < 0.001 vs. untreated Akita mice. Values are means ± SE of group size (n = 6–8). *P < 0.001 vs. WT. D: renal TIMP3 protein expression values determined in samples obtained from WT mice, diabetic Akita mice, and diabetic Akita mice treated with insulin. One-way ANOVA showed that there was no significant change in renal TIMP3 protein expression of diabetic Akita mice compared with WT mice or diabetic Akita mice treated with insulin. Values are means ± SE of group size (n = 6–8).
Fig. 4.
Fig. 4.
Inhibition of ADAM17 reduced ACE2 shedding in human renal proximal tubular HK-2 cells. A: Western blot of ACE2 protein expression in cell media obtained after 24, 48, and 72 h from control HK-2 cells or from HK-2 cells after treatment with the ADAM17 inhibitor TNF-α protease inhibitor-1 (TAPI-1). B: ACE2 levels in cell media after treatment with ADAM17 inhibitor, TAPI-1. An unpaired Student's t-test showed significantly decreased ACE2 protein expression in media obtained from treated HK-2 cells. Values are means ± SE of group size (n = 3). *P < 0.05 vs. control.
Fig. 5.
Fig. 5.
Histological analysis and immunofluorescence staining of renal ACE2 and ADAM17 after 12 wk of insulin treatment. A: representative periodic acid-Schiff (PAS) staining of 22-wk-old kidney sections obtained from WT mice, diabetic Akita mice, and diabetic Akita mice treated with insulin. The y-axis (%) is defined as the area of PAS staining in the glomerulus divided by the total area of the glomerulus multiplied by 100. There was a significant increase in glomerular mesangial expansion in diabetic Akita mice compared with WT mice and diabetic Akita mice treated with insulin. Values are means ± SE of group size (n = 25 glomeruli/group). #P < 0.001 vs. untreated Akita. *P < 0.001 vs. WT. B: representative Masson's trichrome staining of 22-wk-old kidney sections in WT mice, diabetic Akita mice, and diabetic Akita mice treated with insulin. The y-axis (%) is defined as the area of Masson's trichrome staining in the glomerulus divided by the total area of the glomerulus multiplied by 100. There was a significant increase in glomerular mesangial fibrosis in diabetic Akita mice compared with WT mice and diabetic Akita mice treated with insulin. Values are means ± SE of group size (n = 25 glomeruli/group). #P < 0.001 vs. untreated Akita. *P < 0.001 vs. WT. C: immunofluorescence staining with ACE2 in the kidney sections from WT mice, diabetic Akita mice, and diabetic Akita mice treated with insulin. Strong ACE2 staining is observed in the cortical tubules in diabetic Akita mice compared with WT mice and insulin-treated diabetic Akita mice. #P < 0.001 vs. untreated Akita. *P < 0.001 vs. WT. D: immunofluorescence staining for ADAM17 in the kidney sections from WT mice, diabetic Akita mice, and diabetic Akita mice treated with insulin. Strong ADAM17 staining is observed in the cortical tubules in diabetic Akita mice compared with WT mice and insulin-treated diabetic Akita mice. #P < 0.001 vs. untreated Akita. *P < 0.001 vs. WT. E: immunofluorescence staining of ACE2 and ADAM17 in a kidney obtained from an Akita mouse. Merging of both images shows colocalization of ACE2 and ADAM17 in cortical tubules.
Fig. 6.
Fig. 6.
Regression analysis between urinary ACE2 activity and albuminuria, blood glucose, and plasma levels of glucagon, triglycerides, and creatinine. A: regression analysis showed a significant positive correlation between urinary ACE2 activity and urinary albumin excretion. B: regression analysis showed a significant positive correlation between urinary ACE2 activity and blood glucose. C: regression analysis showed a significant positive correlation between urinary ACE2 activity and plasma glucagon. D: regression analysis showed a significant positive correlation between urinary ACE2 activity and plasma triglyceride. E: regression analysis showed a significant positive correlation between urinary ACE2 activity and plasma creatinine.

References

    1. Anonymous The effect of intensive treatment of diabetes on the development, and progression of long-term complications in insulin-dependent diabetes mellitus. The Diabetes Control and Complications Trial Research Group. N Engl J Med 329: 977–986, 1993 - PubMed
    1. Arita DY, Cunha TS, Perez JD, Colucci JA, Ronchi FA, Nogueira MD, Arita LS, Aragao DS, Teixeira VP, Casarini DE. Overexpression of urinary N-domain ACE in chronic kidney dysfunction in Wistar rats. Clin Exp Hypertens 34: 389–396, 2012 - PubMed
    1. Basu R, Lee J, Wang Z, Patel VB, Fan D, Das SK, Liu GC, John R, Scholey JW, Oudit GY, Kassiri Z. Loss of TIMP3 selectively exacerbates diabetic nephropathy. Am J Physiol Renal Physiol 303: F1341–F1352, 2012 - PMC - PubMed
    1. Brezar V, Culina S, Gagnerault MC, Mallone R. Short-term subcutaneous insulin treatment delays but does not prevent diabetes in NOD mice. Eur J Immunol 42: 1553–1561, 2012 - PubMed
    1. Cardellini M, Menghini R, Luzi A, Davato F, Cardolini I, D'Alfonso R, Gentileschi P, Rizza S, Marini MA, Porzio O, Lauro D, Sbraccia P, Lauro R, Federici M. Decreased IRS2 and TIMP3 expression in monocytes from offspring of type 2 diabetic patients is correlated with insulin resistance and increased intima-media thickness. Diabetes 60: 3265–3270, 2011 - PMC - PubMed

Publication types