. 2014 Apr;42(7):4767-78.
doi: 10.1093/nar/gkt1405. Epub 2014 Jan 21.

A ribozyme that triphosphorylates RNA 5'-hydroxyl groups

Affiliations

A ribozyme that triphosphorylates RNA 5'-hydroxyl groups

Janina E Moretti et al. Nucleic Acids Res. 2014 Apr.

Abstract

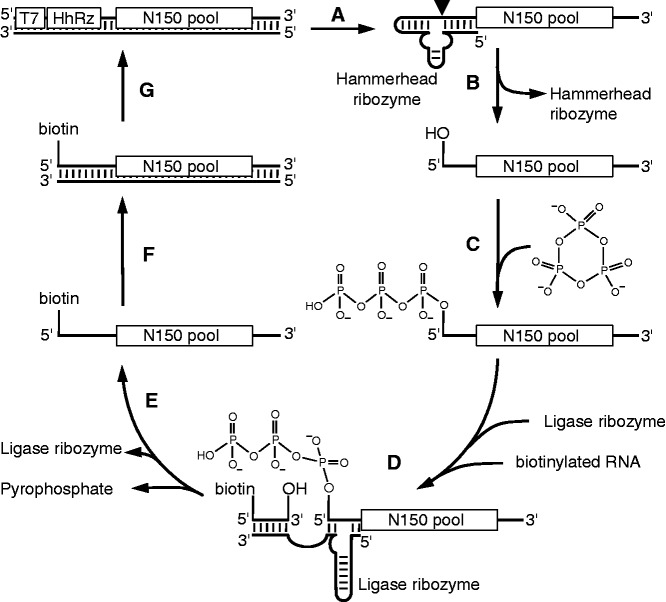
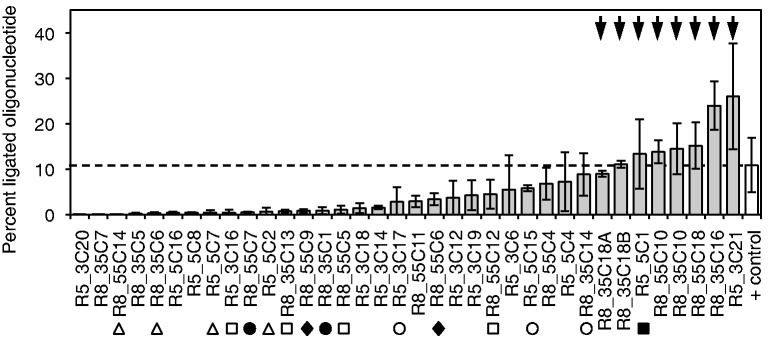
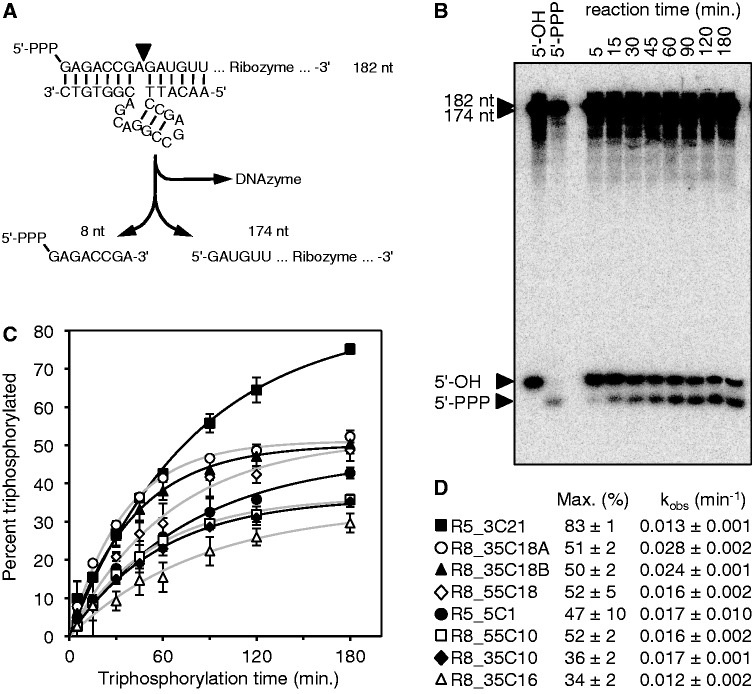
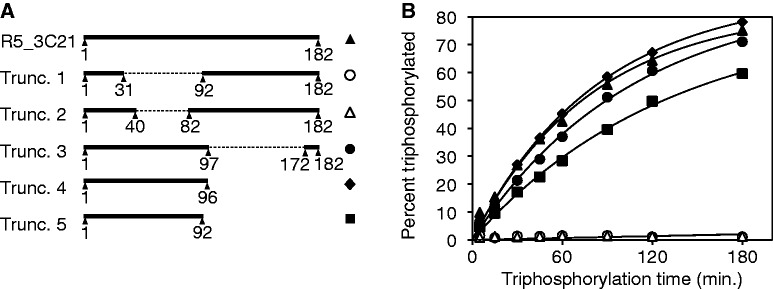
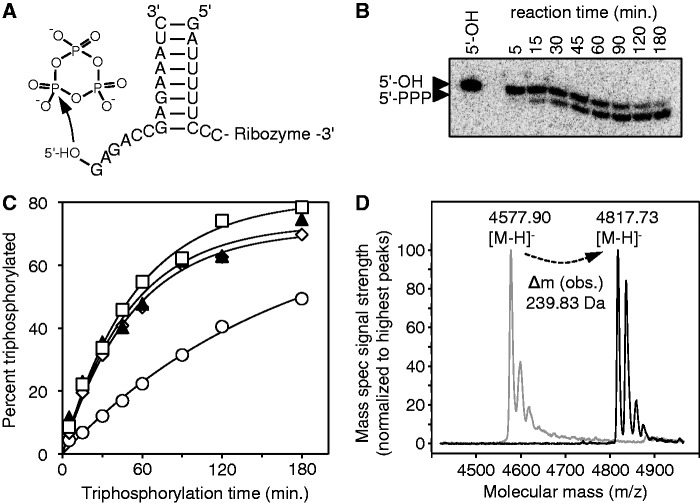
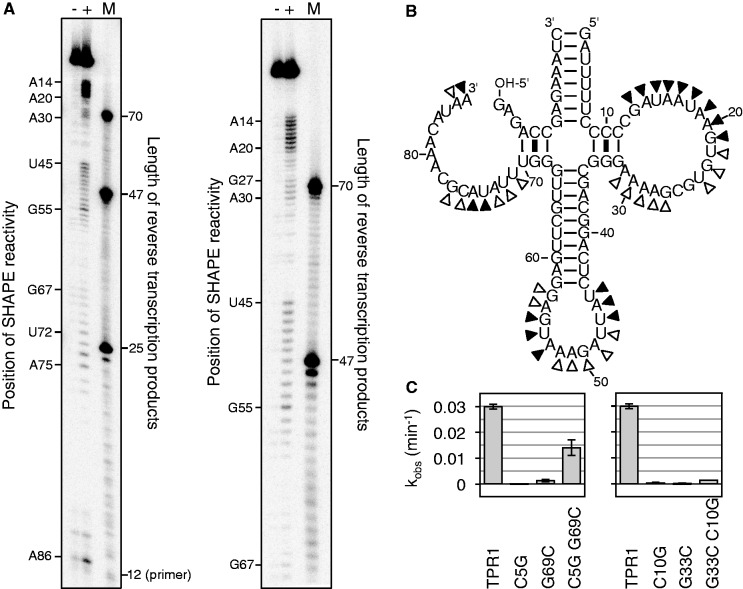
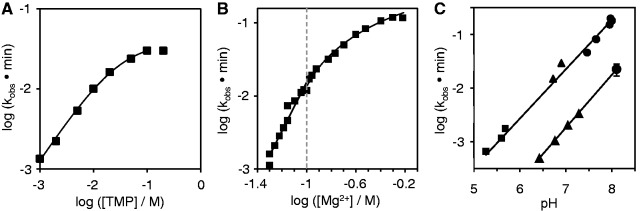
The RNA world hypothesis describes a stage in the early evolution of life in which RNA served as genome and as the only genome-encoded catalyst. To test whether RNA world organisms could have used cyclic trimetaphosphate as an energy source, we developed an in vitro selection strategy for isolating ribozymes that catalyze the triphosphorylation of RNA 5'-hydroxyl groups with trimetaphosphate. Several active sequences were isolated, and one ribozyme was analyzed in more detail. The ribozyme was truncated to 96 nt, while retaining full activity. It was converted to a trans-format and reacted with rates of 0.16 min(-1) under optimal conditions. The secondary structure appears to contain a four-helical junction motif. This study showed that ribozymes can use trimetaphosphate to triphosphorylate RNA 5'-hydroxyl groups and suggested that RNA world organisms could have used trimetaphosphate as their energy source.


Figures

Figure 1.
Figure 1.
Scheme for the in vitro selection of triphosphorylation ribozymes. (A) A double-stranded DNA library containing the promoter for T7 RNA polymerase (T7), the sequence for a hammerhead ribozyme (HhRz) and a randomized sequence (N150) was transcribed into RNA. (B) The 5′-terminal hammerhead ribozyme cleaved itself off cotranscriptionally (filled triangle), generating a 5′-terminal hydroxyl group on the RNA library. (C) The RNA library was incubated in the presence of TMP such that active ribozymes could triphosphorylate their 5′-terminus. (D) Triphosphorylated RNA molecules were reacted with the 3′-hydroxyl group of a short biotinylated RNA, by the R3C ligase ribozyme. (E) Ligated RNAs were captured via their biotin modification on streptavidin-coated magnetic beads and washed stringently. The RNAs were then (F) reverse transcribed and (G) amplified by PCR to generate the DNA pool for the next round of selection.
Figure 2.
Figure 2.
Screen of 36 in vitro selected RNAs for self-triphosphorylation activity, using an assay based on the R3C ligase ribozyme (see Supplementary Figure S4). The column heights show the percent of 5′-[32P]-radiolabeled oligonucleotide that was ligated to the individual selected RNAs by the ligase ribozyme, after the selected RNAs were incubated with TMP for 3 h to allow for self-triphosphorylation. Therefore, the percent of ligated oligonucleotide was an indirect measure of self-triphosphorylation activity. As positive control, the unselected RNA pool was ligated to the radiolabeled oligonucleotide, facilitated by a 5′-triphosphate that was incorporated during transcription (white column and horizontal dashed line). The labels on the x-axis denote the clone names (round of isolation_branch of the evolution_clone number). The clones were sorted according to the average percent of ligated oligonucleotide. The sequences of all 36 clones are shown in Supplementary Figure S3. Classes of related sequences are indicated by symbols, with empty squares (class 1), empty triangles (class 2), empty circles (class 3), filled circles (class 4), filled squares (class 5) and filled diamonds (class 6) each belonging to one class. Class 5 is represented by a single clone because the second clone had the identical sequence. No other clone showed related sequences among the 36 clones. The eight clones with the highest activity (arrows) were chosen for further analysis. Error bars are standard deviations from three independent experiments.
Figure 3.
Figure 3.
Kinetic analysis of the eight most promising ribozyme clones. (A) Schematic of the assay using the 8–17 DNAzyme. After reaction with TMP, internally [32P]-radiolabeled ribozymes were cleaved by the DNAzyme. This freed the eight 5′-terminal nucleotides, facilitating gel separation of triphosphorylated and unreacted RNAs. (B) Autoradiogram of products after the DNAzyme reaction and separation by denaturing 22% PAGE. An RNA that was not exposed to TMP (5′-OH) and an RNA that was transcribed with a 5′-terminal triphosphate (5′-PPP) were used as negative and positive controls, respectively. The incubation times with TMP are indicated on the top. The long fragment of the cleaved ribozymes (174 nt) and possible remaining uncleaved ribozymes (182 nt) migrated much slower than the 8-nt fragments. The 8-nt fragments were separated based on their phosphorylation status. The particular autoradiogram was from analysis of clone R8_35C18A. (C) Determination of triphosphorylation kinetics from signals as shown in (B). The percent of triphosphorylation of the 8-mer was plotted as function of the incubation time with TMP. Single-exponential fits are shown as black or gray lines. Error bars are standard deviations from three experiments. Symbols are explained in (D). Single-exponential curve fits are shown in black lines for filled symbols and gray lines for empty symbols. (D) Symbols and clone names used in (C), together with the parameters obtained by curve fits, the maximal percentage of reacted ribozyme (Max.) and the observed pseudo-first order rate constant (kobs).
Figure 4.
Figure 4.
Truncation analysis of the ribozyme clone R5_3C21. (A) Schematic of the tested truncations. The numbering is relative to the complete sequence of the 182-nt long initial isolate (Supplementary Figure S3). Dotted lines indicate internal segments that were removed. Symbols to the right of each construct are consistent with the symbols in (B). (B) Triphosphorylation kinetics for the initial isolate and five truncated sequences. The kinetics was determined with the DNAzyme assay (Figure 3). Black lines represent single-exponential curve fits to the data. The symbols of truncations 1 and 2 are overlapping near the x-axis.
Figure 5.
Figure 5.
Trans-triphosphorylation of substrate RNAs, by truncated versions of the R5_3C21 ribozyme. (A) Secondary structure schematic of a 14-nt substrate recognized by the ribozyme with an 8 bp substrate recognition duplex. The TMP is shown to highlight the reacting 5′-hydroxyl group. The body of the ribozyme is not shown for clarity (see Figure 6). (B) Autoradiogram of reaction products between substoichiometric concentrations of [32P]-radiolabeled substrate and TMP, catalyzed by 5.5 μM of the ribozyme, after separation on denaturing 22.5% PAGE. The particular image is from the reaction with a substrate recognition duplex of 8 bp. (C) Reaction kinetics of the trans-reaction with different lengths of the substrate recognition duplex. Symbols in the graph correspond to a duplex length of 6 bp (empty circles), 7 bp (empty diamonds), 8 bp (filled triangles) and 9 bp (empty squares). Curved lines are single-exponential fits to the data. (D) Mass spectral analysis of the substrate and the product of the trans-triphosphorylation reaction. The 14-nt substrate shown in (A) was analyzed before (gray lines) and after (black lines) incubation with the trans-acting ribozyme under triphosphorylation reaction conditions. The expected mass increase by 5′-triphosphate was 239.94 Da. Substrate and product carried a 2′-3′ cyclic phosphate due to their method used to synthesize them.
Figure 6.
Figure 6.
Secondary structure analysis for the trans-triphosphorylating TPR1 ribozyme. (A) Autoradiograms of SHAPE analysis products, after reacting the ribozymes with 1M7 and subjecting them to reverse transcription with a 5′-[32P]-radiolabeled primer. The left image shows a separation by 20% PAGE to separate short products, whereas the right image shows a separation by 10% PAGE to show the longer products. Each image shows three lanes, where (−) denotes a negative control with DMSO, (+) denotes the SHAPE reaction with 1M7 dissolved in DMSO and M denotes a marker lane with three 5′-radiolabeled DNAs that have the identical sequence as the expected reverse transcription products. The primer has a length of 12 nt, base paired to 12 nt that were appended to the ribozyme 3′-terminus. The SHAPE signal is shifted by one nucleotide relative to the length of the reverse transcription product because the reverse transcriptase stops at the nucleotide before the SHAPE modification. (B) The secondary structure was based on two types of analysis. Filled triangles indicate a strong signal from SHAPE analysis, whereas empty triangles indicate weaker signals. (C) Two base pairs suggested by the SHAPE data were tested by single mutations of each base partner, and double mutation that should have restored activity for correct base pairs. The observed reaction rate was determined as in Figure 5 and given for each mutant.
Figure 7.
Figure 7.
Dependence of reaction kinetics on reaction conditions, for the trans-splicing TPR1 ribozyme. (A) Dependence of the observed reaction rate on the concentration of TMP, with a free [Mg2+] of 50 mM at pH 8.1. The maximal rate is reached at 100 mM [TMP]. The black line shows the fit of the Michaelis–Menten equation kobs = (kcat * [TMP]/(KM + [TMP]) to data points from 1–100 mM [TMP], with kcat = 0.039 min−1 and KM = 30 mM. (B) Dependence of the observed reaction rate on the concentration of free magnesium ions. This is the excess of magnesium ions over the TMP concentration (here 100 mM), at pH 8.1. The dotted line separates reactions with [Mg2+]/[TMP] < 1 (left) from reactions with [Mg2+]/[TMP] > 1 (right). The fastest rate is obtained at 400 mM free [Mg2+]. The half-maximal rate of 0.068 min−1 was observed at 150 mM free [Mg2+]. (C) Dependence of the observed reaction rate on the pH, at 100 mM [TMP] and 400 mM free [Mg2+] (top line) and at 50 mM [TMP] and 50 mM free [Mg2+] (bottom line). The slopes of the two lines were 0.92 (top line) and 0.99 (bottom line), respectively. The symbols denote the buffer systems MES/NaOH (squares), HEPES/NaOH (triangles) and Tris–HCl (circles). The data point in the lower data set at pH 8.1 is the average of seven independent experiments, with error bars denoting their standard deviation.

References

    1. Woese CR. The Genetic Code. The Molecular Basis for Genetic Expression. New York: Harper & Row; 1967.
    1. Crick FHC. The origin of the genetic code. J. Mol. Biol. 1968;38:367–379. - PubMed
    1. Orgel LE. Evolution of the genetic apparatus. J. Mol. Biol. 1968;38:381–393. - PubMed
    1. Robertson MP, Joyce GF. The origins of the RNA world. Cold Spring Harb. Perspect. Biol. 2012;4 pii: a003608. - PMC - PubMed
    1. Szostak JW. The eightfold path to non-enzymatic RNA replication. J. Syst. Chem. 2012;3:2.

Publication types