

Impact of methodological variables on functional connectivity findings in autism spectrum disorders
- PMID: 24452854
- PMCID: PMC5708536
- DOI: 10.1002/hbm.22456
Impact of methodological variables on functional connectivity findings in autism spectrum disorders
Abstract
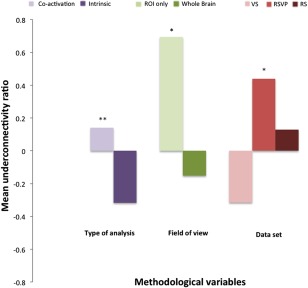
Growing evidence suggests that Autism Spectrum Disorder (ASD) involves abnormalities of multiple functional networks. Neuroimaging studies of ASD have therefore increasingly focused on connectivity. Many functional connectivity (fcMRI) studies have reported network underconnectivity in children and adults with ASD. However, there are notable inconsistencies, with some studies reporting overconnectivity. A previous literature survey suggested that a few methodological factors play a crucial role in differential fcMRI outcomes. Using three ASD data sets (two task-related, one resting state) from 54 ASD and 51 typically developing (TD) participants (ages 9-18 years), we examined the impact of four methodological factors: type of pipeline (co-activation vs. intrinsic analysis, related to temporal filtering and removal of task-related effects), seed selection, field of view (whole brain vs. limited ROIs), and dataset. Significant effects were found for type of pipeline, field of view, and dataset. Notably, for each dataset results ranging from robust underconnectivity to robust overconnectivity were detected, depending on the type of pipeline, with intrinsic fcMRI analyses (low bandpass filter and task regressor) predominantly yielding overconnectivity in ASD, but co-activation analyses (no low bandpass filter or task removal) mostly generating underconnectivity findings. These results suggest that methodological variables have dramatic impact on group differences reported in fcMRI studies. Improved awareness of their implications appears indispensible in fcMRI studies when inferences about "underconnectivity" or "overconnectivity" in ASD are made. In the absence of a gold standard for functional connectivity, the combination of different methodological approaches promises a more comprehensive understanding of connectivity in ASD.
Keywords: autism; fMRI; functional connectivity; region of interest; resting state; task regression; temporal filtering.
Copyright © 2014 Wiley Periodicals, Inc.
Figures

Similar articles
-
Atypical lexicosemantic function of extrastriate cortex in autism spectrum disorder: evidence from functional and effective connectivity.Neuroimage. 2012 Sep;62(3):1780-91. doi: 10.1016/j.neuroimage.2012.06.008. Epub 2012 Jun 12. Neuroimage. 2012. PMID: 22699044 Free PMC article.
-
Aberrant "deep connectivity" in autism: A cortico-subcortical functional connectivity magnetic resonance imaging study.Autism Res. 2019 Mar;12(3):384-400. doi: 10.1002/aur.2058. Epub 2019 Jan 9. Autism Res. 2019. PMID: 30624021
-
Patterns of Atypical Functional Connectivity and Behavioral Links in Autism Differ Between Default, Salience, and Executive Networks.Cereb Cortex. 2016 Oct;26(10):4034-45. doi: 10.1093/cercor/bhv191. Epub 2015 Sep 7. Cereb Cortex. 2016. PMID: 26351318 Free PMC article.
-
Underconnected, but how? A survey of functional connectivity MRI studies in autism spectrum disorders.Cereb Cortex. 2011 Oct;21(10):2233-43. doi: 10.1093/cercor/bhq296. Epub 2011 Mar 4. Cereb Cortex. 2011. PMID: 21378114 Free PMC article. Review.
-
Neuroimaging in neurodevelopmental disorders: focus on resting-state fMRI analysis of intrinsic functional brain connectivity.Curr Opin Neurol. 2018 Apr;31(2):140-148. doi: 10.1097/WCO.0000000000000536. Curr Opin Neurol. 2018. PMID: 29351108 Review.
Cited by
-
Morphological Alterations in the Thalamus, Striatum, and Pallidum in Autism Spectrum Disorder.Neuropsychopharmacology. 2016 Oct;41(11):2627-37. doi: 10.1038/npp.2016.64. Epub 2016 Apr 29. Neuropsychopharmacology. 2016. PMID: 27125303 Free PMC article.
-
Functional MRI connectivity of children with autism and low verbal and cognitive performance.Mol Autism. 2018 Dec 27;9:67. doi: 10.1186/s13229-018-0248-y. eCollection 2018. Mol Autism. 2018. PMID: 30603063 Free PMC article.
-
Distinct profiles of functional connectivity density aberrance in Alzheimer's disease and mild cognitive impairment.Front Psychiatry. 2022 Dec 15;13:1079149. doi: 10.3389/fpsyt.2022.1079149. eCollection 2022. Front Psychiatry. 2022. PMID: 36590612 Free PMC article.
-
Aberrant Coupling Between Resting-State Cerebral Blood Flow and Functional Connectivity in Wilson's Disease.Front Neural Circuits. 2019 Apr 18;13:25. doi: 10.3389/fncir.2019.00025. eCollection 2019. Front Neural Circuits. 2019. PMID: 31057370 Free PMC article.
-
The language network in autism: Atypical functional connectivity with default mode and visual regions.Autism Res. 2019 Sep;12(9):1344-1355. doi: 10.1002/aur.2171. Epub 2019 Jul 17. Autism Res. 2019. PMID: 31317655 Free PMC article.
References
Publication types
MeSH terms
Grants and funding
LinkOut - more resources
Full Text Sources
Other Literature Sources
Medical
