. 2014 Apr;62(4):237-50.
doi: 10.1369/0022155413519650. Epub 2014 Jan 22.

Consumption of acidic water alters the gut microbiome and decreases the risk of diabetes in NOD mice

Affiliations

Consumption of acidic water alters the gut microbiome and decreases the risk of diabetes in NOD mice

Kyle J Wolf et al. J Histochem Cytochem. 2014 Apr.

Abstract

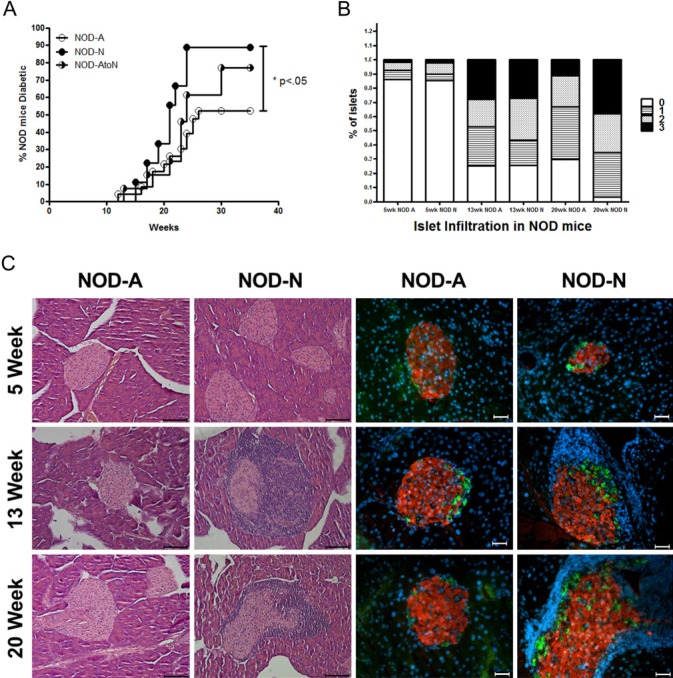
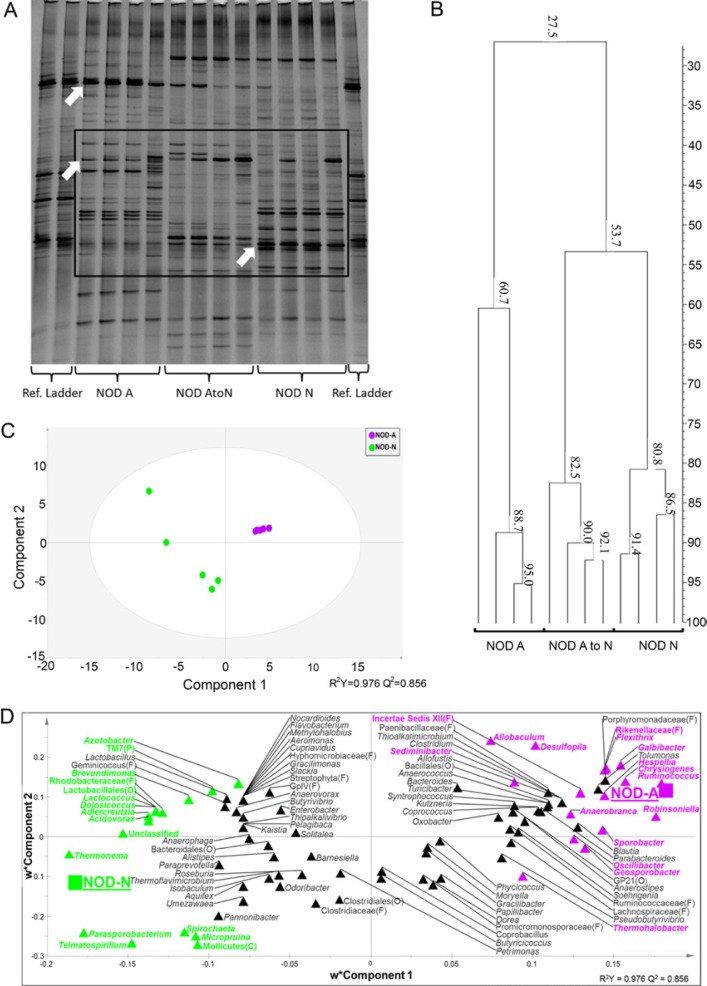
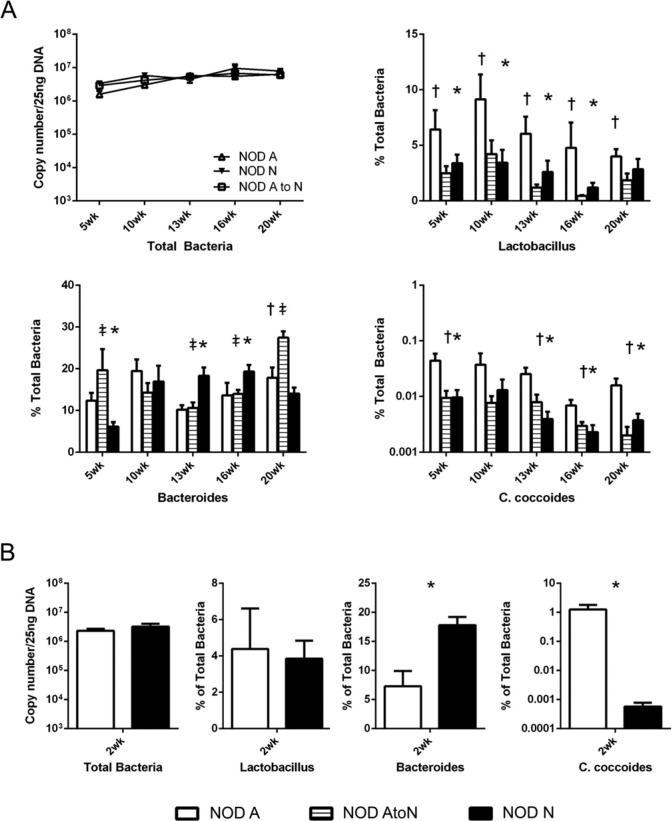
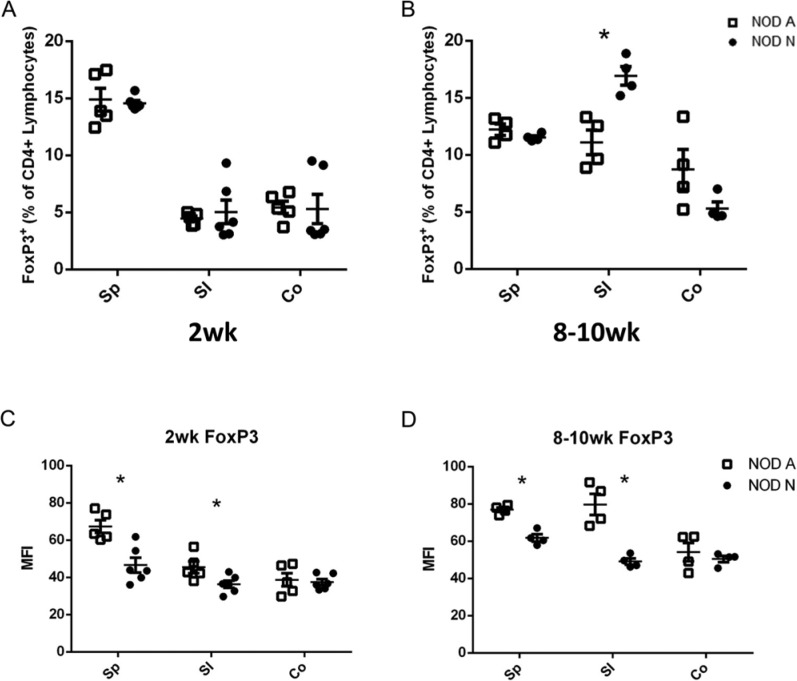
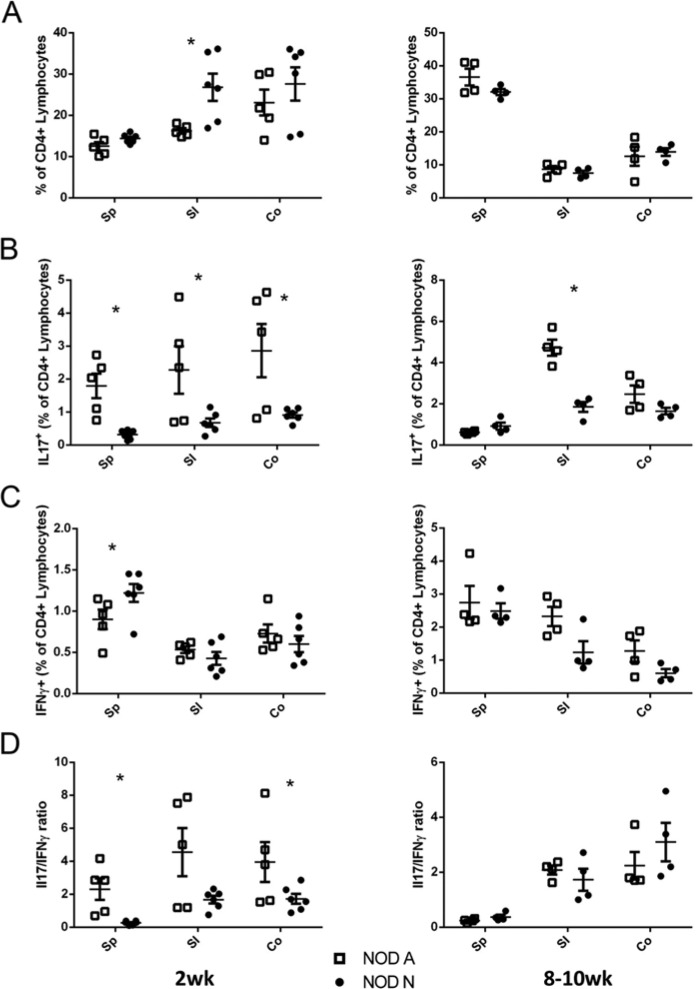
Infant formula and breastfeeding are environmental factors that influence the incidence of Type 1 Diabetes (T1D) as well as the acidity of newborn diets. To determine if altering the intestinal microbiome is one mechanism through which an acidic liquid plays a role in T1D, we placed non-obese diabetic (NOD)/ShiLtJt mice on neutral (N) or acidified H2O and monitored the impact on microbial composition and diabetes incidence. NOD-N mice showed an increased development of diabetes, while exhibiting a decrease in Firmicutes and an increase in Bacteroidetes, Actinobacteria, and Proteobacteria from as early as 2 weeks of age. NOD-N mice had a decrease in the levels of Foxp3 expression in CD4(+)Foxp3(+) cells, as well as decreased CD4(+)IL17(+) cells, and a lower ratio of IL17/IFNγ CD4+ T-cells. Our data clearly indicates that a change in the acidity of liquids consumed dramatically alters the intestinal microbiome, the presence of protective Th17 and Treg cells, and the incidence of diabetes. This data suggests that early dietary manipulation of intestinal microbiota may be a novel mechanism to delay T1D onset in genetically pre-disposed individuals.

Keywords: T-cells; diet; microbiota; mouse model; type 1 diabetes.


Conflict of interest statement

Declaration of Conflicting Interests: The author(s) declared no potential conflicts of interest with respect to the research, authorship, and/or publication of this article.

Figures

Figure 1.
Figure 1.
NOD mice on neutral drinking water have an increased incidence of diabetes and alterations in the diversity of their fecal microbiota. (A) Incidence of diabetes in NOD female mice on neutral water (NOD-N, open circles, n=9), acidified water (NOD-A, filled circles, n=23) or water switched from acidified to neutral at weaning (NOD-AtoN, half-filled circles, n=13). Data represent three individual experiments. Significance was determined by the Mantel-Cox Test. (B) Analysis of lymphocytic infiltrate and islet destruction in NOD mice on neutral or acidified water. 0 = no infiltration, 1 = peri-insulitis, 2 = <50% of islet infiltrated, 3 = >50% of islet infiltrated. At 20 weeks, the NOD-N mice had significantly more infiltrated islets (score of 2 or 3; p=0.03). An average of 80 islets per group was counted. (C) Representative H&E (left two panels; scale bar=100 µm) and immunofluorescence (right two panels; red = insulin, green = glucagon, blue = nucleus; scale bar =10 µm) images of pancreatic islets from NOD-A or NOD-N mice at the indicated ages.
Figure 2.
Figure 2.
Impact of neutral or acidified drinking water on the fecal microbiota composition of NOD-N and NOD-A mice. (A) A representative denaturing gradient gel electrophoresis (DGGE) analysis of banding patterns from 10-week-old female mice on neutral water (NOD-N, right), acidified water (NOD-A, left) or water switched from acidified to neutral at weaning (NOD-AtoN, middle). Top arrow points to a band identified by sequencing as Lactobacillus johnsonii. Middle arrow points to a band identified as Clostridia Cluster XIV species. Bottom arrow points to a band identified as Bacteroides sp. (B) Banding similarity analysis of the representative samples from 10-week-old NOD-A, NOD-AtoN and NOD-N mice indicates that their microbiota share a 27.5% similarity. NOD-AtoN and NOD-N mice share a higher degree of similarity (53.7%) comparedwith NOD-A mice. Banding analysis was conducted using the Pearson correlation analysis. Figure S1 demonstrates that NOD-A mice have a lower pH throughout their GI tract. Pyrosequencing data were subjected to partial least squares discriminant analysis (PLS-DA). (C) Score scatter plot representing individual animals from each treatment, grouped based on the composition of fecal microbiota. The R2 and Q2 of the model were 0.97 and 0.85, respectively. (D) Bacterial taxa plotted using weighted PLS component 1 and 2. Genera in the plot closer to either treatment are more strongly associated to it. Genera found to significantly contribute to the model prediction are shown in green (NOD-N) and magenta (NOD-A). When a sequence could not be classified to the genus level, the closest level of classification was given, followed by F (family), O (order), C (class), or P (phylum). Additional data showing differences between NOD-A and NOD-N mice at the genus level can be found in Figure S3 and Tables S2, S3 and S4.
Figure 3.
Figure 3.
qRT-PCR analysis of bacteria copy numbers in feces of NOD mice shows a significant dysbiosis in mice on neutral drinking water. (A) qRT-PCR analysis of the total copy numbers of NOD mice on acidified (NOD-A), acidified to neutral (NOD-AtoN), or neutral water (NOD-N) drinking water (upper left) at pre-insulitis (5 weeks), post-insulitis, but before overt diabetes (10–13 weeks), and advanced progression of disease (16–20 weeks). Bacterial populations of Lactobacillus sp. (upper right), Bacteroides sp. (lower left), and C. coccoides (lower right) in the feces of female NOD-A (white, n=8–10), NOD-AtoN (striped, n=5), or NOD-N, black, n=8–10) mice. (B) Analysis of fecal microbial populations between 2-week-old NOD-A and NOD-N mice comparing numbers of total bacteria, Lactobacillus sp., Bacteroides sp., and C. coccoides (NOD-A, n=4, NOD-N, n=5). Significance was determined using Welches’ t-test at p<0.05. Significance is indicated by *- NOD-A vs NOD-N, †- NOD-A vs NOD-AtoN, and ‡- NOD-N vs NOD-AtoN.
Figure 4.
Figure 4.
NOD mice on neutral drinking water (NOD-N) have similar percentages of CD4+Foxp3+ Tregs, but decreased expression levels of Foxp3 as mice on acidic water (NOD-A). (A and B) The percentage of CD4+Foxp3+ Tregs in splenocytes (Sp) and small intestinal (SI) and colonic (Co) lamina propria (LP) lymphocytes from NOD-A and NOD-N mice at 2 weeks (NOD-A, n=5, NOD-N, n=6, left panel) and 8–10 weeks (NOD-A, n=4, NOD-N, n=4, right panel). (C and D) Mean fluorescence intensity (MFI) of Foxp3 expression in 2-week- (left panel) and 8–10-week-old (right panel) NOD-A and NOD-N mice. Significance was determined using Welches’ t-test at p<0.5. Absolute numbers of cells in each population can be seen in Figure S2.
Figure 5.
Figure 5.
NOD mice on neutral drinking water (NOD-N) have decreased production of IL17 by CD4+ T cells as compared with mice on acidic water (NOD-A). (A) The percentage of CD4+ splenocytes and lymphocytes from the small intestine (SI) and colonic (Co) lamina propria (LP) of 2-week-old (left panel) and 8–10-week-old (right panel) NOD-A (open squares) and NOD-N (closed circles) mice. (B-C) Percentages of CD4+ lymphocytes that were also (B) IL17 or (C) IFNγ+. (D) Comparison of the ratio of CD4+IL17+ and CD4+IFNγ+ cells in 2-week-old (left panel) and 8–10-week-old (right panel) NOD-A and NOD-N mice. At 2 weeks: NOD-A, n=5; NOD-N, n=6. At 8–10 weeks: NOD-A, n=4; NOD-N, n=4). Significance was determined using Welches’ t-test at p<0.5. Absolute numbers of cells in each population can be seen in Figure S2.

References

    1. Atarashi K, Tanoue T, Shima T, Imaoka A, Kuwahara T, Momose Y, Cheng G, Yamasaki S, Saito T, Ohba Y, Taniguchi T, Takeda K, Hori S, Ivanov II, Umesaki Y, Itoh K, Honda K. (2011). Induction of colonic regulatory T cells by indigenous Clostridium species. Science 331:337-341 - PMC - PubMed
    1. Atkinson MA, Chervonsky A. (2012). Does the gut microbiota have a role in type 1 diabetes? Early evidence from humans and animal models of the disease. Diabetologia 55:2868-2877 - PMC - PubMed
    1. Barman M, Unold D, Shifley K, Amir E, Hung K, Bos N, Salzman N. (2008). Enteric salmonellosis disrupts the microbial ecology of the murine gastrointestinal tract. Infect Immun 76:907-915 - PMC - PubMed
    1. Bettini M, Vignali DA. (2011). T cell-driven initiation and propagation of autoimmune diabetes. Curr Opin Immunol 23:754-760 - PMC - PubMed
    1. Bradshaw EM, Raddassi K, Elyaman W, Orban T, Gottlieb PA, Kent SC, Hafler DA. (2009). Monocytes from patients with type 1 diabetes spontaneously secrete proinflammatory cytokines inducing Th17 cells. J Immunol 183:4432-4439 - PMC - PubMed

Publication types

MeSH terms