. 2014 Feb 4;111(5):E582-91.
doi: 10.1073/pnas.1318114111. Epub 2014 Jan 22.

Sel1L is indispensable for mammalian endoplasmic reticulum-associated degradation, endoplasmic reticulum homeostasis, and survival

Affiliations

Sel1L is indispensable for mammalian endoplasmic reticulum-associated degradation, endoplasmic reticulum homeostasis, and survival

Shengyi Sun et al. Proc Natl Acad Sci U S A. .

Erratum in

  • Proc Natl Acad Sci U S A. 2014 Apr 22;111(16):6115

Abstract

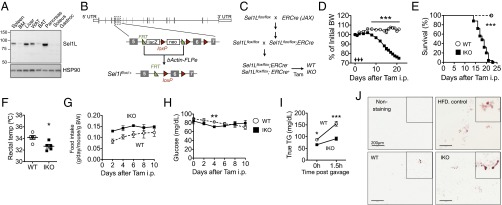
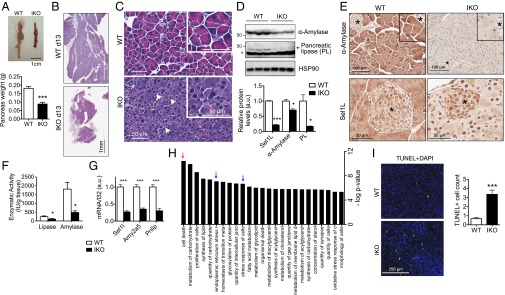
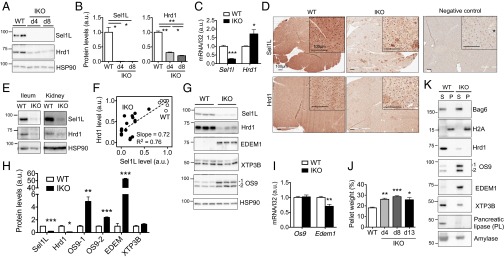
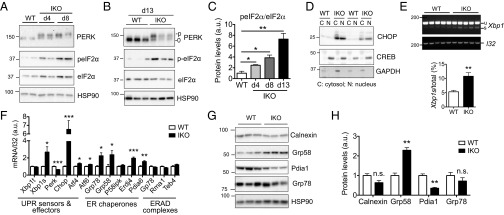
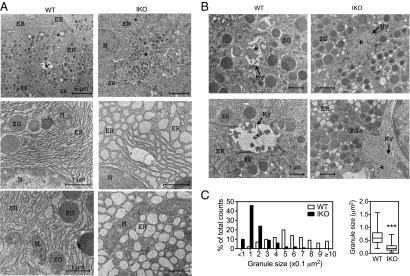
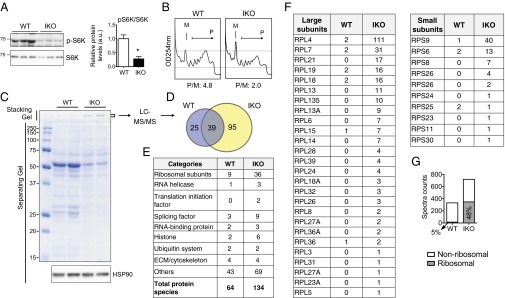
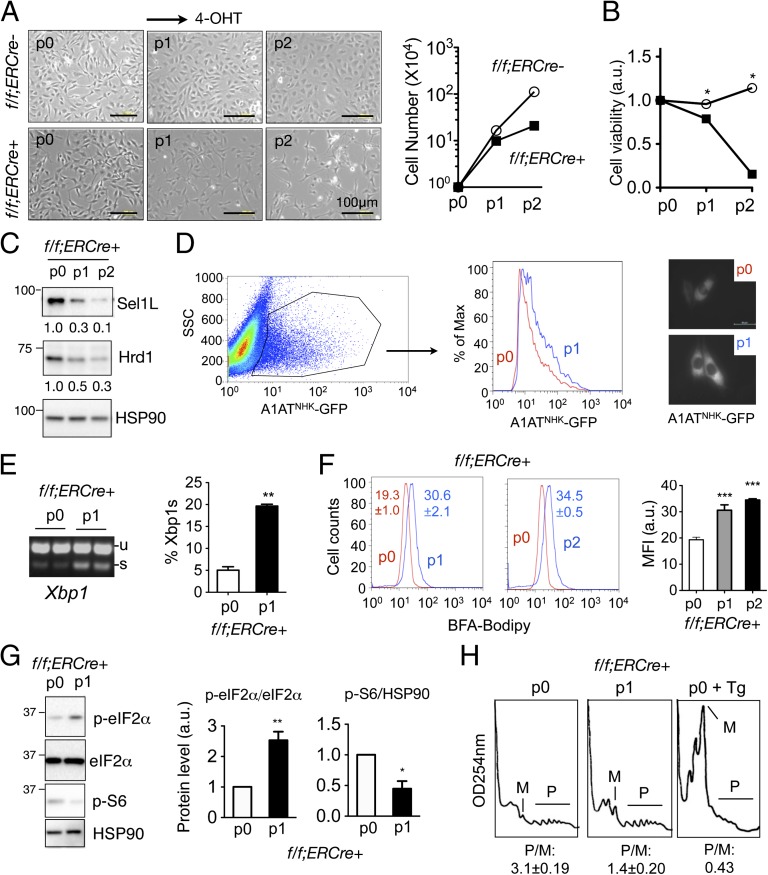
Suppressor/Enhancer of Lin-12-like (Sel1L) is an adaptor protein for the E3 ligase hydroxymethylglutaryl reductase degradation protein 1 (Hrd1) involved in endoplasmic reticulum-associated degradation (ERAD). Sel1L's physiological importance in mammalian ERAD, however, remains to be established. Here, using the inducible Sel1L knockout mouse and cell models, we show that Sel1L is indispensable for Hrd1 stability, ER homeostasis, and survival. Acute loss of Sel1L leads to premature death in adult mice within 3 wk with profound pancreatic atrophy. Contrary to current belief, our data show that mammalian Sel1L is required for Hrd1 stability and ERAD function both in vitro and in vivo. Sel1L deficiency disturbs ER homeostasis, activates ER stress, attenuates translation, and promotes cell death. Serendipitously, using a biochemical approach coupled with mass spectrometry, we found that Sel1L deficiency causes the aggregation of both small and large ribosomal subunits. Thus, Sel1L is an indispensable component of the mammalian Hrd1 ERAD complex and ER homeostasis, which is essential for protein translation, pancreatic function, and cellular and organismal survival.

Keywords: ER dilation; ERAD tuning; exocrine pancreatic insufficiency; inducible ERAD-deficient models; stress granule.


Conflict of interest statement

The authors declare no conflict of interest.

Figures

Fig. 1.
Fig. 1.
Early lethality and nutrient malabsorption in Sel1LIKO mice. (A) Western blot analysis of Sel1L in different tissues from WT mice. Gastroc, gastrocnemius; BM, bone marrow; WAT/BAT, white/brown adipose tissue; HSP90, a loading control. (B) Diagram illustrating the generation of Sel1Lflox/+ animals. Gray boxes, exons. The loxP sites flank the exon 6. (C) Diagram illustrating the generation of Sel1Lflox/flox;ERCre mice. ERCre, estrogen-receptor-controlled Cre. (D) Body weight change after three daily injections of tamoxifen in adult mice. Arrows point to three consecutive tamoxifen injection. WT, n = 20; IKO, n = 29. (E) Surviving curve of WT and IKO mice after tamoxifen injection. WT n = 16; IKO n = 25. ***P < 0.001 by the log-rank (Mantel–Cox) test. (F) Rectal body temperature at day 13 (n = 5). (G) Food intake after tamoxifen injection (n = 5). (H) Blood glucose levels (ad libitum) after tamoxifen injection (n = 5). (I) Serum Triglyceride (TG) levels before and at 1.5 h postlipid gavage in WT and IKO mice. n = 5 each. (J) Oil-red O staining of fecal smear from WT and IKO mice. Nonstained and stained fecal smear slides from 2 mo high-fat diet (HFD) -fed mice were used as negative and positive controls, respectively. Representative pictures of four mice each group shown. Data are mean ± SEM. *P < 0.05, **P < 0.01, ***P < 0.001 by Student t test, except for E. Representative data of at least two experiments shown.
Fig. 2.
Fig. 2.
Exocrine pancreatic insufficiency and increased cell death in the pancreas of Sel1LIKO mice. Experiments were performed at day 13. (A) Picture of WT and IKO pancreas from male mice. Each picture represents five mice each group. (B) H&E images showing pancreatic atrophy in IKO mice. (C) H&E images showing reduced eosinophilic zymogen staining, different nuclei sizes (arrowheads), and binucleated cells. (D) Western blot analysis of various pancreatic enzymes with quantitation shown below. Asterisk indicates the nonspecific band. Each lane represents one mouse. (E) Immunohistochemistry of amylase and Sel1L. n = 3–5 each group. Asterisk denotes an islet. Note Sel1L deletion is largely limited in the exocrine pancreas. (F) Enzymatic activities in WT and IKO pancreas. n = 5 each group. (G) qPCR analysis of genes in the pancreas. n = 5 each. Amy2a5, amylase 2a5; Pnlip, pancreatic lipase. (H) Ingenuity analysis showing top 25 significantly changed functional annotations between WT and IKO pancreas (day 13, n = 4 mice each) with a threshold of fold change >1.5 or <−1.5 and q value <0.01. Red arrow, cell death; blue arrows, stress responses. (I) Confocal images of TUNEL staining (green) with nuclei stained with DAPI. Positive/negative controls shown in Fig. S5A. Quantitation of TUNEL-positive cells in 40 random views under 20× magnification shown on the right. Data are mean ± SEM. *P < 0.05, ***P < 0.001 by Student t test. Representative data of at least two experiments shown.
Fig. 3.
Fig. 3.
Sel1L is indispensable for the stability of Sel1L-Hrd1 complex in vivo. Pancreas was harvested at days 4, 8, and 13. (A) Western blot analysis of Sel1L and Hrd1 in WT and IKO pancreas at day 4 and 8, with quantitation shown in B upon being normalized to the loading control HSP90. (C) qPCR analysis of Sel1L and Hrd1 genes at day 13; n = 5. (D) Immunohistochemical staining of Sel1L and Hrd1 in pancreas at day 13; n = 3 each. (E) Western blot analysis of Sel1L and Hrd1 in the ileum and kidney of IKO mice. (F) Linear regression analysis between Hrd1 and Sel1L protein levels in various WT or Sel1L-deficient tissues and cell lines, including pancreas, gut, kidney, and MEFs. See SI Materials and Methods for details. Each dot represents one sample (n = 25). The slope of the regression line and the square of the correlation coefficient (R2) are shown. (G) Western blot analysis of Sel1L-associated factors (EDEM1, OS9, and XTP3B) in WT and IKO pancreas at day 13 with quantitation shown in H. (I) qPCR analysis of Edem1 and Os9 in the pancreas at day 13. (J) Percentage of Nonidet P-40 insoluble pellet weight in total tissue weight at the indicated times following tamoxifen injection; n = 2–6. WT samples were pooled from two samples of day 8 and four samples of day 13. (K) Western blot analysis of various proteins in the NP40P and NP40S fractions of pancreas at day 13 using lysis buffer containing 0.5% Nonidet P-40. The distribution of Bag6 and H2A marks the soluble (S) and insoluble (P) fractions, respectively. Representative data of three samples each shown. Data are mean ± SEM. *P < 0.05, **P < 0.01, ***P < 0.001 by Student t test. Representative data of two experiments shown.
Fig. 4.
Fig. 4.
Sel1L is required for ER homeostasis in the exocrine pancreas. Pancreas were harvested at the indicated times. (A and B) Western blot analysis of PERK activation in WT and IKO pancreas at days 4 and 8 (A) and 13 (B). HSP90, loading control. (C) Quantitation of A and B. (D) Western blot analysis of CHOP in cytosolic (C) and nuclear (N) fractions of the pancreas. CREB and GAPDH represent nuclear and cytosolic makers, respectively. (E) RT-PCR analysis of Xbp1 splicing with the quantitation of the ratio of Xbp1s to total Xbp1 mRNA shown below. (F) qPCR analysis of UPR and ERAD-related genes. (G) Western blot analysis of various chaperones in pancreas at day 13 with quantitation shown in H. Data are mean ± SEM. *P < 0.05, **P < 0.01, ***P < 0.001 by Student t test. n = 3 mice each group except RT-PCR where n = 5. Representative data of two experiments shown.
Fig. 5.
Fig. 5.
Dilated ER and smaller zymogen granules in the exocrine pancreas of Sel1LIKO mice. Pancreas was harvested at day 12. (A) Representative TEM images of exocrine pancreas of WT and IKO mice showing a profound dilation of the ER. (B) Representative TEM images of exocrine pancreas of WT and IKO mice showing smaller secretory granules. Asterisks indicate the acinar lumen; N, nucleus; M, mitochondrion; ZG, zymogen granules; ER, endoplasmic reticulum; and Mv, Microvillus. Scale bar shown. (C) Quantitation of granule sizes in 100 granules each genotype in histogram (Left) and Whiskers plot (Right). In the Whiskers plot, the medium, the 25th to 75th percentiles and the minimum to maximum range of granule sizes are shown. n = 3 mice each group. Data are mean ± SEM. ***P < 0.001 by Student t test.
Fig. 6.
Fig. 6.
Reduced translation and increased ribosomal aggregation in the exocrine pancreas of Sel1LIKO mice. (A) Western blot analysis of (p)-S6K in of pancreas at day 13. Quantitation shown on the right. Data are mean ± SEM. *P < 0.05 by Student t test. (B) Polysome profiling analysis of the kidneys of WT and IKO mice at day 13. M, monosomes; P, polysomes; P/M, ratio of polysomes to monosomes based on quantitation of area under curve of each fraction. (C) Coomassie blue-stained SDS/PAGE gel of WT and IKO pancreatic lysates (loaded at an equal tissue weight) at day 13. Note stronger signals in the stacking gel of the IKO samples, which were sliced and subjected to LC-MS/MS analysis (D–G). HSP90, a loading control. (D) Venn diagram showing the overlap of hits in WT and IKO samples identified by the LC-MS/MS analysis. Complete list of hits shown in Table S1. (E) Functional categories of the hits. (F) Spectra counts of ribosomal subunits. RPL and RPS, 60S and 40S ribosomal subunits, respectively. (G) Diagram showing spectral counts of ribosomal and nonribosomal proteins. The percent of counts from ribosomal proteins were 5% in WT (15 of 332) and 48% in IKO (348 of 720), which accounted for the increased total spectral counts in IKO sample.
Fig. 7.
Fig. 7.
Sel1L is indispensable for Hrd1 stability, cellular growth, and ER homeostasis in vitro. (A) Microscopic images of f/f;ERCre and f/f;ERCre+ MEFs at day 4 of different passages (p). p0, vehicle (ethanol) treated; p1/2, 4-OHT treated. Quantitation of cell number from one experiment (representative of two) shown on the right. (B) Cell viability analysis as measured by CCK-8 of MEFs at day 4 of each passage. (C) Western blot analysis of Sel1L and Hrd1 in f/f;ERCre+ MEFs at day 4 of each passages. Quantitation from one representative experiment of at least three repeats shown below the gel. (D) Flow cytometric analysis of transfected A1ATNHK-GFP in p0 or p1 Sel1LIKO MEFs. GFP+ cells from each passage were gated and overlaid in the histogram (n = 3). Representative microscopic images shown on the right. Scale bar, 50 μm. (E) Xbp-1 mRNA splicing of MEFs at day 4. Quantitation of the percent of Xbp1s in total Xbp1 mRNA shown on the right. (F) Flow cytometric analysis of the ER/Golgi volume in MEFs stained with BFA-Bodipy at each passage. Quantitation of mean fluorescence intensity shown on the right. (G) Western blot analysis of eIF2α and S6 phosphorylation in MEFs at day 4 of each passage. HSP90, a loading control. Quantitation from three experiments shown on the right. (H) Polysome profiling of f/f;ERCre+ MEFs at p0 and p1. Tg (300 nM, 2 h)-treated p0 MEFs were included as a positive control for ER stress. M, monosomes; P, polysomes; P/M, ratio of polysomes to monosomes based on the quantitation of area under curve of respective fraction. Data are mean ± SEM. *P < 0.05, **P < 0.01, ***. P < 0.01 compared with WT. Representative data of at least two experiments shown.

Similar articles

Cited by

References

    1. Chiti F, Dobson CM. Protein misfolding, functional amyloid, and human disease. Annu Rev Biochem. 2006;75:333–366. - PubMed
    1. Olzmann JA, Kopito RR, Christianson JC. The mammalian endoplasmic reticulum-associated degradation system. Cold Spring Harb Perspect Biol. 2013;5(9) - PMC - PubMed
    1. Brodsky JL. Cleaning up: ER-associated degradation to the rescue. Cell. 2012;151(6):1163–1167. - PMC - PubMed
    1. Hampton RY, Sommer T. Finding the will and the way of ERAD substrate retrotranslocation. Curr Opin Cell Biol. 2012;24(4):460–466. - PubMed
    1. Walter P, Ron D. The unfolded protein response: From stress pathway to homeostatic regulation. Science. 2011;334(6059):1081–1086. - PubMed

Publication types

MeSH terms

Associated data