. 2014 Feb 15;192(4):1502-11.
doi: 10.4049/jimmunol.1203425. Epub 2014 Jan 22.

Embryonic trophoblasts induce decidual regulatory T cell differentiation and maternal-fetal tolerance through thymic stromal lymphopoietin instructing dendritic cells

Affiliations

Embryonic trophoblasts induce decidual regulatory T cell differentiation and maternal-fetal tolerance through thymic stromal lymphopoietin instructing dendritic cells

Mei-Rong Du et al. J Immunol. .

Abstract

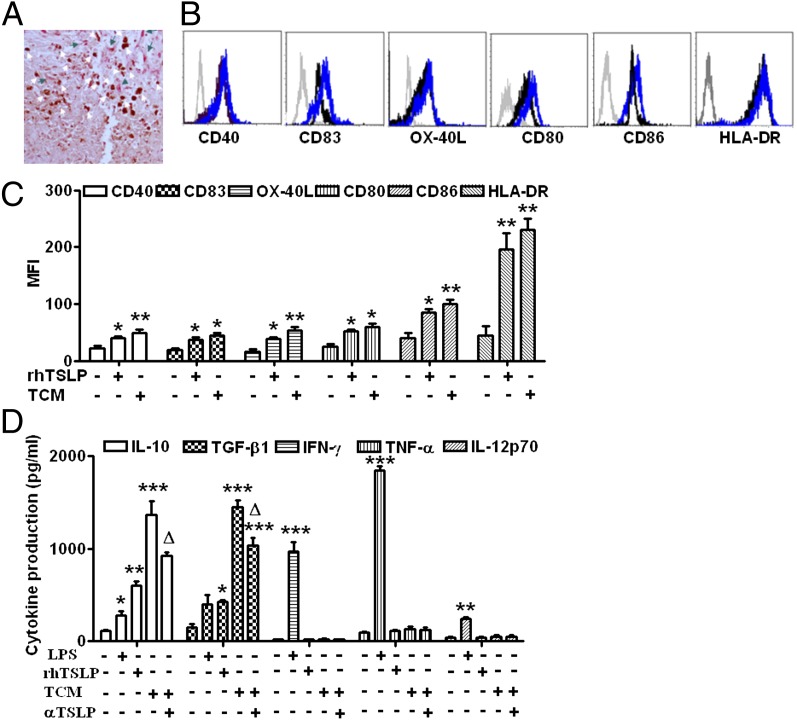
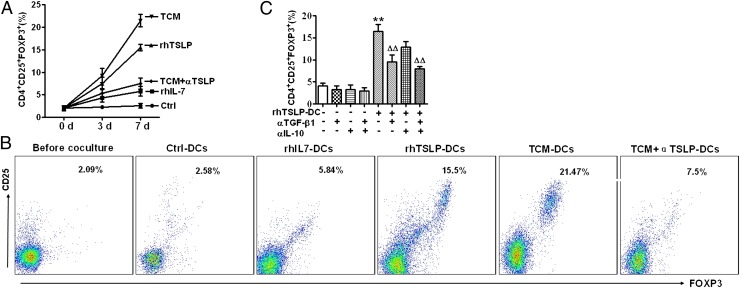
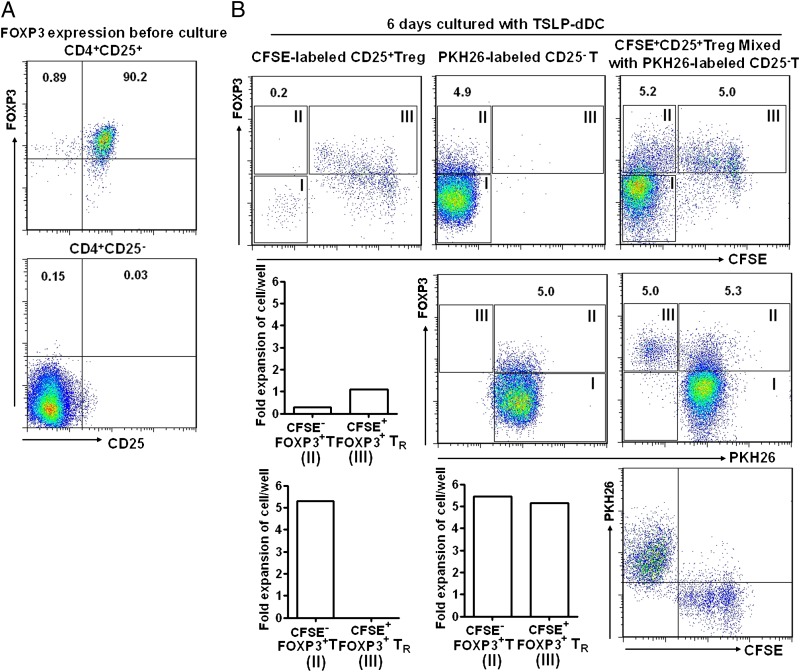
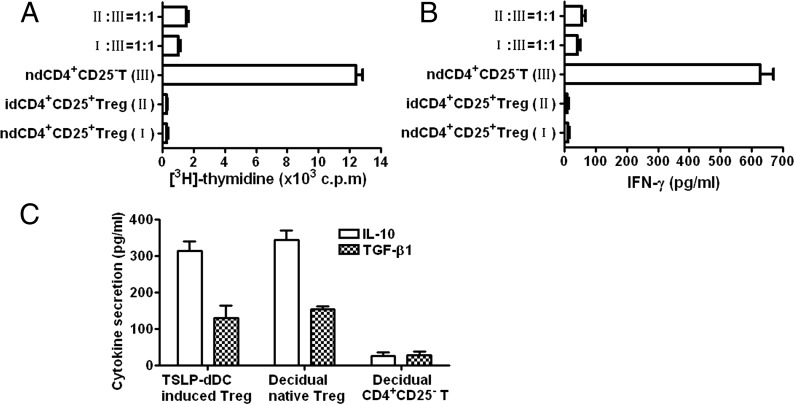
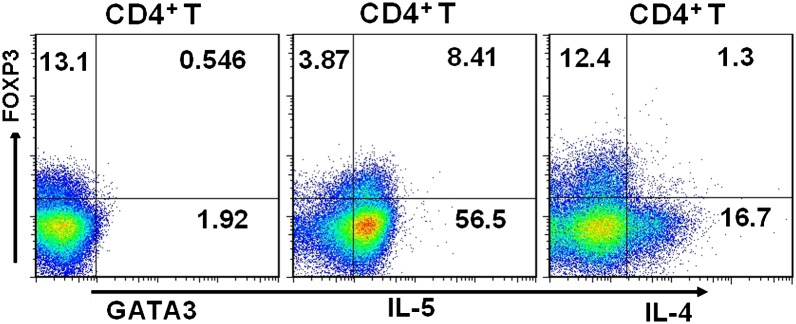
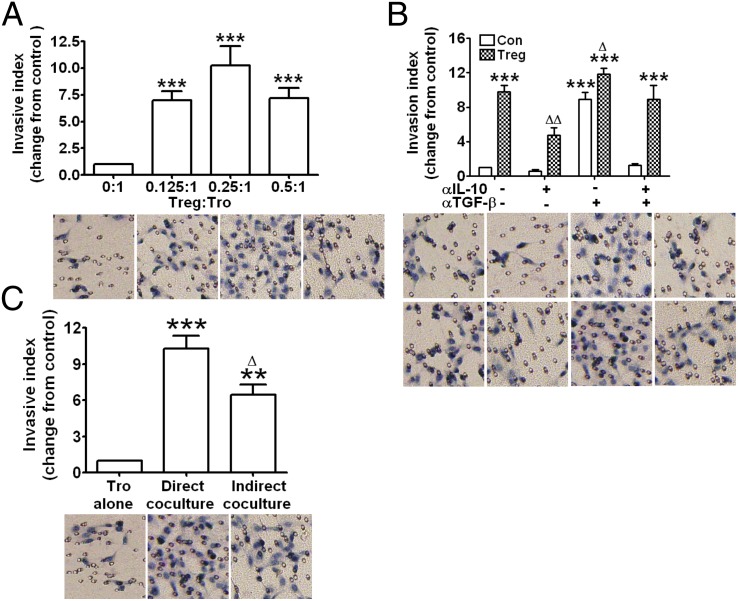
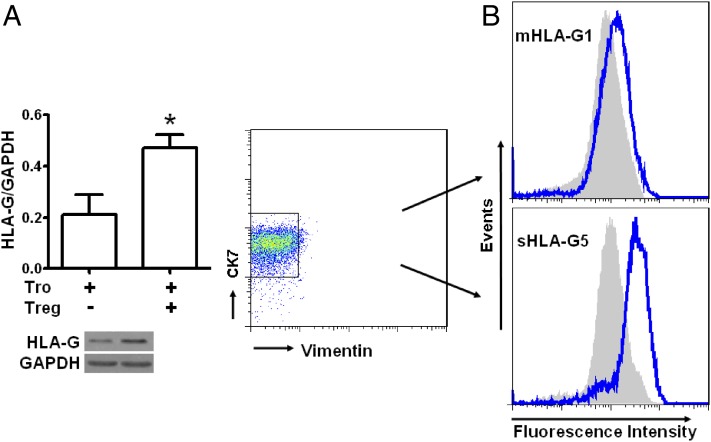
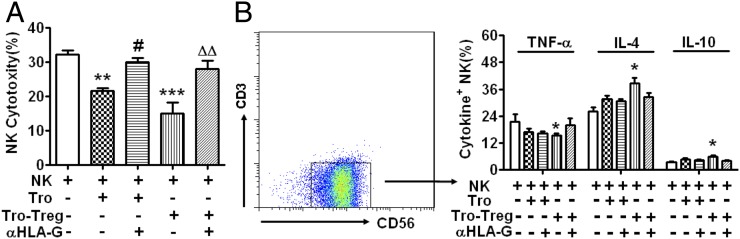
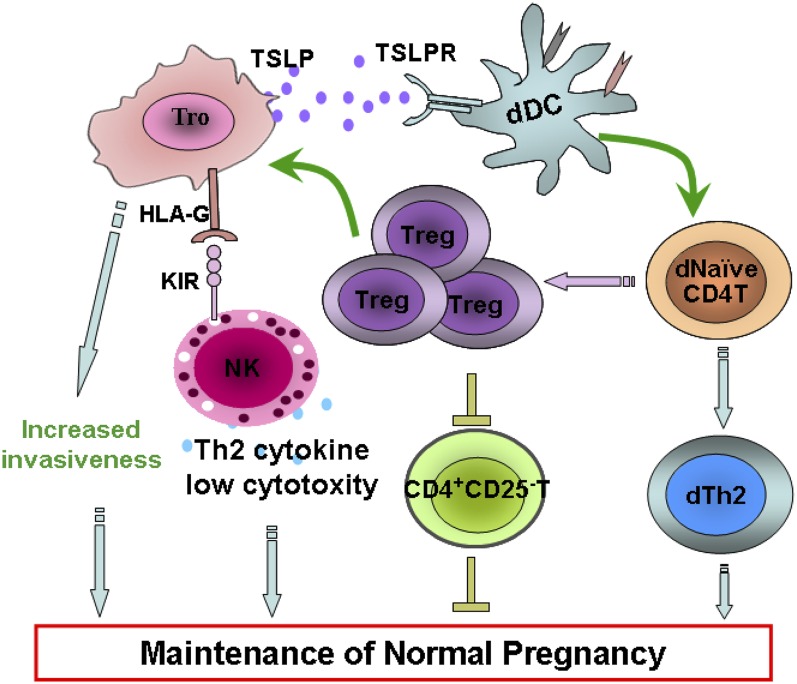
Physiological pregnancy requires the maternal immune system to recognize and tolerate embryonic Ags. Although multiple mechanisms have been proposed, it is not yet clear how the fetus evades the maternal immune system. In this article, we demonstrate that trophoblast-derived thymic stromal lymphopoietin (TSLP) instructs decidual CD11c(+) dendritic cells (dDCs)with increased costimulatory molecules; MHC class II; and Th2/3-type, but not Th1-type, cytokines. TSLP-activated dDCs induce proliferation and differentiation of decidual CD4(+)CD25(-) T cells into CD4(+)CD25(+)FOXP3(+) regulatory T cells (Tregs) through TGF-β1. TSLP-activated dDC-induced Tregs display immunosuppressive features and express Th2-type cytokines. In addition, decidual CD4(+)CD25(+)FOXP3(+) Tregs promote invasiveness and HLA-G expression of trophoblasts, resulting in preferential production of Th2 cytokines and reduced cytotoxicity in decidual CD56(bright)CD16(-) NK cells. Of interest, decreased TSLP expression and reduced numbers of Tregs were observed at the maternal-fetal interface during miscarriage. Our study identifies a novel feedback loop between embryo-derived trophoblasts and maternal decidual leukocytes, which induces a tolerogenic immune response to ensure a successful pregnancy.


Figures

FIGURE 1.
FIGURE 1.
Trophoblast-derived TSLP activates decidual CD11c+ DCs. (A) The close association between TSLP+ trophoblasts (pink cells indicated by white arrows) and CD11c+ DCs (brown cells indicated by green arrows) is shown by TSLP and CD11c+ DC double staining in human decidua. (B and C) CD40, CD83, OX-40L, CD80, CD80, CD86, and HLA-DR expression was determined by FCM with gating on CD11c+ cells (B) after dDCs were stimulated with TSLP, trophoblast culture media, or media alone (control) for 24 h. The numbers in the histograms (C) indicate MFI. (D) Production of IL-10, TGF-β1, IFN-γ, TNF-α, and IL-12p70 (the heterodimeric biologically active form of IL-12) by dDCs was determined by ELISA. Results are shown from three independent experiments with three different samples from 3 decidua and 15 villi. Data are shown as mean ± SE. A representative graph is shown. *p < 0.05, **p < 0.01, and ***p < 0.001 compared with control; p < 0.05 compared with TCM. One-way ANOVA with Bonferroni posttests was used for (C), and two-way ANOVA with Bonferroni posttests was used in (D). αTSLP, neutralizing Ab against TSLP.
FIGURE 2.
FIGURE 2.
TSLP-DCs induce expansion of CD4+CD25+FOXP3+ T cells from decidual CD4+CD25 T cells in vitro. (A) Purified CD4+CD25 T cells were incubated with DCs pretreated with PBS, rhIL-7, rhTSLP, or TCM or with TCM combined with αTSLP-DCs at a 1:6 ratio of DCs to T cells for 3 or 7 d. Cells were analyzed by FCM gating of CD4+ cells. (A) Percentages of CD4+CD25+FOXP3+ T cells are indicated. (B) Representative FCM data after 7 d of culture are presented. (C) Percentages of CD4+CD25+FOXP3+ T cells determined by FCM following 7-d coculture of decidual CD4+CD25 T cells with or without rhTSLP-DCs in the presence or absence of anti–TGF-β1 or anti–IL-10 neutralizing Abs or isotype control. Results are shown from three independent experiments with three different deciduas and 17 villi. Data are shown as mean ± SE. A representative graph is shown. *p < 0.05 and **p < 0.01 compared with control; △△p < 0.01 compared with rhTSLP-DC. Two-way ANOVA with Bonferroni posttests was used in (C). αIL-10, neutralizing Ab against IL-10; αTGF-β1, neutralizing Ab against TGF-β1; Ctrl, control.
FIGURE 3.
FIGURE 3.
TSLP-dDCs induce generation of CD4+FOXP3+ Tregs from CD4+CD25FOXP3 T cells, but not from contaminating CD4+CD25+FOXP3+ cells in sorted CD4+CD25 T cells. (A) FCM analysis of FOXP3 expression on sorted CD4+CD25+ and CD4+CD25 T cells before culture. The numbers in dot plots indicate the percentages of FOXP3+ T cells. (B) CFSE-labeled CD4+CD25+ T cells, PKH26-labeled CD4+CD25 T cells, and a mixture of the two populations were cocultured with TSLP-dDCs at a 1:9 CD25+:CD25 cell ratio. After 6 d of culture, FOXP3 expression on each population was analyzed by FCM. The numbers in dot plots indicate the percentages of PKH26-labeled FOXP3+ cells (gate II). The dot plot at the bottom right was gated from FOXP3+ cells in a mixture of the CFSE-labeled CD4+CD25+ T cells, PKH26-labeled CD4+CD25 T cells at a 1:9 CD25+:CD25 cell ratio. Fold expansions are shown for PKH26-labeled FOXP3+ cells (gate II) and CFSE-labeled FOXP3+ cells (gate III) in the bar graph. Data are representative of three experiments with three different deciduas.
FIGURE 4.
FIGURE 4.
TSLP-DC–induced CD4+CD25+FOXP3+ T cells display features of Tregs. TSLP-DC–induced CD4+CD25+FOXP3+ T cells, decidual naive CD4+CD25+ T cells, CD4+CD25 cells, or their mixtures were restimulated with anti-CD3 and anti-CD28 Abs. (A) Suppressive function assessed by [3H]-thymidine incorporation. (B) Quantification of IFN-γ secreted by CD4+ T cells. (C) Quantification of IL-10 and TGF-β1 secreted by different CD4+ T cells as indicated. Results are shown from three independent experiments with three different deciduas. Data are shown as mean ± SE. A representative graph is shown.
FIGURE 5.
FIGURE 5.
TSLP-dDC–induced decidual CD4+CD25+FOXP3+ T cells produce Th2 cytokines. Decidual CD4+FOXP3+ T cells generated by TSLP-DC were processed for FCM analysis after staining for IL-4 or IL-5, CD4, FOXP3, and GATA3. Decidual CD4+CD25 T cells were cultured with TSLP-dDCs for 7 d. Cultured cells were then stimulated with PMA and ionomycin. Expression levels of cell surface CD4 and intracellular IL-4, IL-5, FOXP3, and GATA3 at the single-cell level were analyzed by FCM. In parallel experiments, the polarizations of Th1 and Th2 were induced as the positive and negative controls for the positivity gates identifying GATA3+ cells, IL-5+ cells, and IL-4+ cells. Results are shown from three independent experiments with three different deciduas. The dot plots are representative of three experiments with three different deciduas.
FIGURE 6.
FIGURE 6.
TSLP-dDC—induced decidual CD4+CD25+FOXP3+ T cells improve invasiveness of human trophoblasts. The invasiveness of primary trophoblasts in different treatment conditions for 48 h was evaluated by Transwell invasion assay. The invasion index of human primary trophoblasts cocultured with different ratios of Tregs and/or with neutralizing Abs for IL-10 and TGF-β1 was normalized to that of control trophoblasts alone. (A) Trophoblast invasiveness was enhanced by TSLP-dDC–induced CD4+FOXP3+ Tregs in a ratio-dependent manner. (B) Addition of IL-10 neutralizing Ab inhibited basal and Treg-stimulated trophoblast invasiveness. TGF-β1 neutralizing Ab enhanced basal invasiveness and magnified the Treg-stimulated trophoblast invasiveness. (C) The invasive index was even higher in the coculture system with direct cell contact compared with the indirect cell contact coculture system. Results are shown from three independent experiments with three different samples with 3 deciduas and 22 villi. Data are shown as mean ± SE. A representative graph is shown. **p < 0.01 and ***p < 0.001 compared with the control (trophoblasts alone). p < 0.05 and △△p < 0.01 compared with Treg–trophoblast direct cell contact coculture system. The t test one-way ANOVA with Bonferroni posttests was used for (A), and two-way ANOVA with Bonferroni posttests was used in (B) and (C).
FIGURE 7.
FIGURE 7.
dTregs upregulate HLA-G expression in human primary trophoblasts. Primary trophoblasts were cultured in Matrigel-precoated six-well plates in the presence or absence of dTregs for 24 h. Trophoblasts were washed with PBS twice after discarding floating T cells. Expression levels of HLA-G by trophoblast cells were determined by Western blot with 87G (A) and FCM analysis with MEM-G/9 (B, upper panel) and 5A6G7 (B, lower panel). The blue and gray histograms represent HLA-G fluorescence intensities of trophoblasts cocultured with or without Tregs, respectively, as determined by FCM analysis. Results are shown from three independent experiments with 3 different deciduas and 13 villi. Data are shown as mean ± SE. The representative graph is shown. *p < 0.05 compared with NK culture alone. Tro, trophoblasts; Tro–Tregs, trophoblasts instructed by Tregs for 24 h.
FIGURE 8.
FIGURE 8.
HLA-G is involved in the modulation of dNK cells by dTreg-instructed primary human trophoblasts. Primary trophoblasts were cultured in Matrigel-precoated six-well plates in the presence or absence of dTregs for 24 h. Trophoblasts were washed with PBS twice after removing floating T cells. The coculture included dNKs and trophoblasts at a 1:1 ratio. dNK cells were harvested after 48 h for dNK cell cytotoxicity assays or to measure intracellular cytokines by FCM. (A) The cytotoxicity of dNK cells was significantly decreased when cocultured with trophoblasts, especially with dTreg-instructed trophoblasts. Neutralizing Abs against HLA-G abrogated this decrease. (B) Treg-instructed trophoblasts increased expression of IL-4 and IL-10 and inhibited TNF-α in dNK cells. Neutralizing Abs against HLA-G slightly reversed this upregulation. The FCM plot shows cytokine expression analysis. Results are shown from three independent experiments with 3 different deciduas and 17 villi. Data are shown as mean ± SE. *p < 0.05, **p < 0.01, and ***p < 0.001 compared with NK culture alone. ##p < 0.01 compared with NK cells cultured with Tro. △△p < 0.01 compared with NK cells cultured with Tro–Tregs. αHLA-G, neutralizing Ab for HLA-G; Tro, trophoblasts; Tro–Tregs, trophoblasts instructed by Tregs for 24 h.
FIGURE 9.
FIGURE 9.
Proposed model for crosstalk between embryo trophoblasts and decidual leukocyte subsets at the maternal–fetal interface in human first-trimester pregnancy. TSLP secreted by human trophoblasts instructs dDCs and then induces generation of decidual CD4+CD25+FOXP3+ Tregs in early pregnancy. These cells in turn inhibit proliferation and IFN-γ secretion from CD4+CD25 T cells and increase invasiveness and HLA-G expression in trophoblasts. These alterations decrease cytotoxicity of decidual CD56brightCD16 NK cells and increase expression of inhibitory cytokines. This interactive crosstalk between trophoblasts and decidual leukocytes contributes to maternal immunotolerance toward fetal Ags and placentation.

References

    1. Medawar P. B. 1953. Some immunological and endocrinological problems raised by the evolution of viviparity in vertebrates. Soc. Exp. Biol. 7: 320–328.
    1. Trowsdale J., Betz A. G. 2006. Mother’s little helpers: mechanisms of maternal-fetal tolerance. Nat. Immunol. 7: 241–246. - PubMed
    1. Munoz-Suano A., Hamilton A. B., Betz A. G. 2011. Gimme shelter: the immune system during pregnancy. Immunol. Rev. 241: 20–38. - PubMed
    1. Tilburgs T., Scherjon S. A., Claas F. H. 2010. Major histocompatibility complex (MHC)-mediated immune regulation of decidual leukocytes at the fetal-maternal interface. J. Reprod. Immunol. 85: 58–62. - PubMed
    1. Gobert M., Lafaille J. J. 2012. Maternal-fetal immune tolerance, block by block. Cell 150: 7–9. - PMC - PubMed

Publication types

MeSH terms