. 2014 Jan 22;34(4):1094-104.
doi: 10.1523/JNEUROSCI.1442-13.2014.

Ministrokes in channelrhodopsin-2 transgenic mice reveal widespread deficits in motor output despite maintenance of cortical neuronal excitability

Affiliations

Ministrokes in channelrhodopsin-2 transgenic mice reveal widespread deficits in motor output despite maintenance of cortical neuronal excitability

Eitan Anenberg et al. J Neurosci. .

Abstract

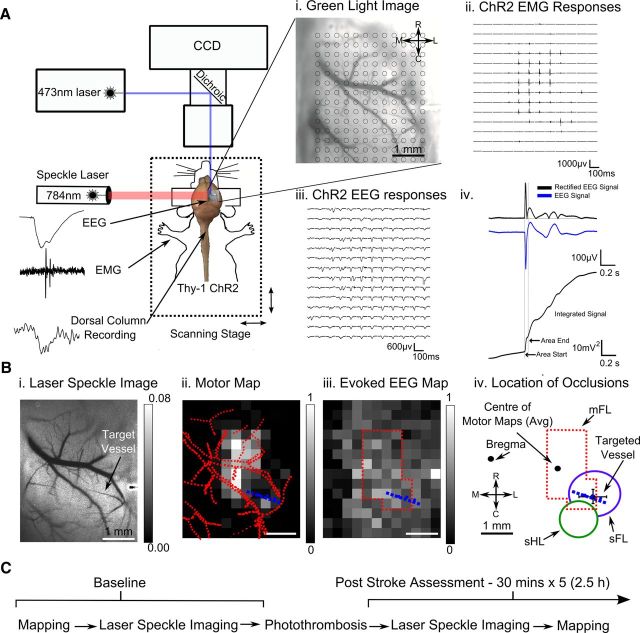
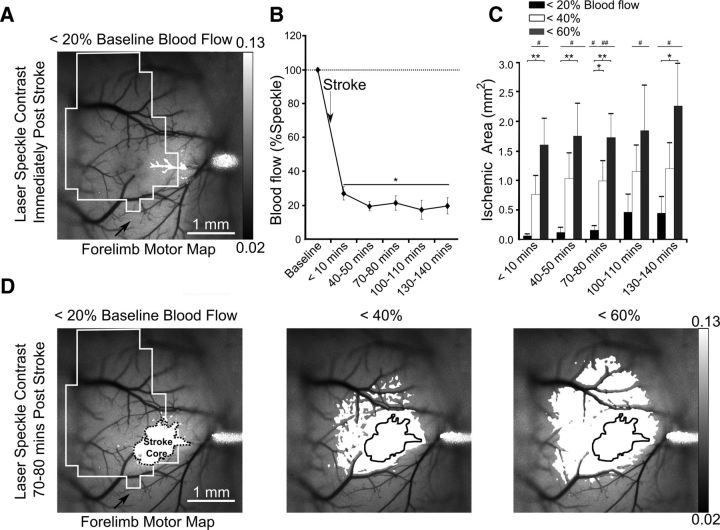
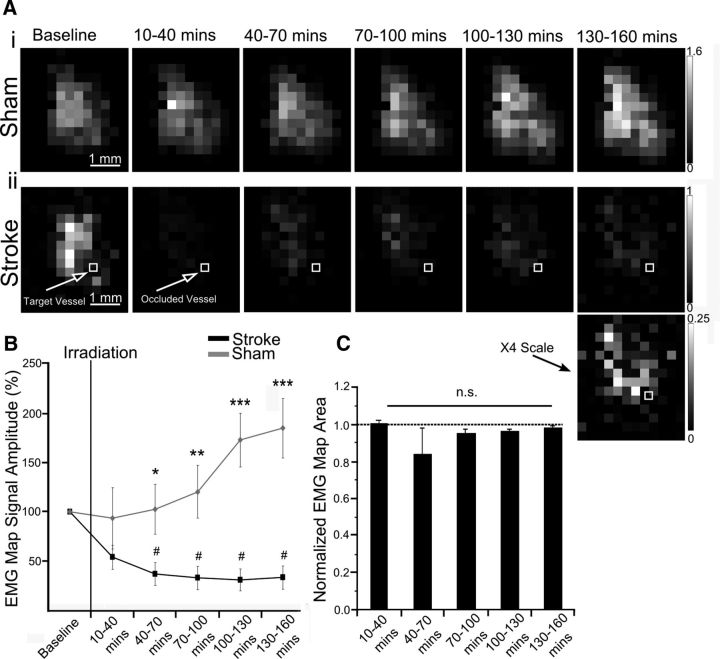
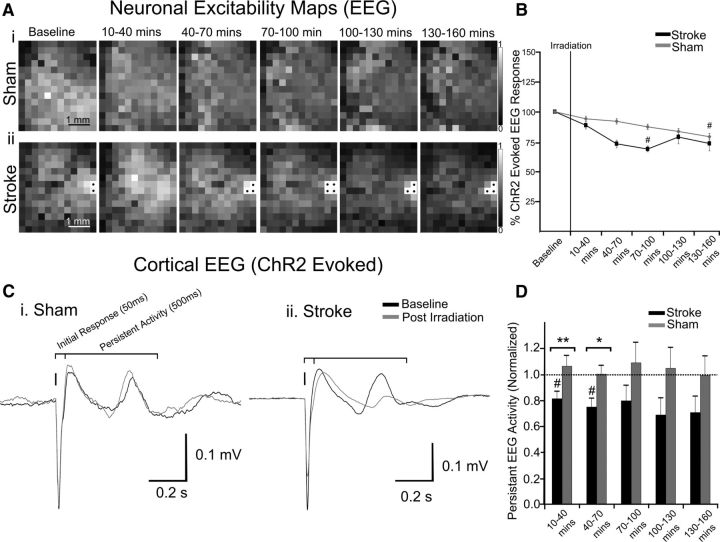
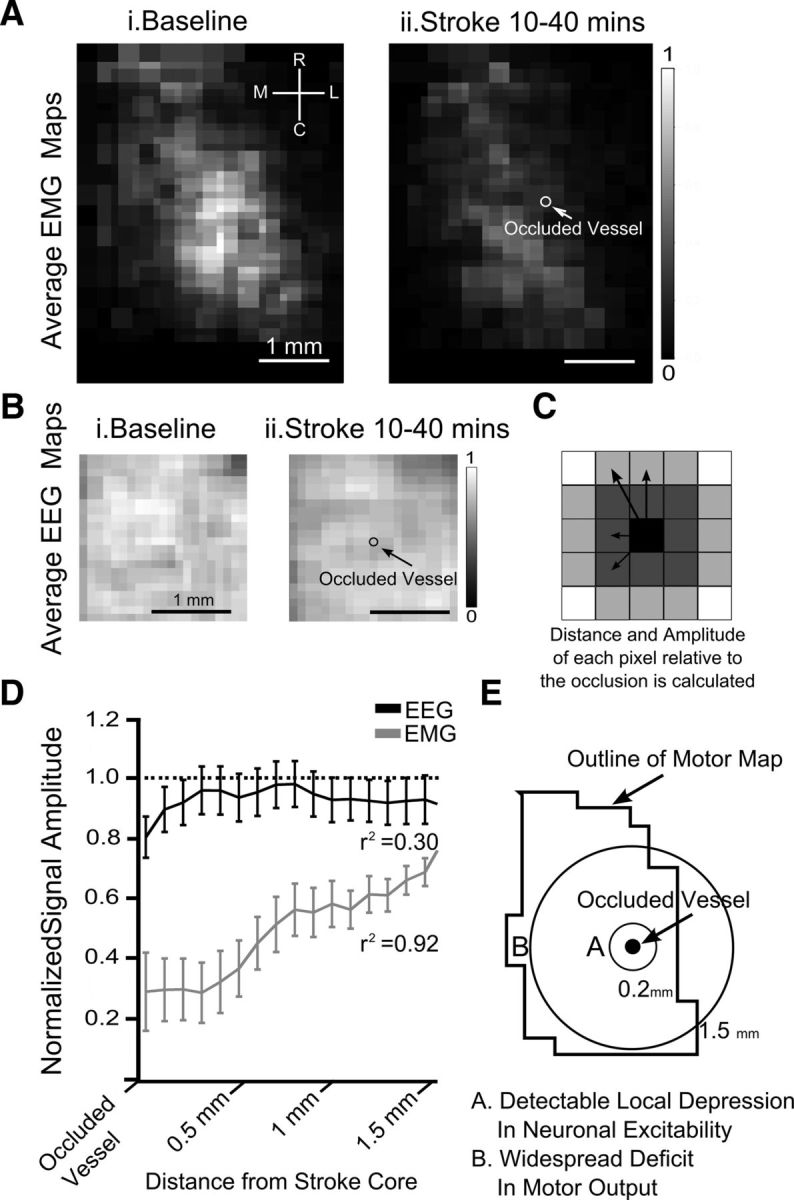
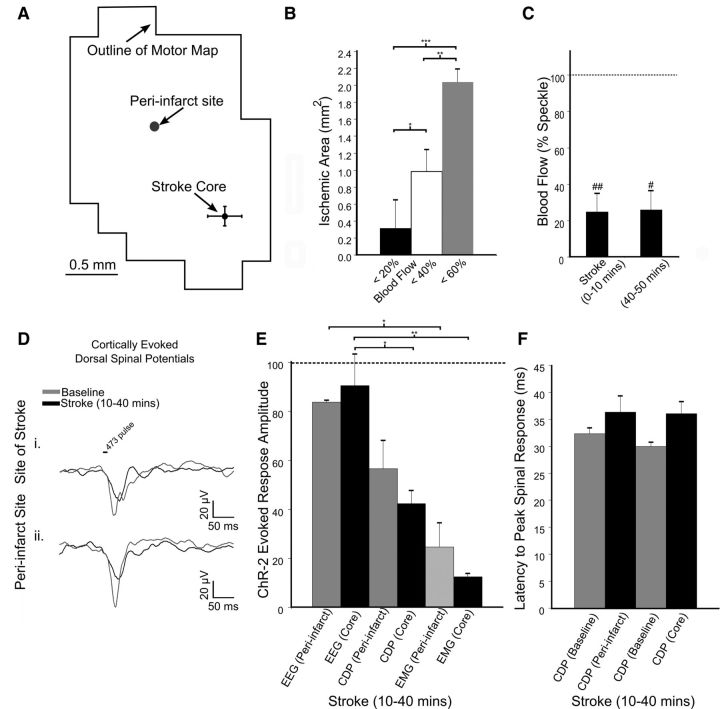
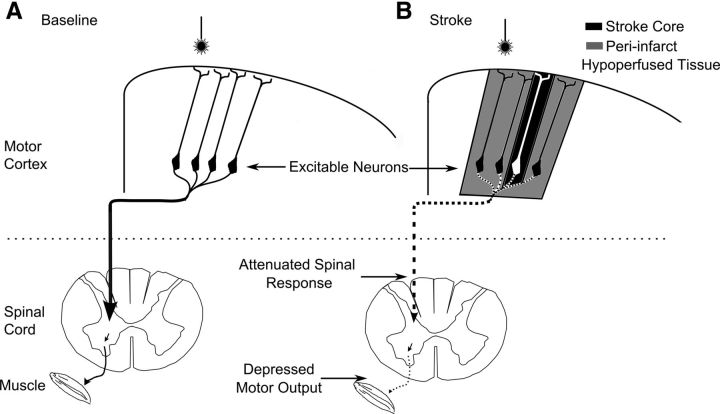
We evaluated the effects of ministrokes targeted to individual pial arterioles on motor function in Thy-1 line 18 channelrhodopsin-2 (ChR2) transgenic mice within the first hours after ischemia. Using optogenetics, we directly assessed both the excitability and motor output of cortical neurons in a manner independent of behavioral state or training. Occlusion of individual arterioles within the motor cortex led to a ministroke that was verified using laser speckle contrast imaging. Surprisingly, ministrokes targeted to a relatively small region of the forelimb motor map, with an ischemic core of 0.07 ± 0.03 mm(2), impaired motor responses evoked from points across widespread areas of motor cortex even 1.5 mm away. Contrasting averaged ChR2-evoked electroencephalographic, spinal (ChR2 evoked potential), and electromyographic responses revealed a mismatch between measures of cortical excitability and motor output within 60 min after stroke. This mismatch suggests that apparently excitable cortical neurons (even >1 mm into peri-infarct areas, away from the infarct core) were impaired in their capacity to generate spinal potentials leading to even more severe deficits in motor output at muscles. We suggest that ischemia, targeted to a subset of motor cortex, leads to relatively small reductions in excitability within motor cortex, and cumulative depression of both descending spinal circuits and motor output in response to the activation of widespread cortical territories even outside of the area directly affected by the ischemia.

Keywords: channelrhodopsin-2; motor-mapping; mouse; optogenetics; plasticity; stroke.


Figures

Figure 1.
Figure 1.
Experimental arrangement for ChR2 cortical and motor mapping. A, Green light image of cortex overlaid with a 12 × 14 grid of stimulation sites each separated by 300 μm (Ai). Traces of EMG (Aii) and EEG (Aiii) responses evoked from light stimulation directed at each site on cortex. Aiv, Quantification of the ChR2 evoked EEG response; the raw, rectified and integrated signal. Bi, Processed laser-speckle image displaying blood flow of surface vasculature, with higher velocity blood flow appearing as a darker tone. The arrow indicates the arteriole targeted for occlusion, selected for its location branching from the middle cerebral artery over a restricted region of the motor map. ChR2 evoked EMG (Bii) and EEG (Biii) responses from three repetitions averaged and scaled between minimal and maximal values represented as pixels ranged from black to white reveal a ChR2-evoked motor and neuronal excitability (EEG) map. Tracings of vasculature superimposed on the motor map, with the vessel targeted for occlusion colored in blue. Biv, Outline of the motor map after thresholding-excluding responses <25% of maximum. Location of vessels targeted for occlusion relative to center of motor maps (n = 8). Outline of thresholded motor map relative to forelimb and hindlimb cortical sensory representations and bregma based on previous observations (Ayling et al., 2009). C, Timeline of the experiment. Baseline maps and laser speckle imaging was performed. Photothrombosis was achieved by irradiating the target vessel after injection of rose bengal. Following induction of stroke, changes in blood flow were measured with laser speckle imaging before ChR2 mapping ensured. This procedure was repeated for 2.5 h.
Figure 2.
Figure 2.
Evolution of the targeted stroke. A, Laser-speckle image displaying blood flow of surface vasculature with a black outline of the corresponding motor map and the area with <20% blood mean blood flow after stroke in white. B, Percentage change in blood flow at the 76 × 76 μm region of interest at the vessel targeted for occlusion. C, The surface area of cortex with area corresponding to various thresholds of blood flow. D, Areas corresponding to 20, 40, and 60% blood flow superimposed onto laser speckle images at 70–80 min poststroke with the most ischemic area (<20% blood flow) outlined. Error bars in all graphs are SEM. Significant differences relative to baseline #p < 0.05, ##p < 0.01 and between groups *p < 0.05, **p < 0.01.
Figure 3.
Figure 3.
Assessment of motor output after stroke. A, Motor maps generated from repeated mapping of a (Ai) sham animal and (Aii) one with a targeted stroke. B, The percentage change in the mean of ChR2 evoked EMG responses in the map over time. C, Change in motor map area based on the number of stimulation sites that evoked a motor response (EMG). Rescaled image from 130 to 160 min time point more clearly demonstrating spatial the extent of cortical stimulation regions that yielded motor responses. Error bars in all graphs are SEM. Significant differences #p < 0.05 with respect to baseline. Significant differences *p < 0.05, **p < 0.01, ***p < 0.001 between groups.
Figure 4.
Figure 4.
Assessment of motor output and neuronal excitability after stroke. A, ChR2-evoked EEG maps generated from repeated mapping of a (Ai) sham animal and (Aii) one with a targeted stroke. Gray values of pixels represent the amplitude of responses from stimulation of that specific location. Saturated pixels from light striking the EEG electrode, marked with a black circle, were not analyzed. B, The percentage change in the mean of EEG responses in the map over time. C, EEG traces from a single animal displaying the initial and delayed persistent response to ChR2 cortical stimulation in (Ci) sham and (Cii) stroke animals. D, The relative change in persistent activity after irradiation and ischemia. Error bars in all graphs are SEM. Significant differences #p < 0.05 with respect to baseline. Significant differences *p < 0.05, **p < 0.01, ***p < 0.001 between groups.
Figure 5.
Figure 5.
The spatial relationship between changes in neuronal excitability, motor output, and the ministroke for group data. A, Average upsampled ChR-2 stimulated motor maps, (100 × 100 μm pixels) normalized to their respective mean, aligned based the location of the infarct and averaged together. Motor maps (average) at (Ai) baseline and (Aii) motor maps immediately after stroke (10–40 min; n = 6). B, Average upsampled neuronal excitability maps, (100 × 100 μm pixels) normalized to their respective mean, aligned based the location of the infarct and averaged together. ChR-2 stimulated EEG map at (Bi) baseline and (Bii) immediately after stroke (n = 6). C, Schematic of how plots in D were derived, with the amplitude of each map pixel being binned according to its distance to the infarct regardless of direction. D, Motor output (r2 = 0.92; p < 0.001) and neuronal excitability (r2 = 0.30; p = 0.0651) immediately after stroke relative to baseline maps as a function of distance from the occluded vessel. E, Schematic of the spatial changes in neuronal excitability and motor output imparted by targeted ischemia.
Figure 6.
Figure 6.
The effect of stroke on ChR2-mediated and cortically evoked dorsal spinal potentials. A, Distance of the two sites optogentically stimulated, one being the stroke core and the other a hypoperfused peri-infarct region within motor cortex. B, The surface area of cortex with area corresponding to various thresholds of blood flow immediately after stroke (0–10 min; n = 4). Significant differences *p < 0.05, **p < 0.01, ***p < 0.001 for multiple-comparisons between these measures via Bonferroni Post Hoc testing after one-way ANOVA. C, Blood flow at the 76 × 76 μm region of interest at the vessel targeted for occlusion (n = 4). Significant differences # p < 0.05, ##p < 0.01 after t test. D, ChR2-evoked spinal cord potentials from stimulation of motor cortex at the site of the stroke (Di) and within a peri-infarct area (Dii) recorded along the dorsal column superior to the level of the fourth cervical vertebrae. E, ChR2-evoked cortical (EEG), spinal cord dorsum potential (CDP), and muscular (EMG) potentials recorded 10–40 min after stroke demonstrate the progressive attenuation of the motor output after stroke (n = 4). F, Latency to peak spinal response from ChR2 cortical stimulation from each stimulation site; at the stroke core and at the periinfarct site.
Figure 7.
Figure 7.
Summary diagram showing selective breakdown of poststroke motor cortex output. A, Neurons within motor cortex project along the dorsal column of the spinal cord and synapse ventrally eventually reaching a lower motor neuron and the musculature. B, Effects of ministroke on motor output. The stroke core is represented with black shading with hypoperfused tissue in gray. These neurons are still excitable (when measured with the ChR2-evoked averaged EEG response); however, there is a cumulative depression in the motor signal, with an attenuated signal in the spinal cord and a severe depression in motor output as detected in the muscle. These motor deficits were detectable when stimulation was targeted to cortical areas over a millimeter away from the stroke core, whereas depressed neuronal excitability was only detected at the stroke core.

References

    1. Alaverdashvili M, Whishaw IQ. Compensation aids skilled reaching in aging and in recovery from forelimb motor cortex stroke in the rat. Neuroscience. 2010;167:21–30. doi: 10.1016/j.neuroscience.2010.02.001. - DOI - PubMed
    1. Anderson CT, Sheets PL, Kiritani T, Shepherd GM. Sublayer-specific microcircuits of corticospinal and corticostriatal neurons in motor cortex. Nat Neurosci. 2010;13:739–744. doi: 10.1038/nn.2538. - DOI - PMC - PubMed
    1. Arenkiel BR, Peca J, Davison IG, Feliciano C, Deisseroth K, Augustine GJ, Feng G. In vivo light-induced activation of neural circuitry in transgenic mice expressing channelrhodopsin-2. Neuron. 2007;54:205–218. doi: 10.1016/j.neuron.2007.03.005. - DOI - PMC - PubMed
    1. Astrup J, Symon L, Branston NM, Lassen NA. Cortical evoked potential and extracellular K+ and H+ at critical levels of brain ischemia. Stroke. 1977;8:51–57. doi: 10.1161/01.STR.8.1.51. - DOI - PubMed
    1. Astrup J, Siesjö BK, Symon L. Thresholds in cerebral ischemia-the ischemic penumbra. Stroke. 1981;12:723–725. doi: 10.1161/01.STR.12.6.723. - DOI - PubMed

Publication types

Substances

LinkOut - more resources