. 2014 Jan 22;34(4):1293-305.
doi: 10.1523/JNEUROSCI.1870-13.2014.

The regulation of autophagosome dynamics by huntingtin and HAP1 is disrupted by expression of mutant huntingtin, leading to defective cargo degradation

Affiliations

The regulation of autophagosome dynamics by huntingtin and HAP1 is disrupted by expression of mutant huntingtin, leading to defective cargo degradation

Yvette C Wong et al. J Neurosci. .

Abstract

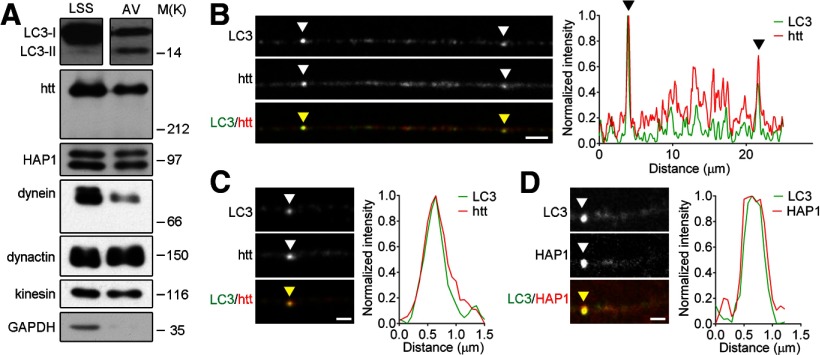
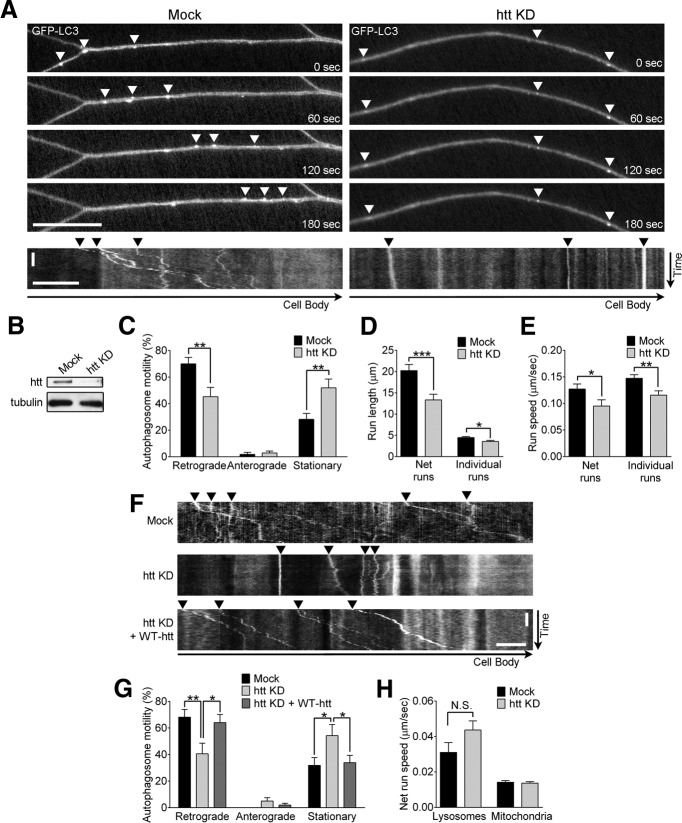
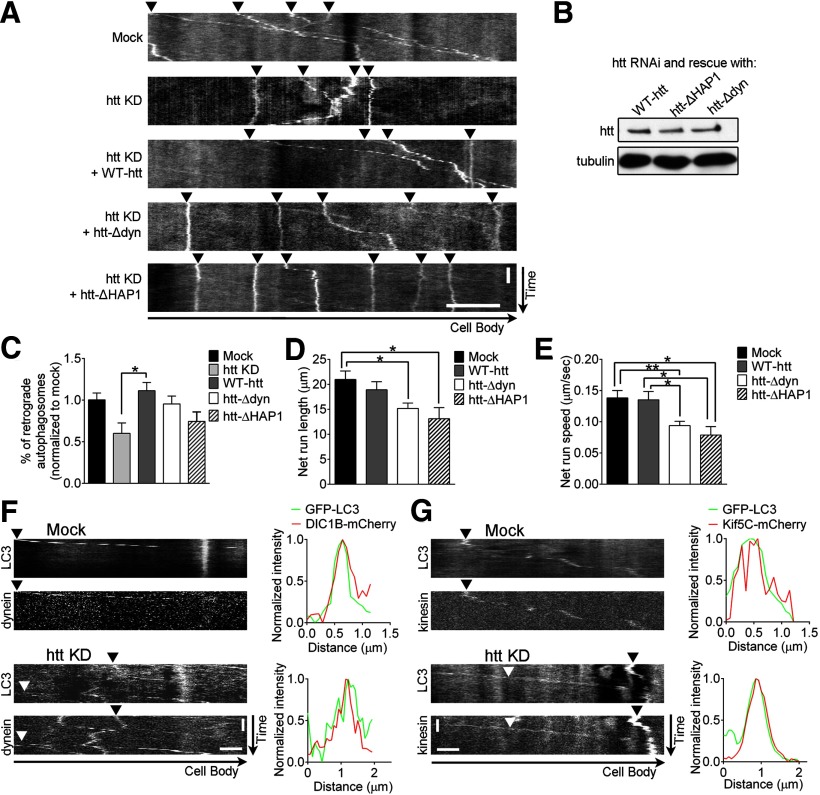
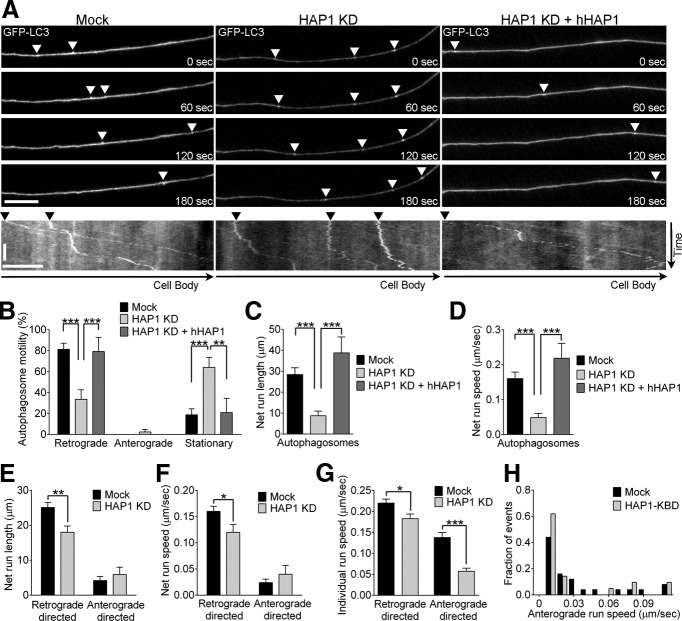
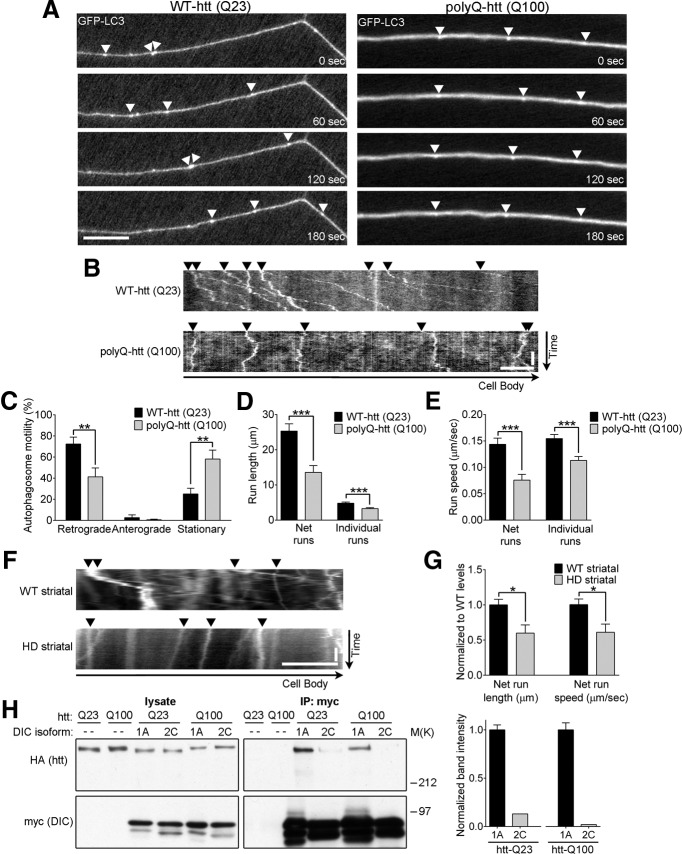
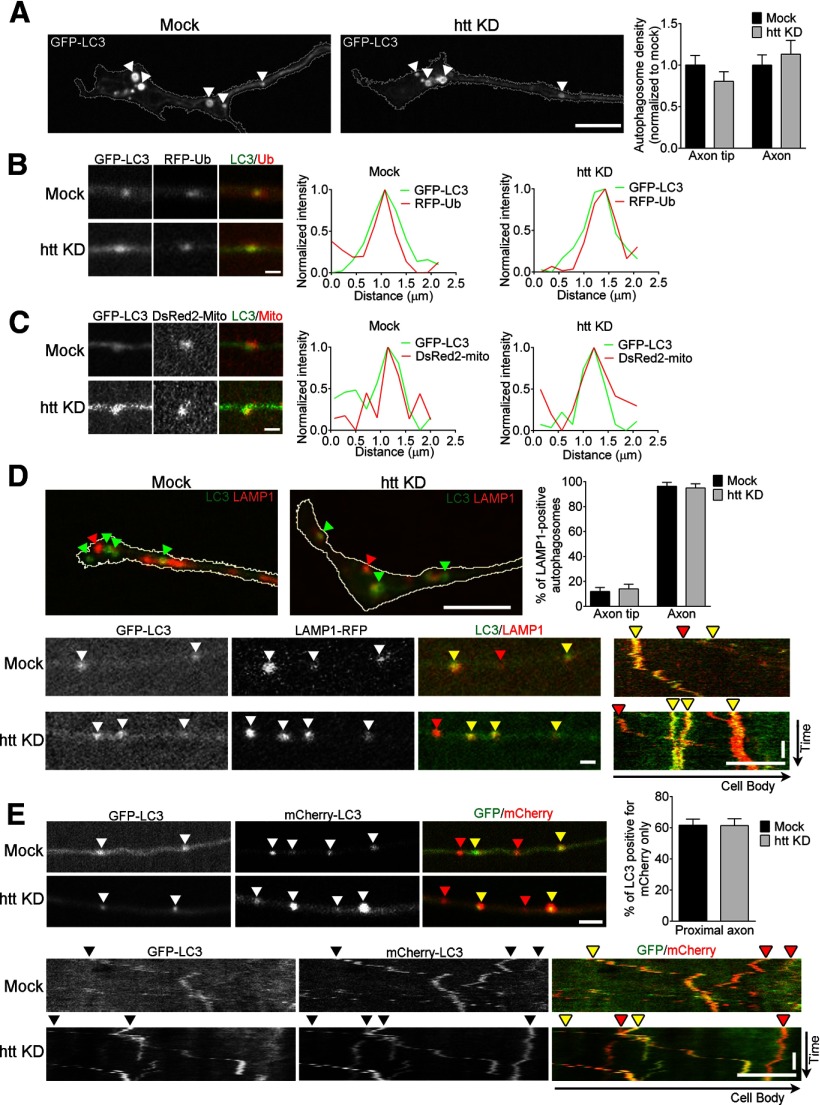
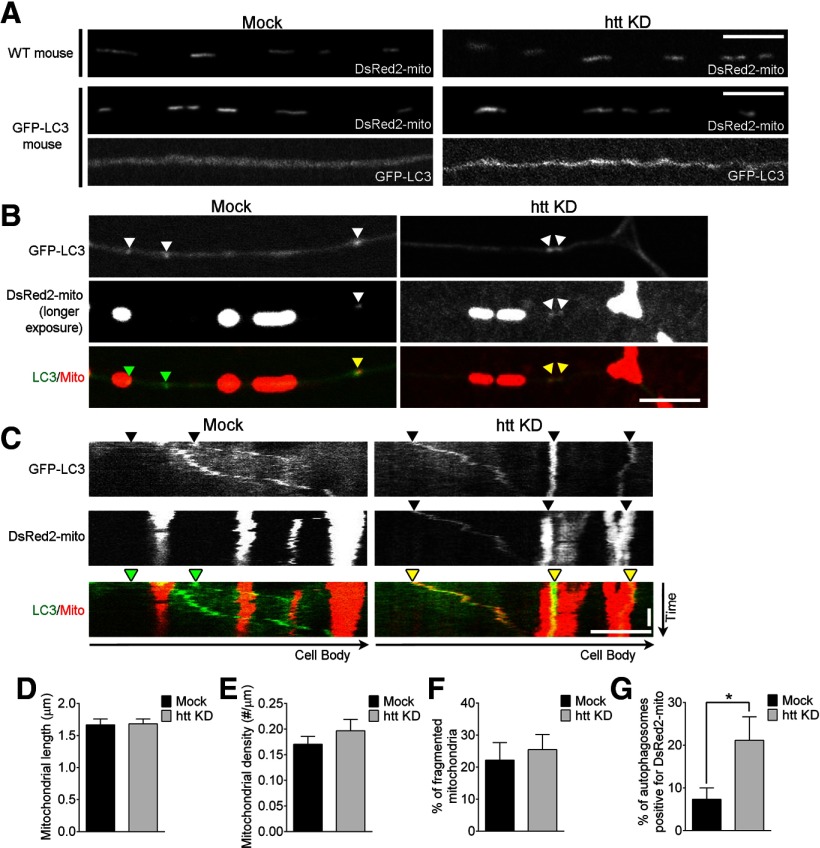
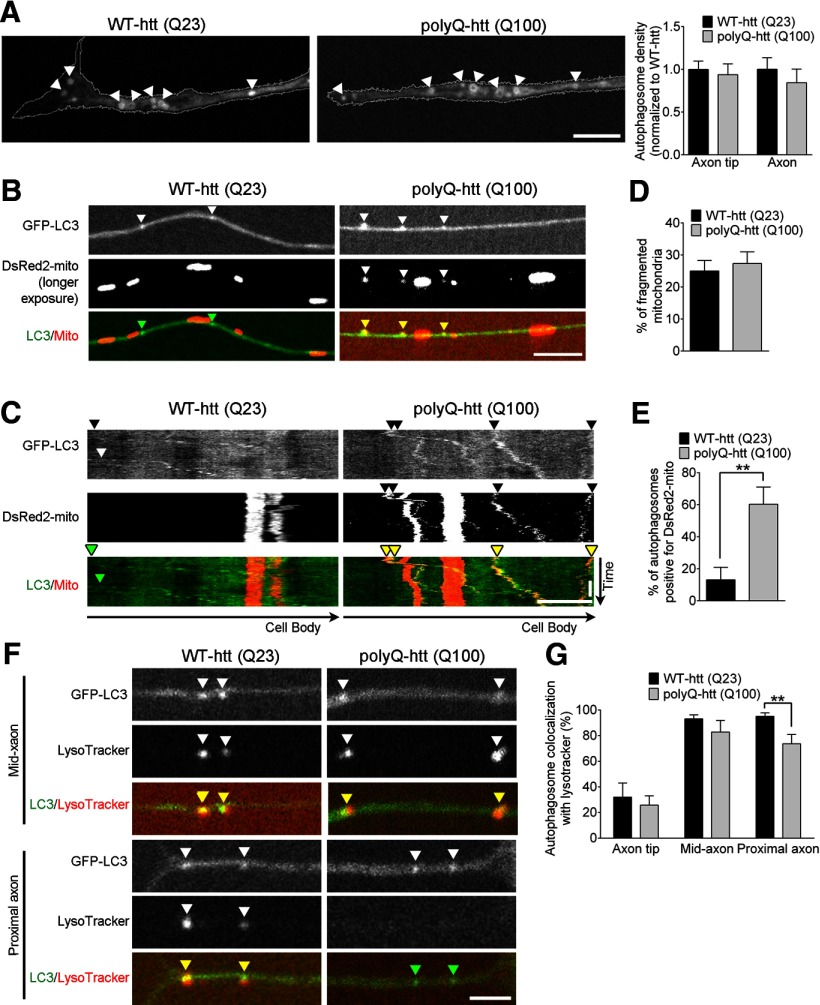
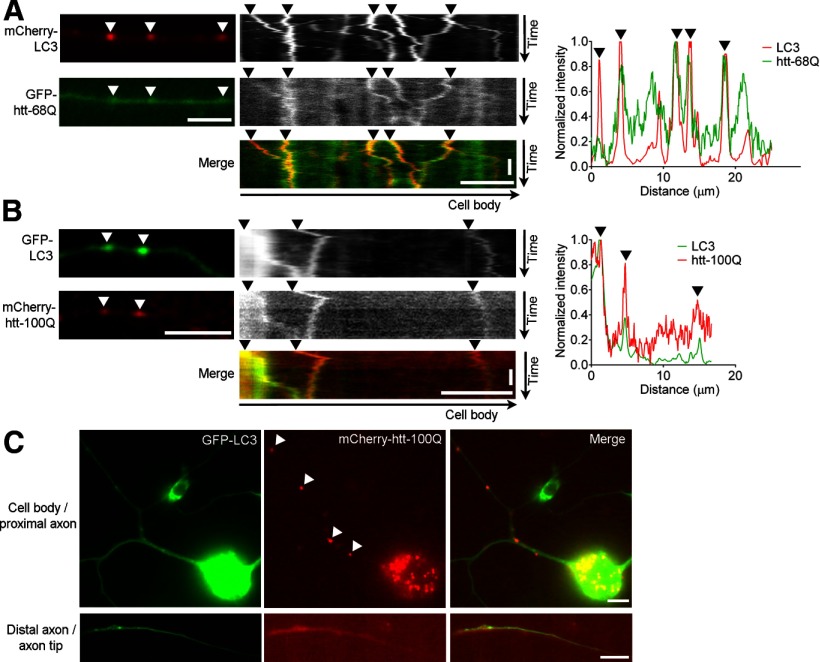
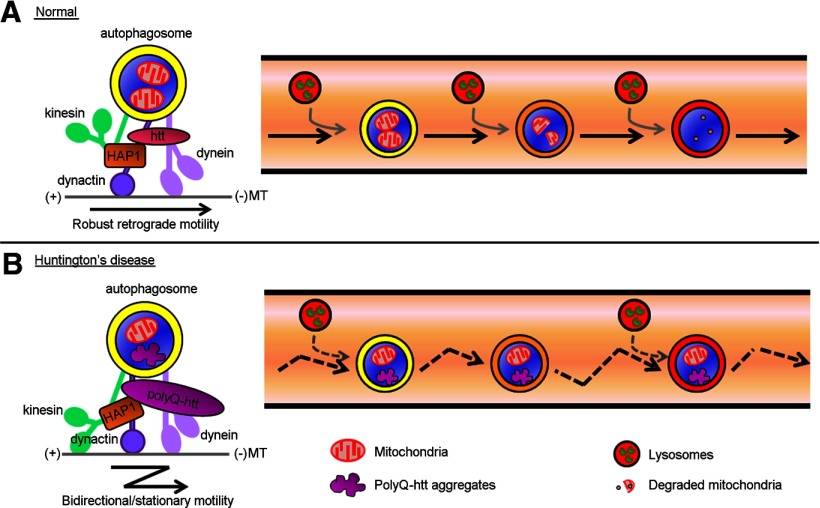
Autophagy is an essential cellular pathway for degrading defective organelles and aggregated proteins. Defects in autophagy have been implicated in the neurodegenerative disorder Huntington's disease (HD), in which polyglutamine-expanded huntingtin (polyQ-htt) is predominantly cleared by autophagy. In neurons, autophagosomes form constitutively at the axon tip and undergo robust retrograde axonal transport toward the cell body, but the factors regulating autophagosome dynamics and autophagosome maturation are not well understood. Here, we show that both huntingtin (htt) and its adaptor protein huntingtin-associated protein-1 (HAP1) copurify and colocalize with autophagosomes in neurons. We use live-cell imaging and RNAi in primary neurons from GFP-LC3 transgenic mice to show that htt and HAP1 control autophagosome dynamics, regulating dynein and kinesin motors to promote processive transport. Expression of polyQ-htt in either primary neurons or striatal cells from HD knock-in mice is sufficient to disrupt the axonal transport of autophagosomes. Htt is not required for autophagosome formation or cargo loading. However, the defective autophagosome transport observed in both htt-depleted neurons and polyQ-htt-expressing neurons is correlated with inefficient degradation of engulfed mitochondrial fragments. Together, these studies identify htt and HAP1 as regulators of autophagosome transport in neurons and suggest that misregulation of autophagosome transport in HD leads to inefficient autophagosome maturation, potentially due to inhibition of autophagosome/lysosome fusion along the axon. The resulting defective clearance of both polyQ-htt aggregates and dysfunctional mitochondria by neuronal autophagosomes may contribute to neurodegeneration and cell death in HD.

Keywords: Huntington's disease; autophagy; axonal transport; dynein; huntingtin; mitophagy.


Figures

Figure 1.
Figure 1.
Htt associates with autophagosomes in neurons. A, Autophagosome-enriched fraction (AV) prepared from mouse brain containing LC3-II, the lipidated form of LC3, is positive for htt, HAP1, the retrograde motor complex proteins dynein and dynactin, and the anterograde motor protein kinesin, but not for the cytoplasmic protein GAPDH. Equal total protein was loaded from the low speed supernatant fraction (LSS) obtained before purification for comparison by immunoblot. BD, Representative images with corresponding linescans of immunostaining of endogenous LC3 with htt (B,C) and HAP1 (D) in axons from primary DRG neurons demonstrate colocalization of htt and HAP1 with autophagosomes. Arrowheads highlight areas of colocalization. Horizontal scale bars in BD, 1 μm.
Figure 2.
Figure 2.
Htt regulates autophagosome transport in neurons. A, Representative time series and corresponding kymographs of GFP-LC3 autophagosome transport in axons of control (mock) and htt siRNA-depleted (htt KD) primary DRG neurons from GFP-LC3-transgenic mice. Autophagosomes in control neurons demonstrate robust retrograde transport (arrowheads), whereas autophagosomes in htt-depleted neurons show disrupted motility (arrowheads). B, Htt protein levels are efficiently depleted by htt siRNA in immunoblot. C, Depleting htt decreases the percentage of retrograde autophagosomes (moving ≥10 μm/3 min in the retrograde direction) and increases the percentage of stationary autophagosomes (moving <10 μm/3 min) in neurons (mock, n = 23; htt KD, n = 23). The percentage of anterograde autophagosomes (moving ≥10 μm/3 min in the anterograde direction) was not altered. D, E, Run lengths (D) and run speeds (E) from autophagosome net runs (total distance traveled over 3 min) and individual runs (distance traveled before changing direction or speed) are reduced by htt depletion in primary neurons (net runs: mock, n = 143; htt KD, n = 162; individual runs: mock, n = 667; htt KD, n = 608). F, Representative kymographs of GFP-LC3 autophagosome transport demonstrate rescue of retrograde autophagosome transport (arrowheads) in htt-siRNA neurons expressing siRNA-resistant wild-type htt Q23 (htt KD + WT-htt) compared with htt siRNA-depleted (htt KD) primary DRG neurons. Rescued neurons have similar autophagosome transport to control neurons (mock). G, Expression of wild-type htt rescues the percentage of retrograde autophagosomes in htt-siRNA neurons (mock, n = 17; htt KD, n = 15; htt KD + WT-htt, n = 12). H, Htt depletion does not disrupt net run speeds of lysosomes or mitochondria in primary DRG neurons (lysosomes: mock, n = 126; htt KD, n = 149; mitochondria: mock, n = 122; htt KD, n = 177). Horizontal scale bars in A and F, 10 μm. Vertical scale bars, 1 min. Values represent means ± SEM. *p < 0.05; **p < 0.01; ***p < 0.001; N.S. (not significant, p ≥ 0.05).
Figure 3.
Figure 3.
Htt regulates autophagosome transport by binding to dynein and HAP1. A, Representative kymographs of GPF-LC3 autophagosome transport demonstrate that siRNA-resistant dominant-negative htt constructs that cannot bind dynein (htt KD + htt-Δdyn) or HAP1 (htt KD + htt-ΔHAP1) are unable to rescue autophagosome motility (arrowheads) in htt siRNA-depleted primary DRG neurons, compared with normal full-length htt (htt KD + WT-htt). B, WT-htt, htt-Δdyn, and htt-ΔHAP1 are all efficiently expressed in neurons by immunoblot. C, WT-htt rescues the percentage of retrograde autophagosomes to control levels, whereas htt-Δdyn and htt-ΔHAP1 are unable to do so (mock, n = 41; htt KD, n = 14; WT-htt, n = 37; htt-Δdyn, n = 25; htt-ΔHAP1, n = 23). D, E, Run lengths (D) and run speeds (E) from autophagosome net runs (total distance traveled over 3 min) are not rescued by htt-Δdyn or htt-ΔHAP1 compared with WT-htt (mock, n = 184; WT-htt, n = 135; htt-Δdyn, n = 207; htt-ΔHAP1, n = 67). F, Representative kymographs and corresponding line scans show colocalization and cotransport (arrowheads) of a neuronal-specific isoform of the retrograde motor dynein (DIC1B-mCherry) with GFP-LC3 autophagosomes in both control neurons (mock) and htt-depleted (htt KD) primary DRG neurons. G, Representative kymographs and corresponding line scans show colocalization and cotransport (arrowheads) of the anterograde motor kinesin (Kif5C-mCherry) with GFP-LC3 autophagosomes in both control neurons (mock) and htt-depleted neurons (htt KD). Line scan intensities are normalized per marker and per condition. Horizontal scale bars: A, 10 μm; F, G, 2 μm. Vertical scale bars, 1 min. Values represent means ± SEM. *p < 0.05; **p < 0.01.
Figure 4.
Figure 4.
HAP1 depletion inhibits autophagosome transport in neurons. A, Representative time series and corresponding kymographs of GFP-LC3 autophagosome transport in axons of primary DRG neurons demonstrate that autophagosome transport is disrupted in HAP1 siRNA-depleted neurons (HAP1 KD) compared with control neurons (mock) and is rescued by expression of siRNA-resistant human HAP1 (HAP1 KD + hHAP1; arrowheads). Two autophagosomes are shown moving in control neurons (Mock) with one leaving the frame of view by 180 s (see corresponding kymograph). B, Depleting HAP1 decreases the percentage of retrograde autophagosomes and increases the percentage of stationary autophagosomes in neurons; these defects are rescued by expression of siRNA-resistant human HAP1 (HAP1 KD + hHAP1) (mock, n = 10; HAP1 KD, n = 14; HAP1 KD + hHAP1, n = 6). C, D, HAP1 depletion reduces net run lengths (C) and net run speeds (D) of autophagosomes; these defects are rescued by hHAP1 expression (mock, n = 52; HAP1 KD, n = 39; HAP1 KD + hHAP1, n = 17). E, F, HAP1 depletion reduces the run lengths (E) and run speeds (F) of autophagosome net runs (total distance traveled over 3 min) in the retrograde direction, but not in the anterograde direction (retrograde-directed: mock, n = 180; HAP1 KD, n = 107; anterograde-directed: mock, n = 30; HAP1 KD, n = 30). G, HAP1 depletion reduces individual run speeds in both the retrograde and anterograde direction (retrograde-directed: mock, n = 709; HAP1 KD, n = 336; anterograde-directed: mock, n = 269; HAP1 KD, n = 175). Retrograde directed refers to runs of any length in the retrograde direction; anterograde directed refers to runs of any length in the anterograde direction. H, Expression of HAP1 lacking the kinesin-binding domain (HAP1-KBD) results in an increase in the fraction of autophagosomes expressing slower anterograde run speeds (mock, n = 25; HAP1-KBD, n = 21). Horizontal scale bar, 10 μm. Vertical scale bar, 1 min. Values represent means ± SEM. *p < 0.05; **p < 0.01; ***p < 0.001.
Figure 5.
Figure 5.
Pathogenic polyQ-htt disrupts autophagosome dynamics in neurons. A, B, Representative time series (A) and kymographs (B) of GPF-LC3 show that expression of siRNA-resistant polyQ-htt (Q100) in siRNA-htt-depleted primary DRG neurons disrupts autophagosome transport (arrowheads) compared with expression of wild-type htt (WT-htt, Q23). C, PolyQ-htt decreases the percentage of retrograde autophagosomes and increases the percentage of stationary autophagosomes in neurons (WT-htt, n = 19; polyQ-htt, n = 17). D, E, Run lengths (D) and run speeds (E) from autophagosome net runs (total distance traveled over 3 min) and individual runs (distance traveled before changing direction or speed) are reduced by polyQ-htt compared with wild-type htt in primary neurons (net runs: WT-htt, n = 97; polyQ-htt, n = 77; individual runs: WT-htt, n = 526; polyQ-htt, n = 393). F, Representative kymographs of mCherry-LC3 show reduced autophagosome motility in neurites of differentiated striatal cells from HD homozygous knock-in mice (HdhQ111/Q111) compared with striatal cells from wild-type mice (HdhQ7/Q7). G, Autophagosome net run lengths and net run speeds are reduced in HdhQ111/Q111 striatal cells (WT, n = 163; HD, n = 50). H, Coimmunoprecipitation experiments show that both wild-type htt (Q23) and polyQ-htt (Q100) preferentially bind to neuronal-specific isoform DIC1A compared with the ubiquitously expressed isoform DIC2C. Band intensities of coimmunoprecipitated htt were normalized for efficiency of DIC expression and immunoprecipitation and expressed as the relative ratio of DIC2C: DIC1A interaction for each htt construct. Horizontal scale bars, 10 μm. Vertical scale bars, 1 min. Values represent means ± SEM. *p < 0.05; **p < 0.01; ***p < 0.001.
Figure 6.
Figure 6.
Htt is not required for initial steps of autophagosome formation, cargo loading, and initial maturation. A, Representative confocal live-cell images of GFP-LC3 autophagosomes demonstrate autophagosomes forming (arrowheads) in the distal tip of the neurite from puncta into ring-like structures in both control (mock) and htt-depleted (htt KD) primary DRG neurons. Autophagosome density at the axon tip and along the axon is not disrupted by htt depletion (axon tip: mock, n = 10; htt KD, n = 13; axon: mock, n = 23; htt KD, n = 23). B, C, Representative images and corresponding line scans of GFP-LC3 autophagosomes colocalized with RFP-Ub ubiquitinated protein cargo (B) and DsRed2-mito mitochondrial fragments (C) in axons of both control (mock) and htt-depleted (htt KD) neurons. Line scan intensities are normalized per marker and per condition. D, Representative images of GFP-LC3 and LAMP1-RFP at the axon tip (top) and representative images and corresponding kymograph of GFP-LC3 autophagosomes positive for LAMP1-RFP (yellow arrowheads) along the axon (bottom) in both control (mock) and htt-depleted (htt KD) neurons (axon tip: mock, n = 19; htt KD, n = 22; axon: mock, n = 22; htt KD, n = 20). E, Representative images (top) and kymographs (bottom) of acidification of autophagosomes (red arrowheads) in neurons expressing mCherry-EGFP-LC3 in both control (mock) and htt-depleted (htt KD) primary DRG neurons. In acidic environments, the GFP moiety is preferentially quenched with persistent mCherry fluorescence (mock, n = 16; htt KD, n = 13). Horizontal scale bars: A, D, E (kymographs), 10 μm; BE (images), 1 μm. Vertical scale bars, 1 min.
Figure 7.
Figure 7.
Depletion of htt leads to inefficient mitochondrial cargo degradation in autophagosomes. A, Htt depletion does not disrupt mitochondria morphology in either wild-type mice (WT) or GFP-LC3-transgenic mice. B, C, Representative images (B) and kymographs (C) of increased DsRed2-mito mitochondrial fragments colocalized and cotransporting with GFP-LC3 autophagosomes (yellow arrowheads) in axons of htt-depleted neurons. Mitochondria were imaged at longer exposures to allow for visible cotransport of mitochondrial fragments with autophagosomes. Images and kymographs are taken from different neurons. DF, Htt depletion did not disrupt mitochondrial length (D; mock, n = 122; htt KD, n = 177), density along the axon (E), or percentage of fragmented mitochondria (length < 1 μm; F) in primary DRG neurons (mock, n = 9; htt KD, n = 12). G, Htt depletion increased the percentage of GFP-LC3 autophagosomes containing DsRed2-mito mitochondria per neurite (mock, n = 32; htt KD, n = 38). Horizontal scale bars, 10 μm. Vertical scale bar, 1 min. Values represent means ± SEM. *p < 0.05.
Figure 8.
Figure 8.
Pathogenic polyQ-htt causes inefficient mitochondrial cargo degradation in neurons. A, Confocal live-cell images showing GFP-LC3 autophagosomes forming (arrowheads) in the distal tip of the neurite from puncta into ring-like structures in htt siRNA-depleted primary DRG neurons from GFP-LC3 transgenic mice expressing either siRNA-resistant wild-type htt (Q23) or polyQ-htt (Q100). Autophagosome density at the axon tip and along the axon is not altered by expression of polyQ-htt (Q100) in primary DRG neurons (axon tip: WT-htt, n = 12; polyQ-htt, n = 11; axon: WT-htt, n = 14; polyQ-htt, n = 17). B, C, Representative images (B) and kymographs (C) of increased DsRed2-mito mitochondrial fragments colocalized and cotransporting with GFP-LC3 autophagosomes (yellow arrowheads) in axons of polyQ-htt (Q100)-expressing neurons. Mitochondria were imaged at longer exposures to allow for visible cotransport of mitochondrial fragments with autophagosomes. D, PolyQ-htt expression did not disrupt percentage of fragmented mitochondria (length < 1 μm) in primary DRG neurons (WT-htt, n = 12; polyQ-htt, n = 17). E, PolyQ-htt expression increased the percentage of GFP-LC3 autophagosomes containing DsRed2-mito mitochondria per neurite (WT-htt, n = 12; polyQ-htt, n = 17). F, G, Representative images (F) and quantification (G) showing similar levels of LysoTracker Red-positive autophagosomes at the axon tip and mid-axon, but reduced LysoTracker Red-positive autophagosomes in the proximal axon of neurons expressing polyQ-htt (Q100) compared with neurons expressing WT-htt (Q23) (axon tip: WT-htt, n = 20; polyQ-htt, n = 18; mid-axon: WT-htt, n = 16; polyQ-htt, n = 15; proximal-axon: WT-htt, n = 14; polyQ-htt, n = 14). Horizontal scale bars: AC, 10 μm; F, 5 μm. Vertical scale bar, 1 min. Values represent means ± SEM. **p < 0.01.
Figure 9.
Figure 9.
Disrupted autophagosome dynamics lead to inefficient clearance of pathogenic polyQ-htt from the distal axon. A, B, Representative images and kymographs and corresponding linescans show disease-associated cleaved N-terminal fragment of GFP-polyQ-htt (Q68; A) and full-length mCherry-polyQ-htt (Q100; B) colocalized and cotransporting as autophagic cargo with retrogradely moving autophagosomes (arrowheads) in axons of primary neurons. C, Representative image of ineffective clearance and aggregate formation of mCherry-polyQ-htt (Q100) in the cell body, axon (arrowheads), and distal axon tip of primary neurons. Horizontal scale bars, 10 μm. Vertical scale bars, 1 min.
Figure 10.
Figure 10.
Model of htt/HAP1's regulation of autophagosome dynamics in neurons. A, Htt and HAP1 regulate the motor activity and processivity of microtubule motors dynein, dynactin, and kinesin on autophagosomes via interactions among htt, HAP1, and neuronal-specific dynein isoforms to drive robust retrograde transport of autophagosomes back to the cell body in neurons along microtubules (MT). Retrograde autophagosome transport is necessary for efficient fusion with lysosomes for degradation of autophagic cargo such as mitochondria. B, In HD, pathogenic polyQ-htt disrupts the htt/HAP1 motor protein complex on autophagosomes via altered polyQ-htt/HAP1 association. This misregulation of motors leads to bidirectional/stationary autophagosome dynamics in HD neurons, thereby disrupting the retrograde transport of autophagosomes necessary for efficient degradation of dysfunctional mitochondria and polyQ-htt.

References

    1. Atwal RS, Xia J, Pinchev D, Taylor J, Epand RM, Truant R. Huntingtin has a membrane association signal that can modulate huntingtin aggregation, nuclear entry and toxicity. Hum Mol Genet. 2007;16:2600–2615. doi: 10.1093/hmg/ddm217. - DOI - PubMed
    1. Bampton ET, Goemans CG, Niranjan D, Mizushima N, Tolkovsky AM. The dynamics of autophagy visualizes in live cells: from autophagosome formation to fusion with endo/lysosomes. Autophagy. 2005;1:23–36. doi: 10.4161/auto.1.1.1495. - DOI - PubMed
    1. Caviston JP, Ross JL, Antony SM, Tokito M, Holzbaur EL. Huntingtin facilitates dynein/dynactin-mediated vesicle transport. Proc Natl Acad Sci U S A. 2007;104:10045–10050. doi: 10.1073/pnas.0610628104. - DOI - PMC - PubMed
    1. Caviston JP, Zajac AL, Tokito M, Holzbaur EL. Huntingtin coordinates the dynein-mediated dynamic positioning of endosomes and lysosomes. Mol Biol Cell. 2011;22:478–492. doi: 10.1091/mbc.E10-03-0233. - DOI - PMC - PubMed
    1. Chang DT, Rintoul GL, Pandipati S, Reynolds IJ. Mutant huntingtin aggregates impair mitochondrial movement and trafficking in cortical neurons. Neurobiol Dis. 2006;22:388–400. doi: 10.1016/j.nbd.2005.12.007. - DOI - PubMed

Publication types

MeSH terms