

Suboptimal use of neural information in a mammalian auditory system
- PMID: 24453321
- PMCID: PMC3898290
- DOI: 10.1523/JNEUROSCI.3031-13.2014
Suboptimal use of neural information in a mammalian auditory system
Abstract
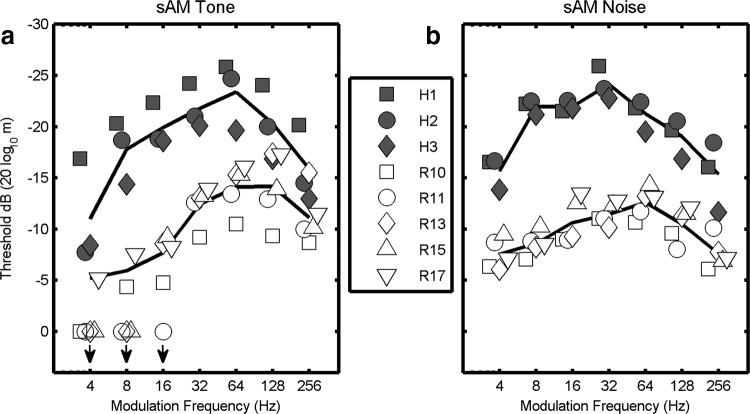
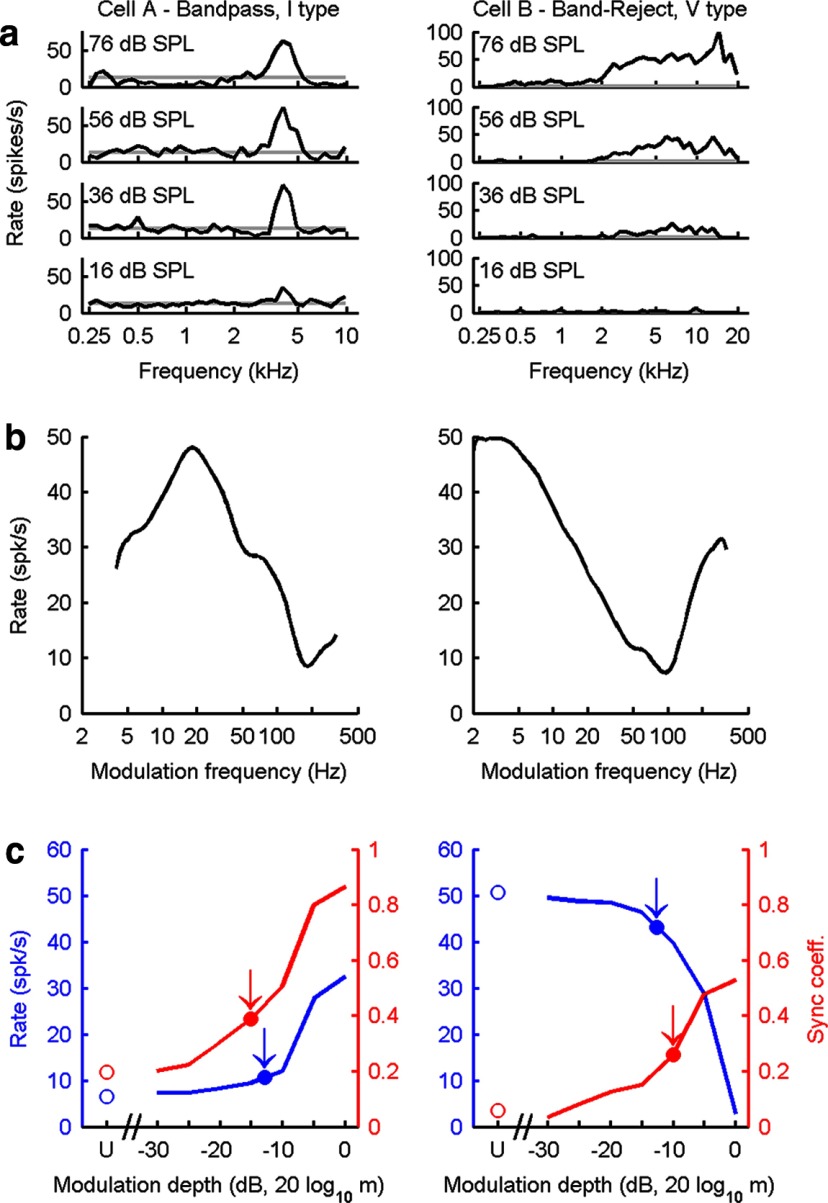
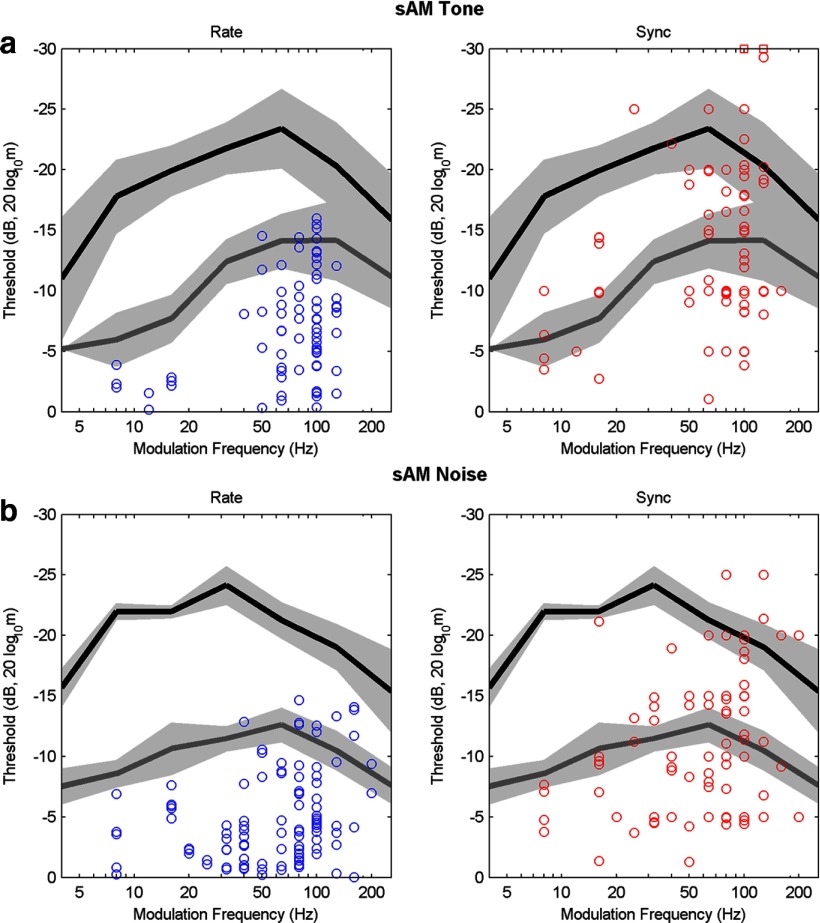
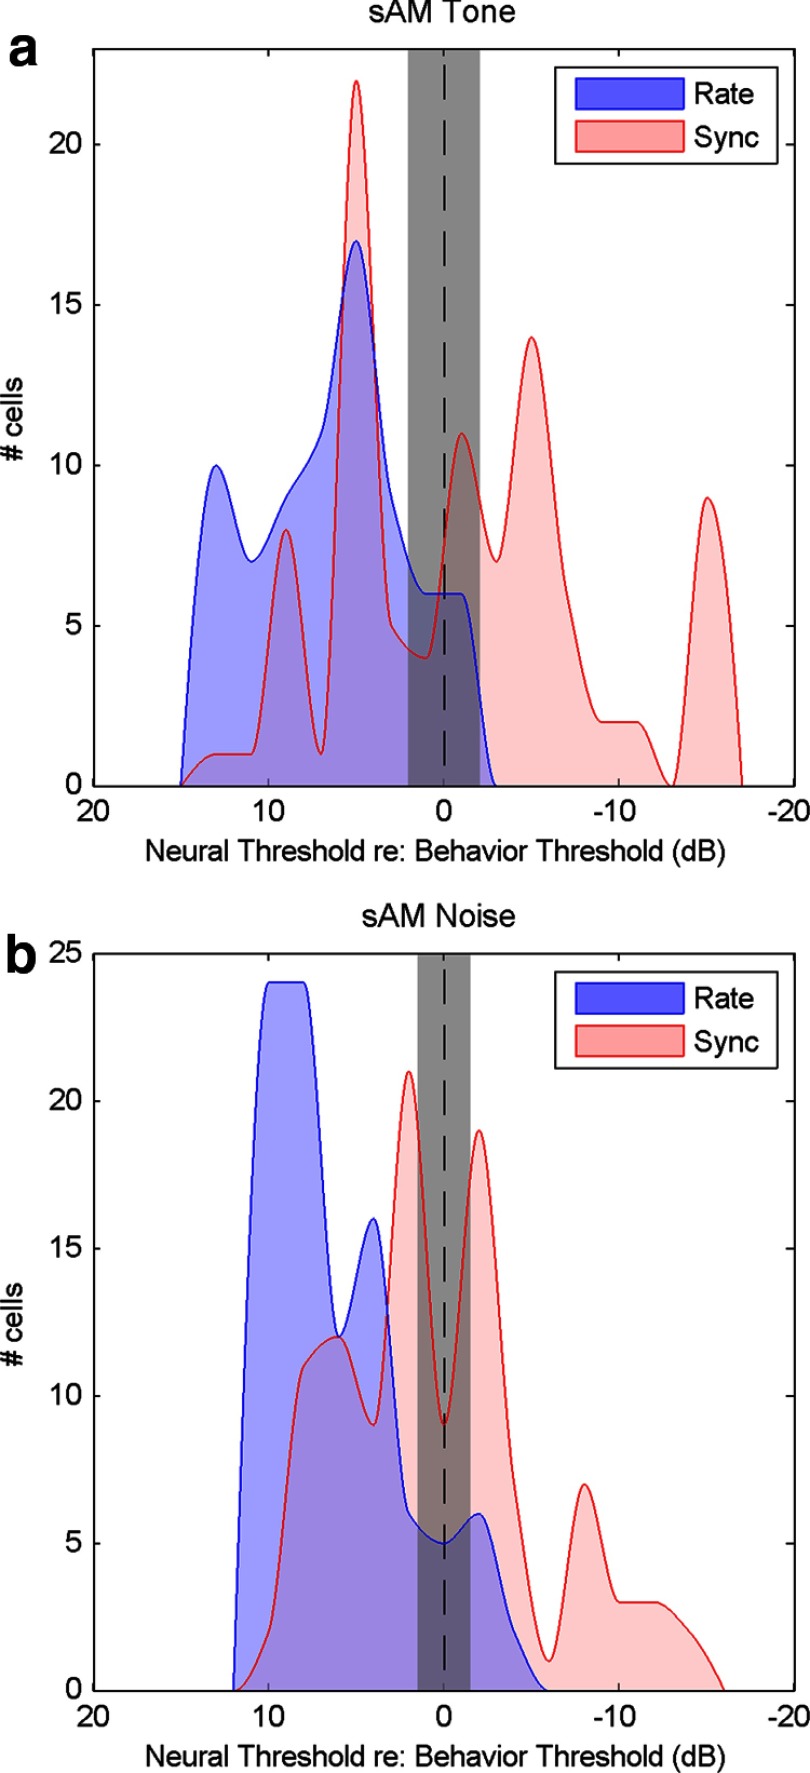
Establishing neural determinants of psychophysical performance requires both behavioral and neurophysiological metrics amenable to correlative analyses. It is often assumed that organisms use neural information optimally, such that any information available in a neural code that could improve behavioral performance is used. Studies have shown that detection of amplitude-modulated (AM) auditory tones by humans is correlated to neural synchrony thresholds, as recorded in rabbit at the level of the inferior colliculus, the first level of the ascending auditory pathway where neurons are tuned to AM stimuli. Behavioral thresholds in rabbit, however, are ∼10 dB higher (i.e., 3 times less sensitive) than in humans, and are better correlated to rate-based than temporal coding schemes in the auditory midbrain. The behavioral and physiological results shown here illustrate an unexpected, suboptimal utilization of available neural information that could provide new insights into the mechanisms that link neuronal function to behavior.
Figures
Similar articles
-
Neural rate and timing cues for detection and discrimination of amplitude-modulated tones in the awake rabbit inferior colliculus.J Neurophysiol. 2007 Jan;97(1):522-39. doi: 10.1152/jn.00776.2006. Epub 2006 Nov 1. J Neurophysiol. 2007. PMID: 17079342 Free PMC article.
-
Neural correlates of gap detection and auditory fusion in cat auditory cortex.Neuroreport. 1995 Aug 21;6(12):1645-8. doi: 10.1097/00001756-199508000-00014. Neuroreport. 1995. PMID: 8527733
-
Behavioral and neural measures of auditory temporal acuity in aging humans and mice.Neurobiol Aging. 2002 Jul-Aug;23(4):565-78. doi: 10.1016/s0197-4580(02)00008-8. Neurobiol Aging. 2002. PMID: 12009506 Clinical Trial.
-
Evolutionary conservation and neuronal mechanisms of auditory perceptual restoration.Hear Res. 2011 Jan;271(1-2):54-65. doi: 10.1016/j.heares.2010.05.011. Epub 2010 Jun 10. Hear Res. 2011. PMID: 20541597 Free PMC article. Review.
-
Neural interactions in unilateral colliculus and between bilateral colliculi modulate auditory signal processing.Front Neural Circuits. 2013 Apr 19;7:68. doi: 10.3389/fncir.2013.00068. eCollection 2013. Front Neural Circuits. 2013. PMID: 23626523 Free PMC article. Review.
Cited by
-
Spatiotemporal Spike Coding of Behavioral Adaptation in the Dorsal Anterior Cingulate Cortex.PLoS Biol. 2015 Aug 12;13(8):e1002222. doi: 10.1371/journal.pbio.1002222. eCollection 2015 Aug. PLoS Biol. 2015. PMID: 26266537 Free PMC article.
-
Neural coding of time-varying interaural time differences and time-varying amplitude in the inferior colliculus.J Neurophysiol. 2017 Jul 1;118(1):544-563. doi: 10.1152/jn.00797.2016. Epub 2017 Apr 5. J Neurophysiol. 2017. PMID: 28381487 Free PMC article.
-
Subcortical auditory model including efferent dynamic gain control with inputs from cochlear nucleus and inferior colliculus.J Acoust Soc Am. 2023 Dec 1;154(6):3644-3659. doi: 10.1121/10.0022578. J Acoust Soc Am. 2023. PMID: 38051523 Free PMC article.
-
Neurometric amplitude modulation detection in the inferior colliculus of Young and Aged rats.Hear Res. 2024 Jun;447:109028. doi: 10.1016/j.heares.2024.109028. Epub 2024 May 3. Hear Res. 2024. PMID: 38733711 Free PMC article.
-
Forward masking in the inferior colliculus: Dynamics of discharge-rate recovery after narrowband noise maskers.J Acoust Soc Am. 2025 May 1;157(5):3680-3693. doi: 10.1121/10.0036741. J Acoust Soc Am. 2025. PMID: 40358229
References
-
- Attias H, Schreiner CE. Advances in neural information processing systems. Vol 9. Cambridge: MIT; 1997. Low-order temporal statistics of natural sounds; pp. 27–33.
Publication types
MeSH terms
Grants and funding
LinkOut - more resources
Full Text Sources
Other Literature Sources
Miscellaneous