. 2014 Jan 22;34(4):1333-43.
doi: 10.1523/JNEUROSCI.2477-13.2014.

Expression of proteolipid protein gene in spinal cord stem cells and early oligodendrocyte progenitor cells is dispensable for normal cell migration and myelination

Affiliations

Expression of proteolipid protein gene in spinal cord stem cells and early oligodendrocyte progenitor cells is dispensable for normal cell migration and myelination

Danielle E Harlow et al. J Neurosci. .

Abstract

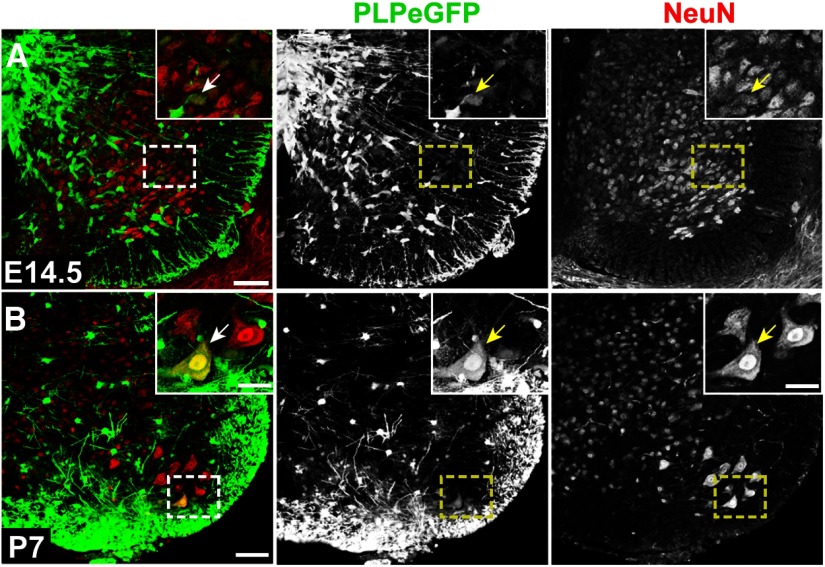
Plp1 gene expression occurs very early in development, well before the onset of myelination, creating a conundrum with regard to the function of myelin proteolipid protein (PLP), one of the major proteins in compact myelin. Using PLP-EGFP mice to investigate Plp1 promoter activity, we found that, at very early time points, PLP-EGFP was expressed in Sox2+ undifferentiated precursors in the spinal cord ventricular zone (VZ), as well as in the progenitors of both neuronal and glial lineages. As development progressed, most PLP-EGFP-expressing cells gave rise to oligodendrocyte progenitor cells (OPCs). The expression of PLP-EGFP in the spinal cord was quite dynamic during development. PLP-EGFP was highly expressed as cells delaminated from the VZ. Expression was downregulated as cells moved laterally through the cord, and then robustly upregulated as OPCs differentiated into mature myelinating oligodendrocytes. The presence of PLP-EGFP expression in OPCs raises the question of its role in this migratory population. We crossed PLP-EGFP reporter mice into a Plp1-null background to investigate the role of PLP in early OPC development. In the absence of PLP, normal numbers of OPCs were generated and their distribution throughout the spinal cord was unaffected. However, the orientation and length of OPC processes during migration was abnormal in Plp1-null mice, suggesting that PLP plays a role either in the structural integrity of OPC processes or in their response to extracellular cues that orient process outgrowth.

Keywords: OPC; PLP; migration; myelination; oligodendrocyte; proteolipid protein.


Figures

Figure 1.
Figure 1.
Dynamic Plp1 expression in the developing spinal cord. A, At E12.5, PLP-EGFP expression (green) was very robust in cells in the VZ. B, At E16.5, fewer cells within the VZ expressed PLP-EGFP, and PLP-EGFP+ cells were dispersed throughout the ventral and dorsal regions of the cord. C, At P7, no cells in the VZ remained PLP-EGFP+ and robust PLP-EGFP expression was seen in the lateral white matter. D–F, PLP/DM20 mRNA expression corresponded to PLP-EGFP expression in the developing spinal cord at E12.5 (D), E16.5 (E), and P7 (F). G, PLP expression in PLP-EGFP+ oligodendrocyte progenitors in the E16.5 spinal cord. Immunostaining for PLP (red) colocalized with EGFP expression in oligodendrocyte progenitor cells in the spinal cord. PLP (red) could be seen in the distal tips of OPCs while PLP-EGFP localized to the cell body as well as processes. Scale bar: A, B, 50 μm; C, 200 μm; G, 10 μm.
Figure 2.
Figure 2.
PLP-EGFP is expressed in multiple progenitor populations in the VZ of the E12.5 spinal cord. A, Many PLP-EGFP-expressing cells (green) were unspecified Sox2-positive (red) progenitors (arrows). B, At the dorsal limit of PLP-EGFP expression in the VZ, a small number of cells (arrows) were Pax6-positive (red). C, Most Nkx2.2 cells (red) were negative for PLP-EGFP at this stage, although within the VZ, some double-labeled cells were present (arrow). D, All Olig2-expressing cells (red) in the VZ of the pMN domain were positive for PLP-EGFP (arrows). E, In the same section as D, all PDGFRα-positive cells (pseudocolored red) seen delaminating from the VZ also labeled with PLP-EGFP. Dashed boxes indicate regions shown at higher magnification at right.
Figure 3.
Figure 3.
Olig2+, PDGFRα+ oligodendrocyte progenitor cells expressed PLP-EGFP throughout the E14.5 spinal cord. A, PLP-EGFP expression (green) in the cervical spinal cord at E14.5. White boxes indicate regions shown in C–E. B, PLP-EGFP+ progenitors within the VZ continued to express Sox2 (red). C, In the dorsal spinal cord, OPCs immunolabeled with Olig2 (red) and PDGFRα (blue) also expressed PLP-EGFP. D, E, In the ventral cord, PLP-EGFP was expressed by Olig2+ cells in the ventral VZ (D) as well as by OPCs throughout the lateral cord (E). White arrows indicate examples of triple-labeled cells. Asterisks indicate blood vessels. Scale bars: A, 25 μm; B, 100 μm; C–E, 50 μm.
Figure 4.
Figure 4.
Oligodendrocyte progenitor cells downregulated PLP-EGFP expression as they migrated laterally at E16.5 and in the P7 cord. A, PLP-EGFP expression (green) in the cervical spinal cord at E16.5. B, In the dorsal cord, some Olig2+/PDGFRα+ OPCs no longer express PLP-EGFP (double-headed arrows) while others continued to express PLP-EGFP (single-headed arrows). C, In the VZ, fewer cells expressed PLP-EGFP at E16.5. Within the IZ, many Olig2+/PDGFRα+ OPCs expressed PLP-EGFP (single-headed arrows), while more laterally located OPCs were PLP-EGFP-negative (double-headed arrows). D, In the pWM, no PLP-EGFP expression was seen in the most lateral Olig2+/PDGFRα+ OPCs (double-headed arrows). E, Many PDGFRα+ (blue) and Olig2+ (red) OPCs in the gray matter were PLP-EGFP-negative or expressed very low levels of PLP-EGFP (arrows), while myelinating oligodendrocytes had robust PLP-EGFP expression and nuclear Olig2 expression (red, inset). F, PLP-EGFP colocalized with MBP expression (red), indicating these cells are mature myelinating oligodendrocytes. Scale bars: A, 100 μm; B–D, 50 μm; E, inset, 10 μm; F, 50 μm.
Figure 5.
Figure 5.
PLP-EGFP expression in neurons in the embryonic and postnatal spinal cord. A, PLP-EGFP expression (green) in NeuN+ (red) neurons (arrow, inset) in the ventral horn of the spinal cord at E14.5. B, At P7, PLP-EGFP was very rarely seen in NeuN+ (red) neurons (arrow, inset). Dashed boxes indicate regions shown in inset. Scale bars: A, B, 50 μm; inset, 10 μm.
Figure 6.
Figure 6.
PLP-EGFP expression in astrocytes in the embryonic and postnatal spinal cord. A–C, At E16.5 (A), PLP-EGFP (green) expression was seen in GFAP+ (red) astrocyte progenitors (arrowheads) in the cord, including in bipolar (B) and process-bearing (C) GFAP+ astrocytes. D, Note robust expression of PLP (blue) in oligodendrocytes (D, double-headed arrows) but not in astrocytes (B, C, arrowheads). E, At P7, very low levels of PLP-EGFP were seen in a fraction of GFAP+ (red) astrocytes (F, G, arrowheads), although PLP-EGFP levels were much higher in oligodendrocytes (F, double-headed arrows) that also expressed PLP (blue). E–G, Some astrocytes (E) expressed low levels of PLP-EGFP in their cell bodies (F, G, arrowheads) although many astrocytes were not GFP+, and no astrocytes expressed PLP (blue). Dashed boxes in A and E depict regions of shown in B–D and F–G. Scale bars: A, E, 100 μm; (in G) B–D, F, G, 10 μm.
Figure 7.
Figure 7.
Radial glia and OPCs were generated normally in E12.5 Plp1-null spinal cords. A, B, PLP-EGFP+ (green) and Nestin+ (red) radial glia at E12.5 (A) wild-type spinal cord and (B) Plp1-null cord. C, PDGFRα+ OPCs in the VZ of E12.5 wild-type spinal cord. D, Generation of PDGFRα+ OPCs was not disrupted in Plp1-null spinal cords. Scale bar: B, D, 50 μm.
Figure 8.
Figure 8.
In Plp1-null spinal cords, OPCs were distributed normally, although cells had disorganized processes in vivo and migrated more quickly in vitro. A, In wild-type spinal cords at E16.5, PLP-EGFP (green) cells extended radially orientated processes toward the pial surface. B, In Plp1-null cords at E16.5, processes of PLP-EGFP cells were shorter and more randomly aligned. Many of these cells also expressed PDGFRα (blue) and Olig2 (red) as indicated by white arrows. Red arrows indicate Olig2+/PDGFRα+ cells that were negative for PLP-EGFP. Yellow arrows indicate PLP-EGFP+ cells that were negative for Olig2 and PDGFRα. Asterisks indicate blood vessels. C, The total number of Olig2+/PDGFRα+ OPCs and their distribution throughout the cord was the same in wild-type and Plp1-null cords. D, In Plp1-null spinal cords, there was a significant increase (**p < 0.0001, t test, 2-tailed) in the number of randomly aligned PLP-EGFP+ processes compared with wild type. E, PLP-EGFP+ processes were significantly shorter in the ventral cord of Plp1-null animals compared with wild type (*p = 0.013, t test, 2-tailed), but did not differ in the dorsal cord. Graphs represent group means ± SEM. F, The population of Plp1-null OPCs migrated significantly faster in live imaging analysis of cell migration in vitro compared with wild-type OPCs (‡p < 0.01, Mann–Whitney U test). G, Plp1-null OPCs also migrated over greater distances compared with wild-type OPCs (‡p < 0.01, Mann–Whitney U test). Frequency histograms represent the total number of cells tracked (291 wild type and 231 Plp1 null) across four experiments. Scale bar, 50 μm.
Figure 9.
Figure 9.
Normal levels of MBP in P7 spinal cords of Plp1-null mice. A, Wild-type PLP-EGFP+ oligodendrocytes expressed PLP (blue) in their processes throughout the gray and white matter. B, No PLP was detected in Plp1-null cords. C, D, MBP was present in PLP-EGFP+ oligodendrocytes in both wild-type (C) and Plp1-null (D) cords. E, Western blot analysis of P7 wild-type and Plp1-null spinal cord lysates for PLP/DM20, MBP, and β-tubulin. Quantification of MBP levels normalized to β-tubulin was similar between wild-type and Plp1-null mice at P7. n.s., Not significantly different.

Similar articles

Cited by

References

    1. Avilion AA, Nicolis SK, Pevny LH, Perez L, Vivian N, Lovell-Badge R. Multipotent cell lineages in early mouse development depend on SOX2 function. Genes Dev. 2003;17:126–140. doi: 10.1101/gad.224503. - DOI - PMC - PubMed
    1. Boison D, Stoffel W. Disruption of the compacted myelin sheath of axons of the central nervous system in proteolipid protein-deficient mice. Proc Natl Acad Sci U S A. 1994;91:11709–11713. doi: 10.1073/pnas.91.24.11709. - DOI - PMC - PubMed
    1. Boucheix C, Rubinstein E. Tetraspanins. Cell Mol Life Sci. 2001;58:1189–1205. doi: 10.1007/PL00000933. - DOI - PMC - PubMed
    1. Cai J, Chen Y, Cai WH, Hurlock EC, Wu H, Kernie SG, Parada LF, Lu QR. A crucial role for Olig2 in white matter astrocyte development. Development. 2007;134:1887–1899. doi: 10.1242/dev.02847. - DOI - PubMed
    1. Delaunay D, Heydon K, Cumano A, Schwab MH, Thomas JL, Suter U, Nave KA, Zalc B, Spassky N. Early neuronal and glial fate restriction of embryonic neural stem cells. J Neurosci. 2008;28:2551–2562. doi: 10.1523/JNEUROSCI.5497-07.2008. - DOI - PMC - PubMed

Publication types

MeSH terms

Substances

LinkOut - more resources