. 2014 Jan 22;34(4):1542-53.
doi: 10.1523/JNEUROSCI.2341-13.2014.

p140Cap regulates memory and synaptic plasticity through Src-mediated and citron-N-mediated actin reorganization

Affiliations

p140Cap regulates memory and synaptic plasticity through Src-mediated and citron-N-mediated actin reorganization

Daniele Repetto et al. J Neurosci. .

Abstract

A major challenge in the neuroscience field is the identification of molecules and pathways that control synaptic plasticity and memory. Dendritic spines play a pivotal role in these processes, as the major sites of excitatory synapses in neuronal communication. Previous studies have shown that the scaffold protein p140Cap localizes into dendritic spines and that its knockdown negatively modulates spine shape in culture. However, so far, there is no information on its in vivo relevance. By using a knock-out mouse model, we here demonstrate that p140Cap is a key element for both learning and synaptic plasticity. Indeed, p140Cap(-/-) mice are impaired in object recognition test, as well as in LTP and in LTD measurements. The in vivo effects of p140Cap loss are presumably attenuated by noncell-autonomous events, since primary neurons obtained from p140Cap(-/-) mice show a strong reduction in number of mushroom spines and abnormal organization of synapse-associated F-actin. These phenotypes are most likely caused by a local reduction of the inhibitory control of RhoA and of cortactin toward the actin-depolymerizing factor cofilin. These events can be controlled by p140Cap through its capability to directly inhibit the activation of Src kinase and by its binding to the scaffold protein Citron-N. Altogether, our results provide new insight into how protein associated with dynamic microtubules may regulate spine actin organization through interaction with postsynaptic density components.

Keywords: Cit-N; Rho GTPase; Src; actin cytoskeleton; p140Cap; synapses.


Figures

Figure 1.
Figure 1.
Generation and validation of p140Cap-deficient mouse model. A, Schematic representation of the domain structure and of the known interactors of p140Cap. Pro, Prolin-rich region; C1–C2, coiled-coil regions; CH1-CH2, charged regions. B, Schematic representation of mouse recombinant p140Cap construct; the neomicin cassette (NeoR) disruption was targeted into exon 8 of p140Cap gene on mouse chromosome 11. C, PCR screening of tail-derived genomic DNA from littermate bred from heterozygous mice. The controls showed in figure are vectors used for targeting strategy. D, Western blot detection of p140Cap protein levels in total brain cell lysates from mice of the indicated genotypes.
Figure 2.
Figure 2.
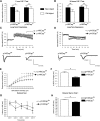
p140Cap−/− mice display reduced memory consolidation and impaired synaptic plasticity. A, B, p140Cap−/− mice display impairment in visual ORT. After habituation and familiarization, when mice were tested in the ORT, mean exploration time for the novel object (open bar) was greater than for the familiar one (black bar) in p140Cap+/+ (n = 14) but not in p140Cap−/− mice (n = 14), both at 1 h (A) and at 24 h (B; paired t test, p140Cap+/+ mice, p = 0.011 and p = 0.002 for 1 and 24 h, respectively; p140Cap−/− mice, p = 0.53 and p = 0.55 at 1 and 24 h, respectively). *p < 0.05; **p < 0.01; n.s., Nonsignificant. C, D, p140Cap is important for synaptic plasticity both of the LTD and of the LTP type. C, Mean normalized fEPSP amplitude is reported for p140Cap+/+ (n = 10 slices) and p140Cap−/− (n = 11 slices) mice as a function of time. Paired t test, last 15 min post-theta versus baseline in p140Cap−/− mice, p > 0.34; in p140Cap+/+, p = 0.004; t test, last 15 min, p140Cap−/− versus p140Cap+/+ mice, p = 0.032. D, Mean normalized fEPSP amplitude is reported for p140Cap+/+ (n = 5 slices) and p140Cap−/− (n = 4 slices) mice as a function of time. t test, p < 0.001; Mann–Whitney rank sum test. Sample traces are shown at the bottom of the two panels. Gray, Baseline activity; black, post-theta burst stimulus/low-frequency stimulation. E, F, Basal synaptic transmission is reduced in perirhinal cortex of p140Cap−/− mice. E, Mean amplitude of layer II/III field potential (fEPSP)-evoked stimulating layer II/III on the temporal side of the recording electrode is plotted against stimulus amplitude in p140Cap+/+ (n = 10 slices) and in p140Cap−/− (n = 11 slices) mice. Two-way repeated-measures ANOVA, stimulus intensity × genotype, stimulus intensity and interaction intensity × genotype, p < 0.001. For a given stimulus intensity: *p < 0.05, **p < 0.01, Holm-Sidak post hoc test. F, Mean fEPSP amplitude recorded at 50% of response amplitude range in p140Cap+/+ and p140Cap−/− mice (t test, p = 0.019). G, H, p140Cap−/− mice display impaired motor memory. Performance in motor memory is reported as latency to fall from the rota-rod apparatus. G, Mean time to fall during weekly sessions, for five consecutive sessions. H, Mean performance in the first trial of each session reported in C. One-way ANOVA test with post-test Bonferroni.
Figure 3.
Figure 3.
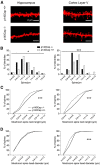
p140Cap−/− mice show abnormal organization and morphology of DSs. A, Representative confocal micrographs showing DiOlistic fluorescent labeling of DSs protruding from hippocampus CA1 (left) and layer V cortical (right) pyramidal neurons in apical dendrites of 1-month-old p140Cap−/− and age-matched wild-type littermates. B–D, Quantitative analysis of the frequency distribution of spine density (B), spine neck lengths (C), and spine head diameters (D) in the stratum radiatum of the CA1 area of the hippocampus (left) and in the layer V of the S1 cortex (right). Scale bars, 2 μm; *p < 0.05, ***p < 0.001; n = 5 for each genotype.
Figure 4.
Figure 4.
p140Cap−/− cultured hippocampal neurons show reduction of mature mushroom-shaped dendritic spines and actin disorganization. A, B, Primary hippocampal neurons from mice of the indicated genotypes were transfected at 18 DIV with p-mRFP for indications of protrusions filling in (red). At 21 DIV, neurons were fixed, stained for postsynaptic density marker PSD95 (green), and processed for immunofluorescence (A). The different types of protrusions were then quantified in the intermediate tract of dendrites (B) and differences were evaluated by one-way ANOVA test with post-test Bonferroni. *p < 0.05; **p < 0.01. C–F, Primary hippocampal neurons from mice of the indicated genotypes were processed for immunofluorescence at 21 DIV and stained for F-actin with phalloidin (C, E), for the presynaptic marker Bassoon (C, D), or for the postsynaptic marker PSD95 (D, E). The intermediate tracts of representative dendrites are shown. D, Arrows, Actin accumulations juxtaposed to Bassoon clusters. F, Arrows, Actin accumulations colocalizing with PSD95 clusters. The colocalization between the above signals was quantified (F) by measuring the percentage of the first indicated immunoreactivity clusters that overlapped or closely juxtaposed with clusters of the second immunoreactivity. Note that no statistically significant differences in colocalization were observed between genotypes. Scale bars, 10 μm.
Figure 5.
Figure 5.
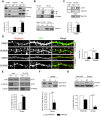
p140Cap controls Src and RhoA GTPase activities in synaptosomal fractions. A, Total brain extracts, cytosolic fractions, and crude synaptosomal fraction from p140Cap+/+ and p140Cap−/− mice were prepared and Western blot analysis was performed with antibodies to p140Cap, active p-Src (Y416), total Src, and vinculin as loading control. B, Top, Kinase assays were performed on Src immunoprecipitated from p140Cap+/+ and p140Cap−/− crude synaptosomal fractions in the presence of the substrate enolase for 30 s. An unrelated polyclonal antibody was used as negative control (Ctrl). The reaction was run on 8% SDS-PAGE and exposed to autoradiography. Bottom, Half of the above immunoprecipitates, together with 50 μg of total cell extract from p140Cap+/+ synaptosomes (input), was run in parallel 8% SDS-PAGE and blotted with antibodies to total Src for loading control. C, Protein extracts from synaptosomal fractions of p140Cap+/+ and p140Cap−/− mice were immunoprecipitated with anti-cortactin (Cttn) antibodies. Total and Y421-phosphorylated Cttn were then measured by Western blotting. D, p140Cap+/+ and p140Cap−/− hippocampal neurons were transfected at 18 DIV with p-EGFP for filling (green). At 21 DIV they were then treated with vehicle (DMSO) or with 10 μm SU6656 Src kinase inhibitor for 16 h, fixed, and stained with phalloidin. The density phalloidin-positive mushroom spines was then quantified. Scale bars, 5 μm. E, Synaptosomal fractions from p140Cap+/+ and p140Cap−/− mice were lyzed in hot Laemmly buffer (Input) or immunoprecipitated with antibodies to p190RhoGAP. Western blot was then performed with antibodies recognizing phosphotyrosine (p-Tyr), p190RhoGAP, p140Cap, and tubulin for loading control. F, Synaptosomal fractions from p140Cap+/+ and p140Cap−/− mice were adsorbed to GST-mammalian diaphanous formins for assessing RhoA activity (Kimura et al., 2000). HEK-293 cells were used as positive control. Western blot was performed with RhoA antibodies. G, Top, Synaptosomal fraction from p140Cap+/+ and p140Cap−/− mice were blotted with antibodies to p-cofilin (Ser 3) and total cofilin. All the total lysates and the synaptosomal preparations used for this figure were obtained from 6–7 pulled mice brains for each genotype. In all quantifications, values represent the average of three independent preparations. Error bars, SE; *p < 0.05, **p < 0.01; two-tailed paired Student's t test.
Figure 6.
Figure 6.
p140Cap interacts with DS-specific scaffold protein Cit-N for the regulation of spine morphology. A, Total brain extracts from p140Cap+/+ and p140Cap−/− mice, obtained as in Figure 5, were immunoprecipitated with antibodies to Cit-N. Western blot was performed with antibodies to Cit-N, p140Cap, and Src. B, Synaptosomal fractions from p140Cap+/+ and p140Cap−/− mice, obtained as in Figure 5, were immunoprecipitated with antibodies to Src. Western blot was performed with antibodies to Cit-N, p140Cap, and Src. C, HEK-293 cells were transfected with p-EGFP, Cit-N, and p140Cap expression constructs as indicated. At 72 h, cell extracts were immunoprecipated with antibodies to Src. Western blot was performed with antibodies to Cit-N, p140Cap, and Src. D, HEK-293 cells were transfected with Cit-N expression construct as indicated and 48 h later were treated with 10 μm SU6656 Src kinase inhibitor or vehicle (DMSO) for an additional 16 h. Cell extracts were then immunoprecipated with antibodies to Src. Western blot was performed with antibodies to Src and Cit-N. E, Synaptosomal fractions from p140Cap+/+ and p140Cap−/− mice, obtained as in Figure 5, were immunoprecipitated with antibodies to Cit-N. Immunoprecipitates were run with total extracts from brain or synaptosomes. Western blot was then performed with the indicated antibodies. In all the cases shown above, blots are representative examples of ≥3 independent biological replicates. F–H, Primary rat hippocampal neurons were cotransfected at 18 DIV with p-EGFP for filling (green), alongside with the indicated myc-tagged expression constructs and with the indicated shRNA plasmids (Camera et al., 2008; Jaworski et al., 2009). At 21 DIV, neurons were fixed and stained with antibodies anti-GFP and anti-myc and with phalloidin (PHD). Scale bars, 5 μm. I, Quantification of mushroom spines (white box) and filopodial protrusions (black box) in middle dendrites in the above experiments, and in a parallel experiment performed with EB3-specific shRNAs. O.E., Myc-tagged overexpression constructs. Histograms represent the average of three independent experiments, with ≥6 cells for every condition. Error bars, SD. Asterisks indicate the statistical significance of the difference with the samples transfected only with control shRNA vector. Two-tailed paired Student's t test. *p < 0.05, **p < 0.01.
Figure 7.
Figure 7.
p140Cap controls actin dynamics to promote organization of mushroom DSs. A, Core functional complex that includes p140Cap, Src, Cit-N, and cortactin may control actin organization in DSs. p140Cap can either decrease Src-dependent tyrosine phosphorylation of p190RhoGAP or affect the local recruitment of active RhoA through Cit-N. These two pathways may converge on RhoA activation, which regulates the levels of inactive cofilin. The latter can also be controlled by direct binding to cortactin, which is regulated by Src-mediated phosphorylation. Thus, p140Cap may locally restrain the activity of cofilin through different Src-mediated pathways, promoting actin polymerization and formation of mushroom spines.

References

    1. Arellano JI, Benavides-Piccione R, Defelipe J, Yuste R. Ultrastructure of dendritic spines: correlation between synaptic and spine morphologies. Front Neurosci. 2007;1:131–143. doi: 10.3389/neuro.01.1.1.010.2007. - DOI - PMC - PubMed
    1. Arthur WT, Petch LA, Burridge K. Integrin engagement suppresses RhoA activity via a c-Src-dependent mechanism. Curr Biol. 2000;10:719–722. doi: 10.1016/S0960-9822(00)00537-6. - DOI - PubMed
    1. Banker G, Goslin K. Developments in neuronal cell culture. Nature. 1988;336:185–186. doi: 10.1038/336185a0. - DOI - PubMed
    1. Brouns MR, Matheson SF, Settleman J. p190 RhoGAP is the principal Src substrate in brain and regulates axon outgrowth, guidance and fasciculation. Nat Cell Biol. 2001;3:361–367. doi: 10.1038/35070042. - DOI - PubMed
    1. Brown MW, Aggleton JP. Recognition memory: what are the roles of the perirhinal cortex and hippocampus? Nat Rev Neurosci. 2001;2:51–61. doi: 10.1038/35049064. - DOI - PubMed

Publication types

MeSH terms