. 2014 Apr;88(8):4083-99.
doi: 10.1128/JVI.03775-13. Epub 2014 Jan 22.

Efficacy and mechanism of a glycoside compound inhibiting abnormal prion protein formation in prion-infected cells: implications of interferon and phosphodiesterase 4D-interacting protein

Affiliations

Efficacy and mechanism of a glycoside compound inhibiting abnormal prion protein formation in prion-infected cells: implications of interferon and phosphodiesterase 4D-interacting protein

Keiko Nishizawa et al. J Virol. 2014 Apr.

Abstract

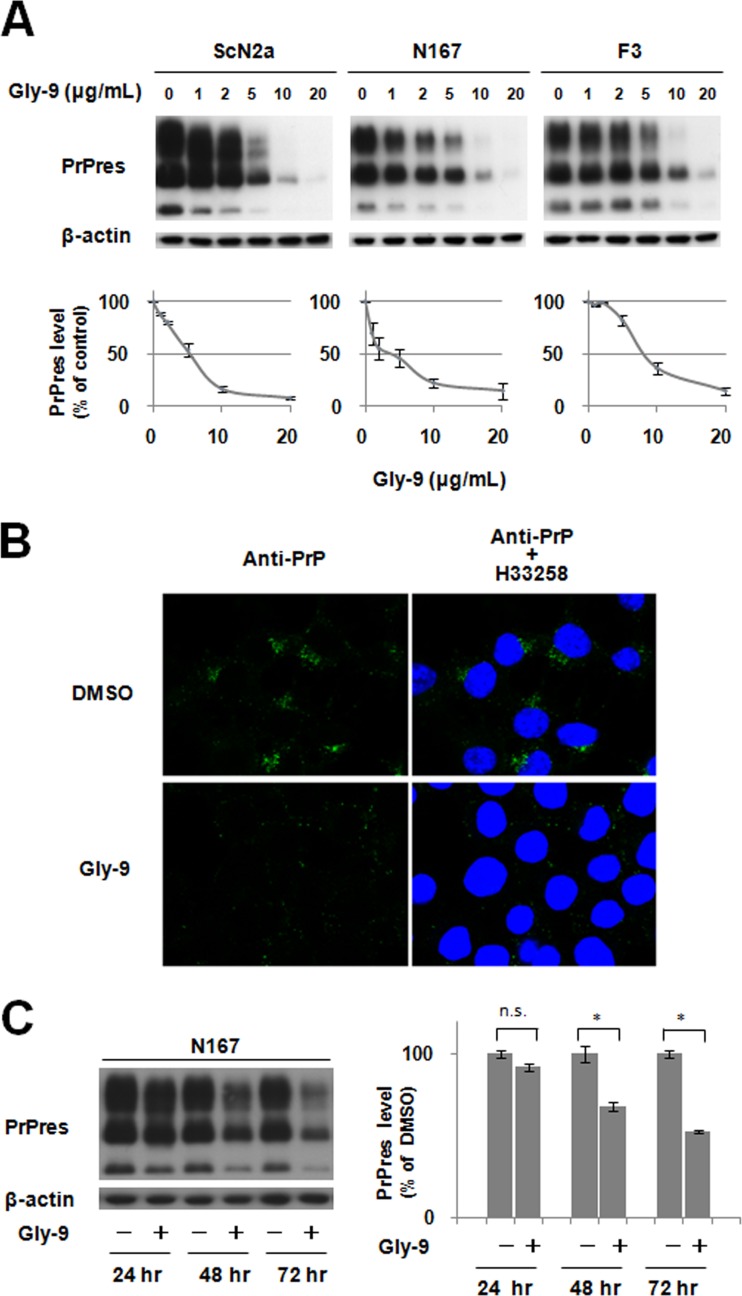
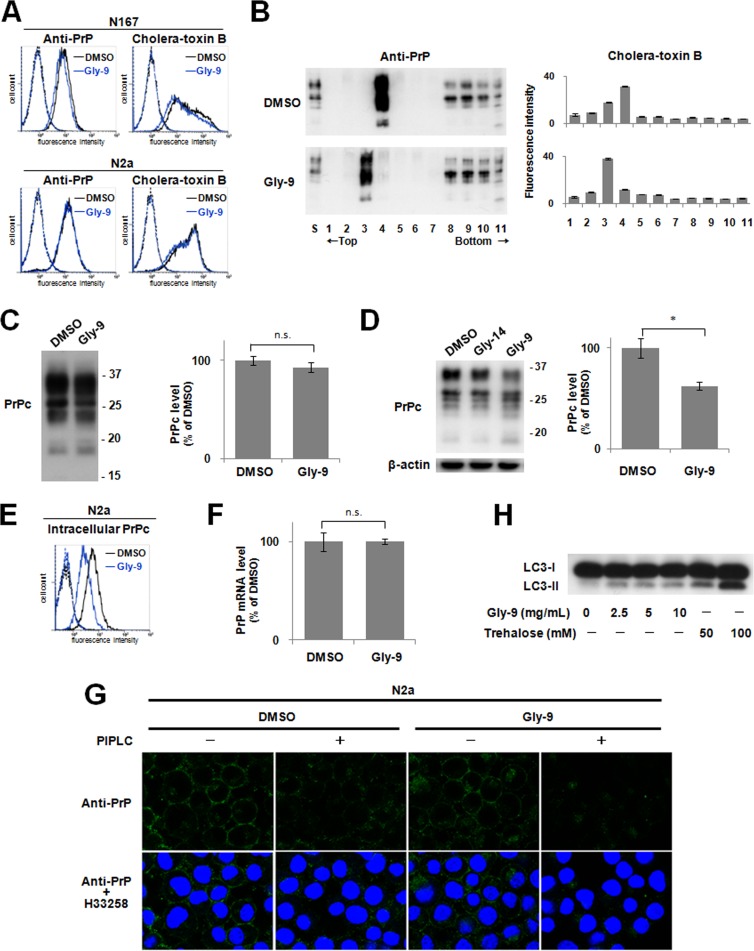
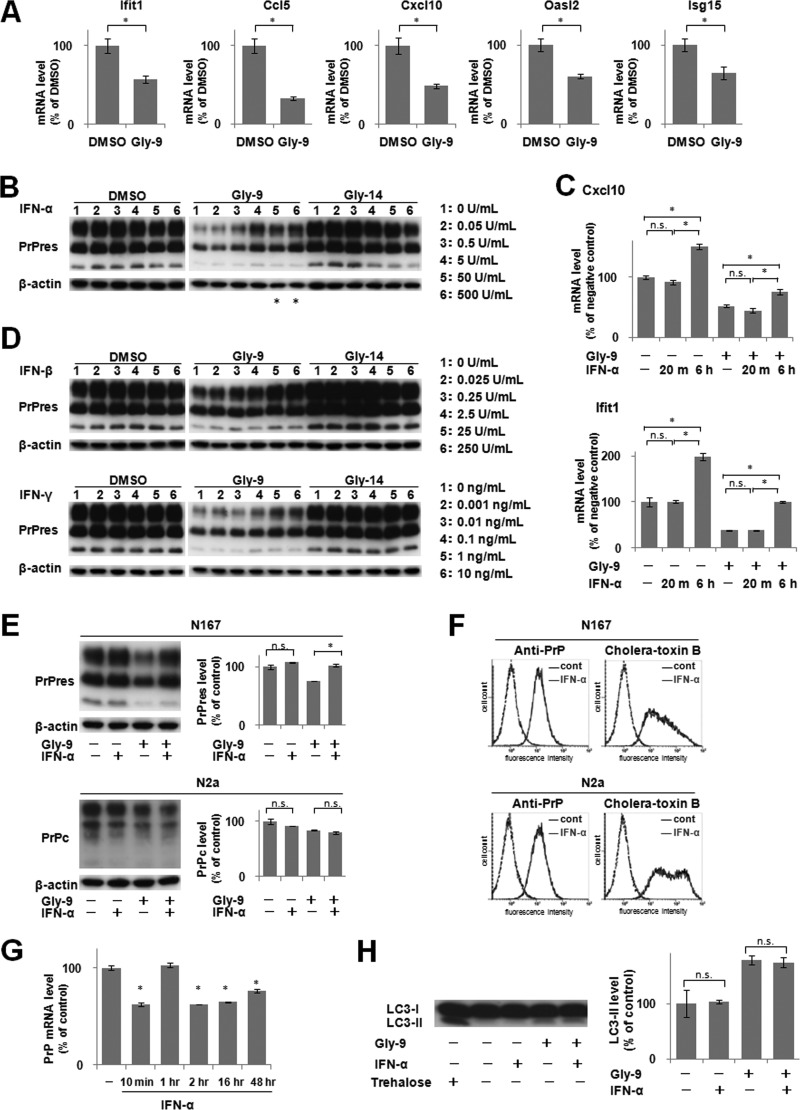
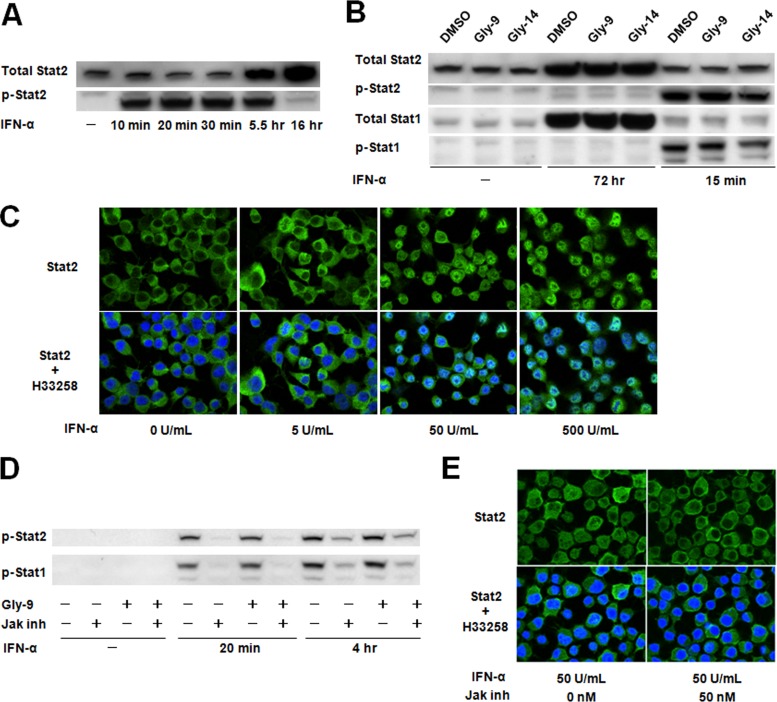
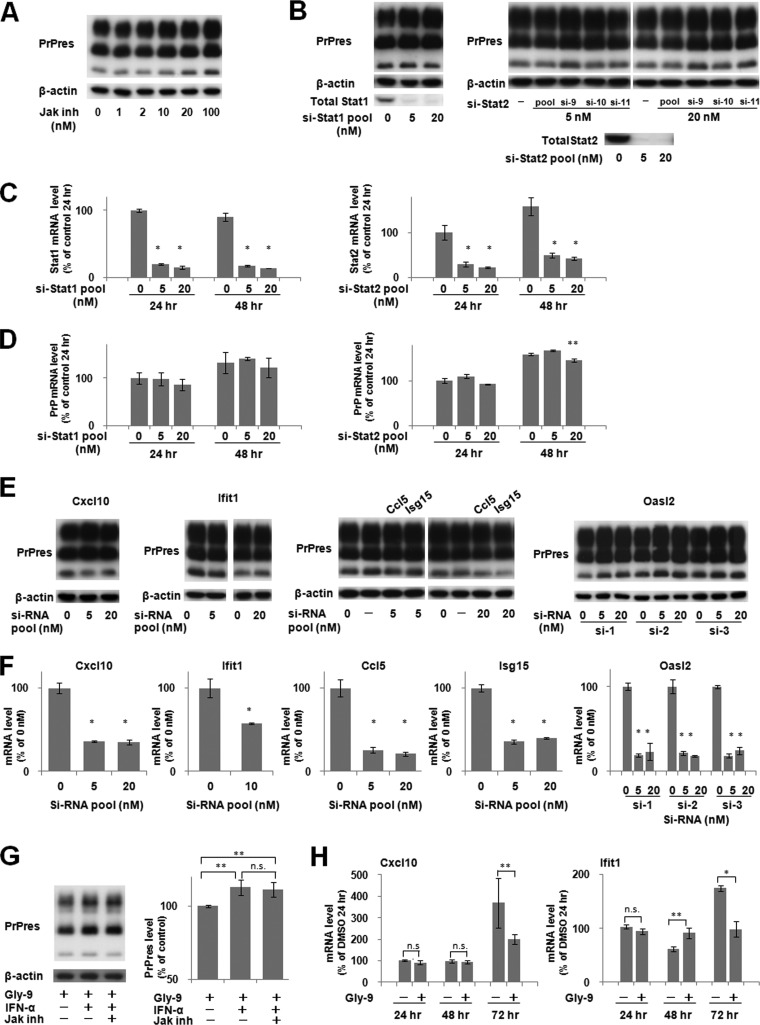
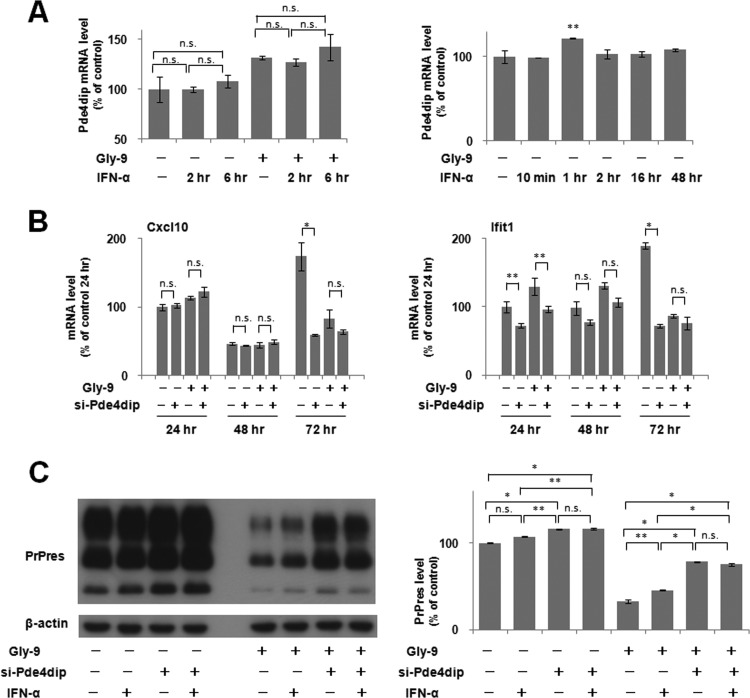
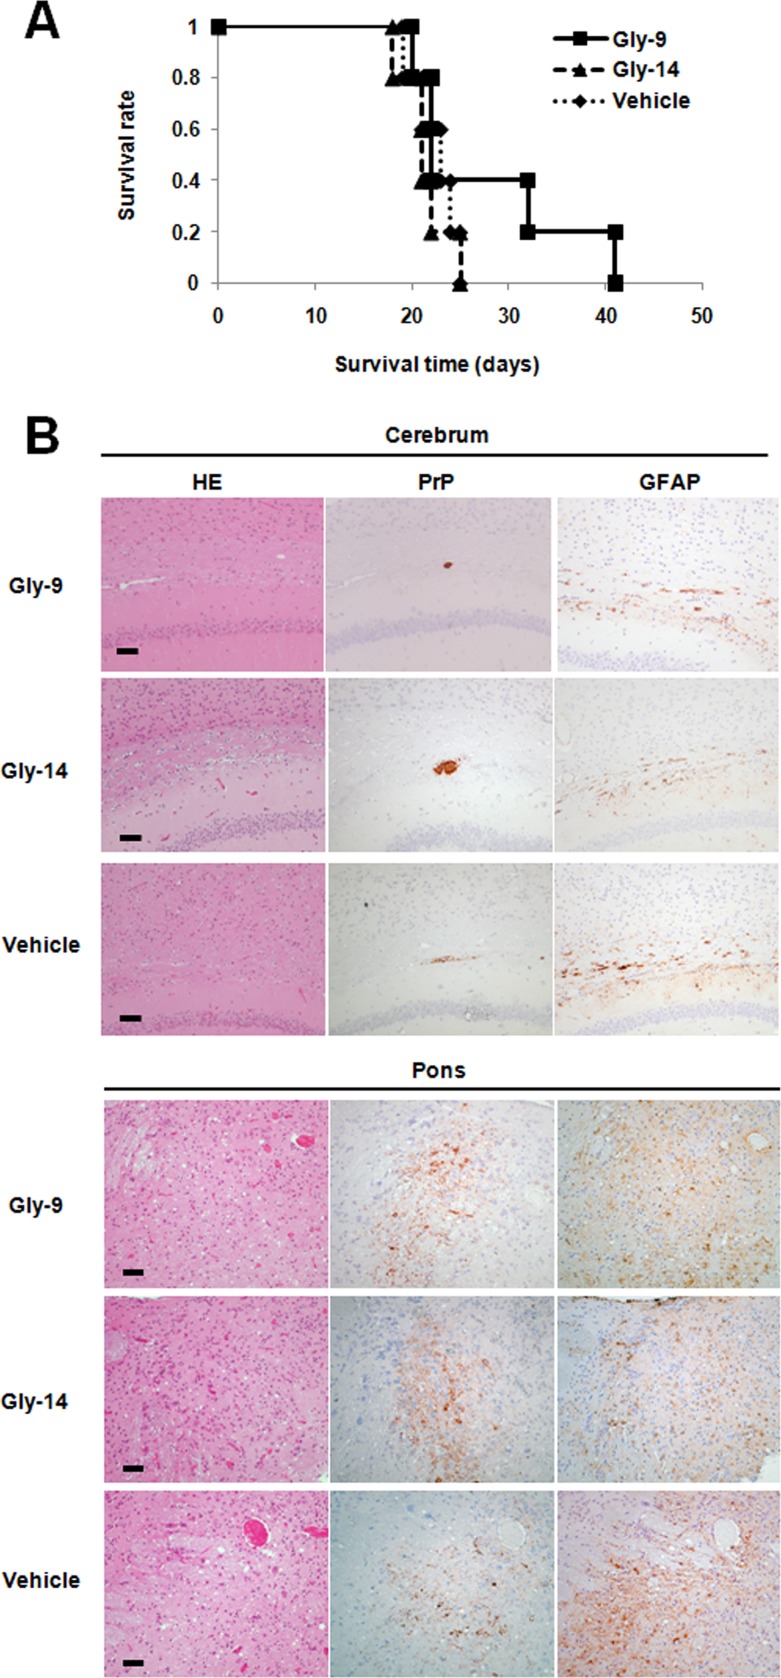
A new type of antiprion compound, Gly-9, was found to inhibit abnormal prion protein formation in prion-infected neuroblastoma cells, in a prion strain-independent manner, when the cells were treated for more than 1 day. It reduced the intracellular prion protein level and significantly modified mRNA expression levels of genes of two types: interferon-stimulated genes were downregulated after more than 2 days of treatment, and the phosphodiesterase 4D-interacting protein gene, a gene involved in microtubule growth, was upregulated after more than 1 day of treatment. A supplement of interferon given to the cells partly restored the abnormal prion protein level but did not alter the normal prion protein level. This interferon action was independent of the Janus activated kinase-signal transducer and activator of transcription signaling pathway. Therefore, the changes in interferon-stimulated genes might be a secondary effect of Gly-9 treatment. However, gene knockdown of phosphodiesterase 4D-interacting protein restored or increased both the abnormal prion protein level and the normal prion protein level, without transcriptional alteration of the prion protein gene. It also altered the localization of abnormal prion protein accumulation in the cells, indicating that phosphodiesterase 4D-interacting protein might affect prion protein levels by altering the trafficking of prion protein-containing structures. Interferon and phosphodiesterase 4D-interacting protein had no direct mutual link, demonstrating that they regulate abnormal prion protein levels independently. Although the in vivo efficacy of Gly-9 was limited, the findings for Gly-9 provide insights into the regulation of abnormal prion protein in cells and suggest new targets for antiprion compounds.

Importance: This report describes our study of the efficacy and potential mechanism underlying the antiprion action of a new antiprion compound with a glycoside structure in prion-infected cells, as well as the efficacy of the compound in prion-infected animals. The study revealed involvements of two factors in the compound's mechanism of action: interferon and a microtubule nucleation activator, phosphodiesterase 4D-interacting protein. In particular, phosphodiesterase 4D-interacting protein was suggested to be important in regulating the trafficking or fusion of prion protein-containing vesicles or structures in cells. The findings of the study are expected to be useful not only for the elucidation of cellular regulatory mechanisms of prion protein but also for the implication of new targets for therapeutic development.


Figures

FIG 1
FIG 1
Gly-9 effects on PrPres formation. (A) Immunoblotting of PrPres in three distinct prion strain-infected cell lines (ScN2a, N167, and F3) treated with Gly-9. Cells were treated for 3 days with the indicated dose of Gly-9. β-Actin signals are shown as controls for the integrity of samples used for PrPres detection. Graphic data are averages and standard deviations for triplicate immunoblot signals. (B) Immunofluorescence of abnormal PrP accumulation in Gly-9-treated N167 cells. Cells were treated with 5 μg/ml Gly-9 or its vehicle (DMSO) for 3 days. Nuclei were stained with Hoechst 33258 (H33258). (C) Temporal profile of PrPres levels in Gly-9-treated N167 cells. Cells were treated with 10 μg/ml Gly-9 or its vehicle for the indicated periods. Graphic data are averages and standard deviations for triplicate immunoblot signals (n.s., not significant; *, P < 0.01).
FIG 2
FIG 2
Gly-9 effects on PrPc, lipid rafts, and autophagy. (A) Flow cytometry of cell surface PrP and lipid rafts in either Gly-9-treated N167 cells or Gly-9-treated uninfected N2a cells. Cells were treated with 5 μg/ml Gly-9 or its vehicle (DMSO) for 3 days. Cell surface PrP and lipid rafts were labeled with anti-PrP antibody and cholera toxin B, respectively. (B) Flotation assay of PrPc and lipid rafts in Gly-9-treated N2a cells. Cells were treated and analyzed as described for panel A. S, starting material. (C) Immunoblotting of lipid raft-associated PrPc in Gly-9-treated N2a cells. Cholera toxin B-positive lipid raft fractions from panel B were collected and analyzed for their PrPc levels. Molecular size markers on the right indicate sizes in kDa. Graphic data are averages and standard deviations for triplicate immunoblot signals (n.s., not significant). (D) Immunoblotting of total PrPc in Gly-9-treated N2a cells. A vehicle (DMSO)-treated cell sample and a Gly-14-treated cell sample are shown as controls. Cells were treated as described for panel A. Molecular size markers on the right indicate sizes in kDa. Graphic data are averages and standard deviations for triplicate immunoblot signals (*, P < 0.01). (E) Flow cytometry of intracellular PrPc in Gly-9-treated N2a cells. Cells were treated as described for panel A and were then digested with PIPLC. Cells were permeated with 0.1% Triton X-100 in PBS, and intracellular PrPc was labeled with anti-PrP antibody. (F) PrP mRNA level in Gly-9-treated N167 cells. Cells were treated as described for panel A. Data are averages and standard deviations for triplicate experiments (n.s., not significant). (G) Immunofluorescence of PrPc in Gly-9-treated N2a cells. Cells were treated as described for panel A for PIPLC “−” images and as described for panel E for PIPLC “+” images. Nuclei were stained with Hoechst 33258 (H33258). (H) Immunoblotting of autophagosome-related LC3-II in Gly-9-treated N167 cells. Cells were treated for 3 days with the indicated doses of Gly-9 or trehalose. Trehalose-treated cell samples are shown as positive controls.
FIG 3
FIG 3
Downregulation of IFN-stimulated genes and effects of IFN supplements. (A) mRNA levels of IFN-stimulated genes in Gly-9-treated N167 cells. Cells were treated with 5 μg/ml Gly-9 or its vehicle (DMSO) for 3 days. Data are averages and standard deviations for triplicate experimental results (*, P < 0.01). (B) Immunoblotting of PrPres in N167 cells treated with IFN-α. Cells in the presence of vehicle (DMSO), 5 μg/ml Gly-9, or 5 μg/ml Gly-14 were treated with the indicated doses of IFN-α for 3 days. The buffer volume and protein content in dosed IFN-α solutions were equilibrated using PBS and BSA. β-Actin signals are shown as controls for the integrity of samples used for PrPres detection. Asterisks denote cell toxicity observed at the designated doses. (C) Profiles of mRNA levels of representative IFN-stimulated genes in N167 cells treated with IFN-α in the presence or absence of Gly-9. The mRNA levels of Cxcl10 and Ifit1 were analyzed in cells that were treated with 5 μg/ml Gly-9 (Gly-9 +) or DMSO (Gly-9 −) for 3 days and, simultaneously, with 5 U/ml IFN-α for the indicated times before the harvest. For “IFN-α −” samples, cells were treated with BSA-containing PBS having amounts of buffer and protein equivalent to those in a 5-U/ml IFN-α solution for 6 h before harvesting. Data are averages and standard deviations for triplicate experimental results (*, P < 0.01; n.s., not significant). (D) Immunoblotting of PrPres in N167 cells treated with IFN-β or IFN-γ. Cells were treated with IFN-β or IFN-γ as described for panel B. As a buffer of the IFN-γ solution, 10 mM sodium phosphate (pH 8.0) was used instead of PBS. (E) Immunoblotting of PrPres in N167 cells and PrPc in N2a cells treated with Gly-9 and IFN-α. Cells were treated with combinations of 5 μg/ml Gly-9 and 5 U/ml IFN-α for 3 days. Each vehicle was used as a negative control. Graphic data are averages and standard deviations for triplicate immunoblot signals (n.s., not significant; *, P < 0.01). (F) Flow cytometry of cell surface PrP and lipid rafts in N167 cells and N2a cells treated with IFN-α. Cells in the presence of 5 μg/ml Gly-9 were treated with 5 U/ml IFN-α or its vehicle (cont) for 3 days. Cell surface PrP (anti-PrP) and lipid rafts (cholera-toxin B) were labeled as described already. (G) PrP mRNA levels in N167 cells treated with IFN-α. Cells were treated with 5 μg/ml Gly-9 for 3 days and, simultaneously, with 5 U/ml IFN-α for the indicated periods before the harvest. Data are averages and standard deviations for triplicate experimental results (*, P < 0.01 versus vehicle control). (H) Immunoblotting of autophagosome-related LC3-II in N167 cells treated with Gly-9 and IFN-α. Cells were treated with combinations of 5 μg/ml Gly-9 and 5 U/ml IFN-α for 3 days. Treatment with 100 mM trehalose is shown as a positive control. Each vehicle was used as a negative control. Graphic data represent averages and standard deviations for triplicate immunoblot signals (n.s., not significant).
FIG 4
FIG 4
Jak-Stat pathway in N167 cells. (A) Immunoblotting of total Stat2 and phosphorylated Stat2 (p-Stat2) in N167 cells treated with IFN-α. Cells were treated for the indicated times with 50 U/ml IFN-α. (B) Immunoblotting of Stat proteins and their activated phosphorylated proteins (p-Stat1 and p-Stat2) in N167 cells treated with IFN-α. Cells in the presence of vehicle (DMSO), 5 μg/ml Gly-9, or 5 μg/ml Gly-14 were treated with IFN-α as described for panel A, for the indicated times. It is noteworthy that Stat proteins in N167 cells were activated by IFN-α irrespective of the presence of glycoside compounds. (C) Immunofluorescence of Stat2 in N167 cells treated with IFN-α. Cells were treated with IFN-α at the designated doses for 20 min before analysis. Nuclei were stained with Hoechst 33258 (H33258). (D) Immunoblotting of phosphorylated Stat proteins (p-Stat1 and p-Stat2) in N167 cells treated with IFN-α and a Jak inhibitor. Cells were treated with 10 U/ml IFN-α for the indicated times in the presence or absence of 5 μg/ml Gly-9 or 50 nM Jak inhibitor I (Jak inh). It is noteworthy that Jak inhibitor I blocked IFN-α-induced activation of Stat proteins irrespective of the presence of Gly-9. (E) Immunofluorescence of Stat2 in N167 cells treated with IFN-α and Jak inhibitor. Cells were treated with 5 μg/ml Gly-9 and 50 U/ml IFN-α for 20 min before analysis, in the presence or absence of 50 nM Jak inhibitor I (Jak inh). Nuclei were stained with Hoechst 33258 (H33258). It is noteworthy that Jak inhibitor I blocked IFN-α-induced translocation of Stat2 into the nucleus.
FIG 5
FIG 5
Effects of alterations in Jak-Stat pathway on PrPres formation. (A) Immunoblotting of PrPres in N167 cells treated with Jak inhibitor. Cells were treated with Jak inhibitor I at the indicated doses for 3 days. The amount of DMSO was equilibrated in all cell culture wells and was less than 0.2%. (B) Immunoblotting of PrPres and Stat proteins in N167 cells treated with siRNAs against Stat genes. Cells were treated for the last 3 days before analysis with the indicated doses of either a mixture of four siRNAs against Stat1 (si-Stat1 pool) or Stat2 (si-Stat2 pool) or each of three siRNAs against Stat2 (si-9, si-10, and si-11). The amount of transfection reagent was equilibrated in all cell culture wells. (C) mRNA levels of Stat genes in N167 cells treated with siRNAs against Stat genes. Cells were treated as described for panel B and were analyzed 24 or 48 h after transfection. Data are averages and standard deviations based on results of triplicate experiments (*, P < 0.01 versus control [transfection reagent alone] at each time point). (D) mRNA levels of the PrP gene in N167 cells treated with siRNAs against Stat genes. Cells were treated and analyzed as described for panel C. Data are averages and standard deviations based on results of triplicate experiments (**, P < 0.05 versus the control [transfection reagent alone] at each time point). (E) Immunoblotting of PrPres in N167 cells treated with siRNAs against IFN-stimulated genes. Cells were treated for the last 3 days before analysis with the indicated doses of either a mixture of four siRNAs (si-RNA pool), against Cxcl10, Ifit1, Ccl5, and Isg15, or each of three siRNAs against Oasl2 (si-1, si-2, and si-3). The amount of transfection reagent was equilibrated in all cell culture wells. (F) mRNA levels of IFN-stimulated genes in N167 cells treated with siRNAs against IFN-stimulated genes. Cells were treated as described for panel E and were analyzed 48 h after transfection. Data are averages and standard deviations based on results of triplicate experiments (*, P < 0.01 versus control [transfection reagent alone]). (G) Effect of Jak inhibitor on IFN-α-induced PrPres restoration in N167 cells. Cells were treated with 5 μg/ml Gly-9, 5 U/ml IFN-α, and 50 nM Jak inhibitor I (Jak inh) for 3 days. Each vehicle was used as a negative control. Graphic data are averages and standard deviations for triplicate immunoblot signals (**, P < 0.05; n.s., not significant). (H) Temporal profiles of mRNA levels of representative IFN-stimulated genes in Gly-9-treated N167 cells. The mRNA levels of Cxcl10 and Ifit1 were analyzed in N167 cells treated with 5 μg/ml Gly-9 or its vehicle for the indicated periods. Data are averages and standard deviations for triplicate experimental results (n.s., not significant; **, P < 0.05; *, P < 0.01).
FIG 6
FIG 6
Gene knockdown effects of upregulated genes on PrPres formation. (A) Immunoblotting of PrPres in N167 cells treated with siRNAs against four upregulated genes: Tmem179, Lrrc17, Mc1r, and Srd5a1. Cells in the presence of 5 μg/ml Gly-9 (Gly-9 +) or DMSO (Gly-9 −) were treated with a mixture of four siRNAs against the above-mentioned genes (si-RNA pool) at the indicated doses for 3 days after transfection. The amount of transfection reagent was equilibrated in all cell culture wells. (B) mRNA levels of Tmem179, Lrrc17, Mc1r, and Srd5a1 in N167 cells treated with specific siRNAs. Cells in the presence of 5 μg/ml Gly-9 were treated as described for panel A and were analyzed 24 h after transfection. Data are averages and standard deviations for triplicate experimental results (*, P < 0.01 versus control [transfection reagent alone]). (C) Pde4dip coding sequences and sites of siRNAs used in the study. (D) Immunoblotting of PrPres in N167 cells treated with siRNAs against Pde4dip. Cells in the presence of 5 μg/ml Gly-9 were treated with each siRNA (si-2, si-3, si-4, or si-5) at a dose of 10 nM for 3 days after transfection. The amount of transfection reagent was equilibrated in all cell culture wells. Graphic data are averages and standard deviations for triplicate immunoblot signals (*, P < 0.01 versus control [transfection reagent alone]). (E) Pde4dip mRNA levels in N167 cells treated with siRNAs against Pde4dip. Cells in the presence of vehicle (DMSO) or 5 μg/ml Gly-9 were treated as described for panel D and were analyzed at the indicated time points after transfection. Data are averages and standard deviations for triplicate experimental results (*, P < 0.01; **, P < 0.05 versus control [transfection reagent alone] at each time point). (F) PrP mRNA levels in N167 cells treated with siRNAs against Pde4dip. Cells were treated and analyzed as described for panel E. Data are averages and standard deviations for triplicate experimental results (*, P < 0.01; **, P < 0.05 versus control [transfection reagent alone] at each time point).
FIG 7
FIG 7
Pde4dip involvement in PrPc and PrPres. (A) Temporal profile of Pde4dip mRNA levels in Gly-9-treated N167 cells. Cells were treated with 5 μg/ml Gly-9 or its vehicle for the indicated periods. Data are averages and standard deviations for triplicate experimental results (n.s., not significant; **, P < 0.05). (B) Immunoblotting of PrPres in N167 cells and PrPc in N2a cells treated with Gly-9 and Pde4dip gene knockdown. Cells were treated with 5 μg/ml Gly-9 or its vehicle (DMSO) for three and a half days and, simultaneously, with the indicated doses of siRNA against Pde4dip (si-Pde4dip; called si-5 in Fig. 6C) for the last 3 days before harvest. Graphic data are averages and standard deviations for triplicate immunoblot signals (n.s., not significant; *, P < 0.01; **, P < 0.05). (C) mRNA levels of Pde4dip and PrP in N167 cells treated with Gly-9 and si-Pde4dip. Cells were treated as described for panel B, and si-Pde4dip was used at a dose of 10 nM. The vehicle for Gly-9 and the transfection reagent for si-Pde4dip were used as negative controls. Data are averages and standard deviations for triplicate experimental results (*, P < 0.01; n.s., not significant). (D) Immunofluorescence of abnormal PrP accumulation in N167 cells treated with Gly-9 and si-Pde4dip. Cells were treated as described for panel C. Nuclei were stained with Hoechst 33258 (H33258). (E) Flow cytometry of cell surface PrP and lipid rafts in N2a cells treated with Gly-9 and si-Pde4dip. Cells in the presence of 5 μg/ml Gly-9 or vehicle (DMSO) were treated with transfection reagent alone (cont) or 5 nM si-Pde4dip (siRNA) for 3 days as described for panel B. Cell surface PrP (anti-PrP) and lipid rafts (cholera-toxin B) were labeled as described earlier in this report. (F) Immunoblotting of autophagosome-related LC3-II in N167 cells treated with Gly-9 and si-Pde4dip. Cells were treated as described for panel C. Treatment with 100 mM trehalose is shown as a positive control. Graphic data are averages and standard deviations for triplicate immunoblot signals (n.s., not significant).
FIG 8
FIG 8
Relationship between IFN effects and Pde4dip effects. (A) Pde4dip mRNA levels in N167 cells treated with IFN-α. Cells were treated with 5 μg/ml Gly-9 (Gly-9 +) or vehicle (Gly-9 −) for 3 days and, simultaneously, with 5 U/ml IFN-α for the indicated periods before the harvest. Data are averages and standard deviations for triplicate experiment results (n.s., not significant; **, P < 0.05 versus vehicle control of IFN-α). (B) Temporal profiles of mRNA levels of representative IFN-stimulated genes in N167 cells treated with si-Pde4dip. The mRNA levels of Cxcl10 and Ifit1 were analyzed in cells treated with combinations of 5 μg/ml Gly-9 and 10 nM si-Pde4dip. Gly-9 treatment started half a day before transfection of si-Pde4dip. Cells were harvested at the indicated time points after transfection. The vehicle for Gly-9 and the transfection reagent for si-Pde4dip were used as negative controls. Data are averages and standard deviations for triplicate experimental results (n.s., not significant; *, P < 0.01; **, P < 0.05). (C) Immunoblotting of PrPres in N167 cells treated with combinations of si-Pde4dip and IFN-α. Cells in the presence or absence of 5 μg/ml Gly-9 were treated with 5 U/ml IFN-α for three and a half days and, simultaneously, with 10 nM si-Pde4dip for the last 3 days before harvesting. The vehicles for Gly-9 and IFN-α and the transfection reagent for si-Pde4dip were used as negative controls. Graphic data are averages and standard deviations for triplicate immunoblot signals (n.s., not significant; *, P < 0.01; **, P < 0.05).
FIG 9
FIG 9
Gly-9 effects on prion-infected animals. (A) Kaplan-Meier graph for animals treated with Gly-9. Tg7 mice infected intracerebrally with 263K prion were given intracerebroventricular injections of Gly-9 or Gly-14 at a dose of 300 μg/day or of vehicle continually from 6 weeks postinfection. The survival time in this study indicates the length of time from the start of injections to the onset of terminal disease. (B) Neuropathology of Gly-9-treated, terminally ill animals. Representative images stained with hematoxylin and eosin (HE) or immunolabeled for abnormal PrP deposition (PrP) or glial fibrillary acidic protein (GFAP) are shown for the brain sections of animals treated as described for panel A. The images include the deep cerebral cortex, white matter, and hippocampus pyramidal cell layer (cerebrum) or the pontine laterodorsal tegmental area (Pons). Bars, 50 μm. It is noteworthy that the cerebral sections show coarse plaque-like PrP deposition and mild glial reactions in the white matter, whereas the pontine sections show moderate spongiosis, remarkable fine granular PrP deposition, and marked glial reactions. It is also noteworthy that no apparent difference in these neuropathological features exists among the three groups.

Similar articles

Cited by

References

    1. Prusiner SB. 1998. Prions. Proc. Natl. Acad. Sci. U. S. A. 95:13363–13383. 10.1073/pnas.95.23.13363 - DOI - PMC - PubMed
    1. Caughey B. 1991. In vitro expression and biosynthesis of prion protein. Curr. Top. Microbiol. Immunol. 172:93–107 - PubMed
    1. Sim VL, Caughey B. 2009. Recent advances in prion chemotherapeutics. Infect. Disord. Drug Targets 9:81–91. 10.2174/1871526510909010081 - DOI - PMC - PubMed
    1. Teruya K, Kawagoe K, Kimura T, Chen CJ, Sakasegawa Y, Doh-ura K. 2009. Amyloidophilic compounds for prion diseases. Infect. Disord. Drug Targets 9:15–22. 10.2174/1871526510909010015 - DOI - PubMed
    1. Trevitt CR, Collinge J. 2006. A systematic review of prion therapeutics in experimental models. Brain 129:2241–2265. 10.1093/brain/awl150 - DOI - PubMed

Publication types