. 2008;103(481):259-270.
doi: 10.1198/016214507000000356.

Modeling Disease Progression with Longitudinal Markers

Affiliations

Modeling Disease Progression with Longitudinal Markers

Lurdes Y T Inoue et al. J Am Stat Assoc. 2008.

Abstract

In this paper we propose a Bayesian natural history model for disease progression based on the joint modeling of longitudinal biomarker levels, age at clinical detection of disease and disease status at diagnosis. We establish a link between the longitudinal responses and the natural history of the disease by using an underlying latent disease process which describes the onset of the disease and models the transition to an advanced stage of the disease as dependent on the biomarker levels. We apply our model to the data from the Baltimore Longitudinal Study of Aging on prostate specific antigen (PSA) to investigate the natural history of prostate cancer.

Keywords: Markov Chain Monte Carlo methods; Natural history model; disease progression; latent variables; longitudinal response; prostate specific antigen.


Figures

Figure 1
Figure 1
PSA trajectories. The panel shows the log–transformed PSA levels by age at follow–up. In the group with normal patients we show the trajectories for a randomly selected subset of men.
Figure 2
Figure 2
Log–transformed conditional predictive ordinate (CPO) for prostate–cancer patients calculated under models M0, M4,1, and M7,1 (denoted in the Figure by labels 0, 4, and 7 respectively).
Figure 3
Figure 3
Marginal posterior distributions for the population level parameters. In each panel we represent the posterior density (in full line) superimposed with the prior density (in dotted line and shown within the range of the estimated marginal posterior distribution).
Figure 4
Figure 4
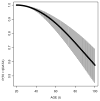
Posterior survival probability of disease onset. Circles represent the median posterior probability while the vertical lines denote the limits of the 95% posterior credible intervals. The posterior probability that the onset occurs after age 70 is approximately 81% with the 95% credible interval ranging from 73% to 87%.
Figure 5
Figure 5
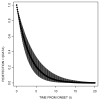
Posterior survival probability of clinical detection from disease onset time. Circles represent the median posterior probability while the vertical lines denote the limits of the 95% posterior credible intervals. The posterior probability that clinical detection occurs after one year post–disease onset is 71% (95% CI=[65%, 81%]). The probability of detection after two years from disease onset decreases to 54% (95% CI= [42%, 66%]).
Figure 6
Figure 6
Posterior survival probability of metastatic transition and posterior predictive level of PSA by age (t). The figure shows, for example, that in a case with the median PSA growth with disease onset at age 70, there is approximately a 83% chance of metastatic spread after age 75, with a predictive PSA level of 4.44 ng/ml. The probability drops to 47% at age 80 with PSA level of 13.07 ng/ml.
Figure 7
Figure 7
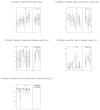
95% Posterior credible intervals for subject–specific parameters by stage of the disease at detection. Circles denote posterior medians. For panels (d) and (e) time is denoted from years prior to disease diagnosis.
Figure 8
Figure 8
Fit of the longitudinal PSA trajectory for randomly selected patients in the data set. Data for each patient are represented by circles. The fitted response in heavy full line is the median. Light full lines represent the boundaries of the 95% posterior credible intervals. The predictive density of time to disease onset is in dashed line and time to metastatic transition in dotted line. Posterior medians of disease onset and metastatic transition are represented by circles in the x-axis.

Similar articles

Cited by

References

    1. Bartoszynski R, Edler L, Hanin L, Kopp-Schneider A, Pavlova L, Tsodikov A, Zorin A, Yakovlev AY. Modeling cancer detection: tumor size as a source of information on unobservable stages of carcinogenesis. Math Biosci. 2001;171(2):113–42. - PubMed
    1. Brookmeyer R. Reconstruction and future trends of the AIDS epidemic in the United States. Science. 1991;253:37–42. - PubMed
    1. Brookmeyer R, Goedert JJ. Censoring in an epidemic with an application to hemophilia-associated AIDS. Biometrics. 1989;45:325–335. - PubMed
    1. Carter HB, Epstein JI, Chan DW, Fozard JL, Pearson JD. Recommended Prostate-Specific Antigen Testing Intervals for the Detection of Curable Prostate Cancer. Journal of the American Medical Association. 1997;277(18):1456–1460. - PubMed
    1. Craig BA, Fryback DG, Klein R, Klein BEK. A Bayesian approach to modelling the natural history of a chronic condition from observations with intervention. Statistics in Medicine. 1999;18:1355–1371. - PubMed

Publication types

LinkOut - more resources