

Estimation of utility values from visual analog scale measures of health in patients undergoing cardiac surgery
- PMID: 24453497
- PMCID: PMC3894102
- DOI: 10.2147/CEOR.S55899
Estimation of utility values from visual analog scale measures of health in patients undergoing cardiac surgery
Abstract
Introduction: In health economic evaluations, mapping can be used to estimate utility values from other health outcomes in order to calculate quality adjusted life-years. Currently, no methods exist to map visual analog scale (VAS) scores to utility values. This study aimed to develop and propose a statistical algorithm for mapping five dimensions of health, measured on VASs, to utility scores in patients suffering from cardiovascular disease.
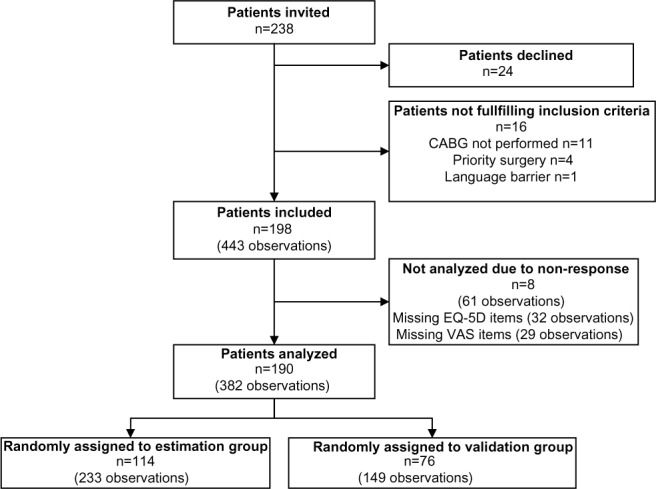
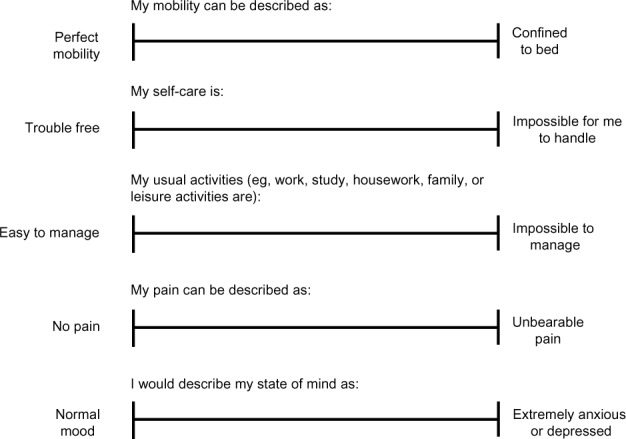
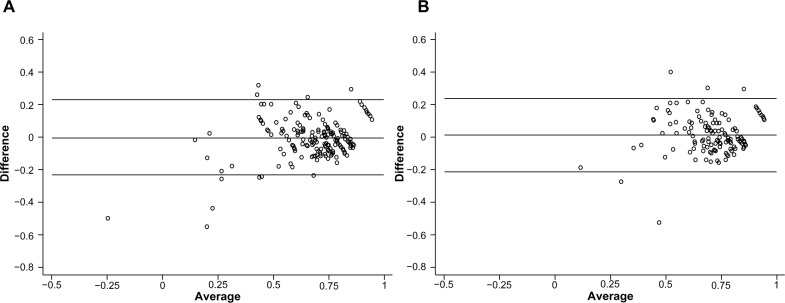
Methods: Patients undergoing coronary artery bypass grafting at Aalborg University Hospital in Denmark were asked to score their health using the five VAS items (mobility, self-care, ability to perform usual activities, pain, and presence of anxiety or depression) and the EuroQol 5 Dimensions questionnaire. Regression analysis was used to estimate four mapping models from patients' age, sex, and the self-reported VAS scores. Prediction errors were compared between mapping models and on subsets of the observed utility scores. Agreement between predicted and observed values was assessed using Bland-Altman plots.
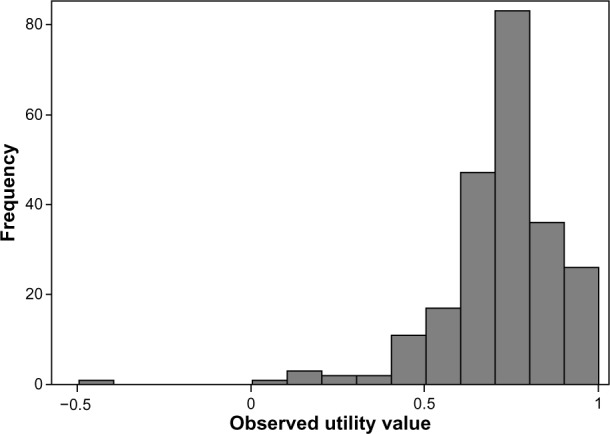
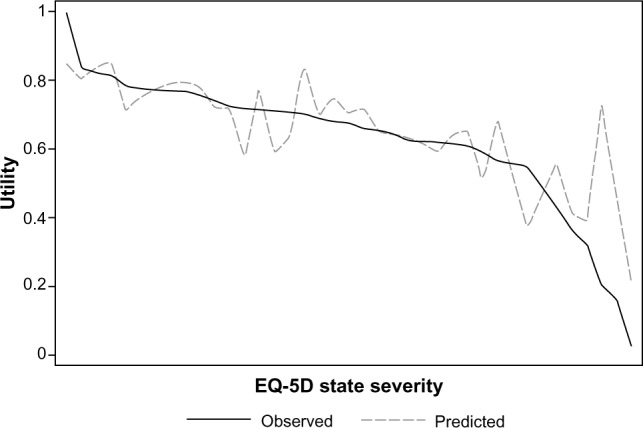
Results: Random effects generalized least squares (GLS) regression yielded the best results when quadratic terms of VAS scores were included. Mapping models fitted using the Tobit model and censored least absolute deviation regression did not appear superior to GLS regression. The mapping models were able to explain approximately 63%-65% of the variation in the observed utility scores. The mean absolute error of predictions increased as the observed utility values decreased.
Conclusion: We concluded that it was possible to predict utility scores from VAS scores of the five dimensions of health used in the EuroQol questionnaires. However, the use of the mapping model may be inappropriate in more severe conditions.
Keywords: coronary artery bypass grafts; cross-walk; mapping; outcomes research; quality of life.
Figures
References
-
- National Institute for Health and Care Excellence (NICE) Guide to the Methods of Technology Appraisal 2013. London, UK: NICE; 2013. [Accessed October 12, 2013]. Available from: http://www.nice.org.uk/media/D45/1E/GuideToMethodsTechnologyAppraisal201.... - PubMed
-
- Drummond MF, Sculpher MJ, Torrance GW, O’Brien BJ, Stoddart GL, editors. Methods for the Economic Evaluation of Health Care Programmes. 3rd ed. New York, NY: Oxford University Press; 2005.
-
- Brazier JE, Yang Y, Tsuchiya A, Rowen DL. A review of studies mapping (or cross walking) non-preference based measures of health to generic preference-based measures. Eur J Health Econ. 2010;11(2):215–225. - PubMed
-
- Tosh JC, Longworth LJ, George E. Utility values in National Institute for Health and Clinical Excellence (NICE) Technology Appraisals. Value Health. 2011;14(1):102–109. - PubMed
-
- Hjermstad MJ, Fayers PM, Haugen DF, et al. European Palliative Care Research Collaborative (EPCRC) Studies comparing Numerical Rating Scales, Verbal Rating Scales, and Visual Analogue Scales for assessment of pain intensity in adults: a systematic literature review. J Pain Symptom Manage. 2011;41(6):1073–1093. - PubMed
LinkOut - more resources
Full Text Sources
Other Literature Sources
Miscellaneous
