

The correlation structure of local neuronal networks intrinsically results from recurrent dynamics
- PMID: 24453955
- PMCID: PMC3894226
- DOI: 10.1371/journal.pcbi.1003428
The correlation structure of local neuronal networks intrinsically results from recurrent dynamics
Abstract
Correlated neuronal activity is a natural consequence of network connectivity and shared inputs to pairs of neurons, but the task-dependent modulation of correlations in relation to behavior also hints at a functional role. Correlations influence the gain of postsynaptic neurons, the amount of information encoded in the population activity and decoded by readout neurons, and synaptic plasticity. Further, it affects the power and spatial reach of extracellular signals like the local-field potential. A theory of correlated neuronal activity accounting for recurrent connectivity as well as fluctuating external sources is currently lacking. In particular, it is unclear how the recently found mechanism of active decorrelation by negative feedback on the population level affects the network response to externally applied correlated stimuli. Here, we present such an extension of the theory of correlations in stochastic binary networks. We show that (1) for homogeneous external input, the structure of correlations is mainly determined by the local recurrent connectivity, (2) homogeneous external inputs provide an additive, unspecific contribution to the correlations, (3) inhibitory feedback effectively decorrelates neuronal activity, even if neurons receive identical external inputs, and (4) identical synaptic input statistics to excitatory and to inhibitory cells increases intrinsically generated fluctuations and pairwise correlations. We further demonstrate how the accuracy of mean-field predictions can be improved by self-consistently including correlations. As a byproduct, we show that the cancellation of correlations between the summed inputs to pairs of neurons does not originate from the fast tracking of external input, but from the suppression of fluctuations on the population level by the local network. This suppression is a necessary constraint, but not sufficient to determine the structure of correlations; specifically, the structure observed at finite network size differs from the prediction based on perfect tracking, even though perfect tracking implies suppression of population fluctuations.
Conflict of interest statement
The authors have declared that no competing interests exist.
Figures
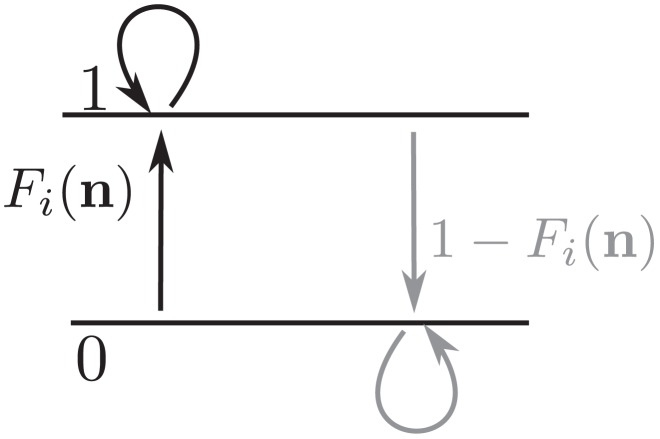
 , so the rate of updates per neuron
  is
is  . The probability of neuron
  to end in the up-state (
 ) is determined by the gain function
  which potentially depends on the states
  of all neurons in the network. The up-transitions are indicated by black arrows. The probability for the down state (
 ) is given by the complementary probability
  , indicated by gray arrows.
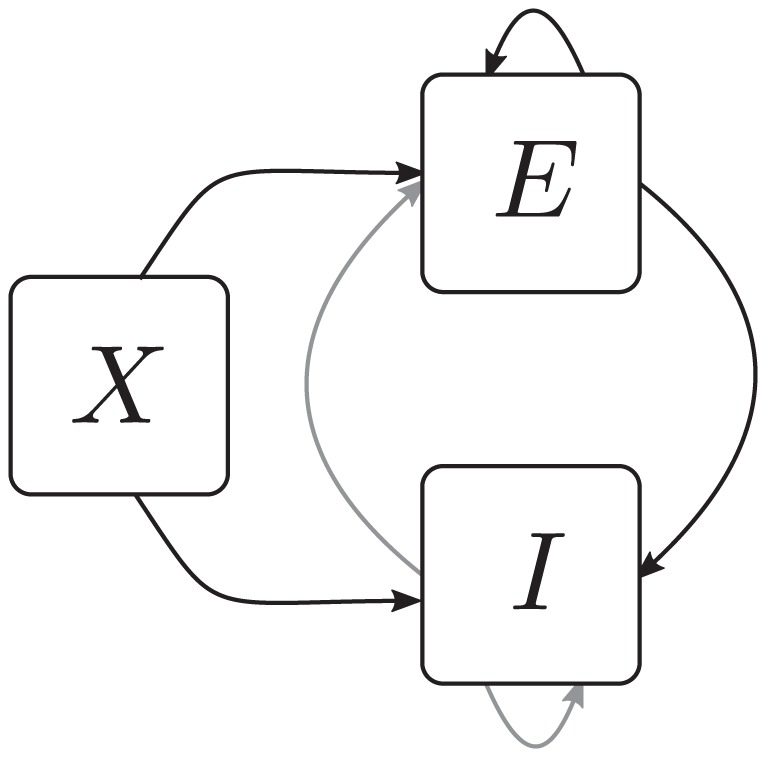
 delivers stochastic activity to the local network. The local network is a recurrent Erdös-Rényi random network with homogeneous synaptic weights
  coupling neurons in population
  to neurons in population
  , for
, for  and same parameters for all neurons. There are
  neurons in both the excitatory and the inhibitory population. The connection probability is
  , and each neuron in population
  receives the same number
  of excitatory and inhibitory synapses. The size
  of the external population determines the amount of shared input received by each pair of cells in the local network. The neurons are modeled as binary units with a hard threshold
  .
.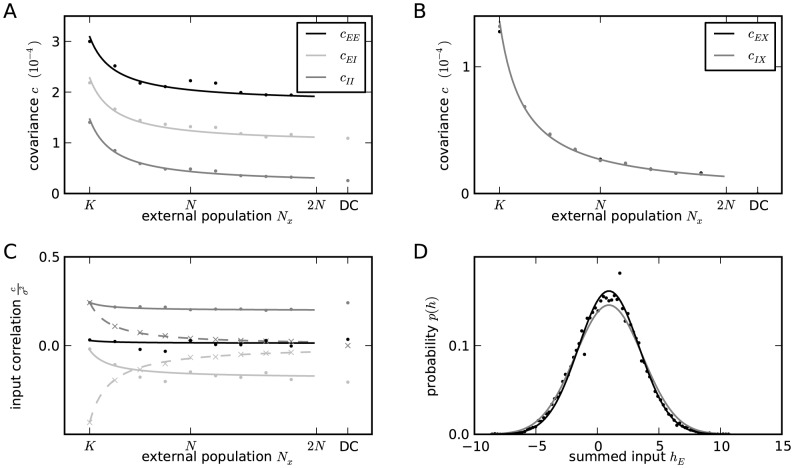
 receives
  randomly drawn excitatory inputs with weight
  ,
,  randomly drawn inhibitory inputs of weight
  and
and  external inputs of weight
  (homogeneous random network with fixed in-degree, connection probability
  ). A Correlations averaged over pairs of neurons within the local network (22). Dots indicate results of direct simulation over
  averaged over
  pairs of neurons. Curves show the analytical result (24). The point “DC” shows the correlation structure emerging if the drive from the external population is replaced by a constant value
  , which provides the same mean input as the original external drive. B Correlations between neurons within the local network and the external population averaged over pairs of neurons (same labeling as in A). C Correlation between the inputs to a pair of cells in the network decomposed into the contributions due to shared inputs
  (gray, eq. 25) and due to correlations
  in the presynaptic activity (light gray, eq. 26). Dashed curves and St. Andrew's Crosses show the contribution due to external inputs, solid curves and dots show the contribution from local inputs. The sum of all components is shown by black dots and curve. Curves are theoretical results based on (24), (25), and (26), symbols are obtained from simulation. D Probability distribution of the fluctuating input
  to a single neuron in the excitatory population. Dots show the histogram obtained from simulation binned over the interval
  with a bin size of
  . The gray curve is the prediction of a Gaussian distribution obtained from mean-field theory neglecting correlations, with mean and variance given by (4) and (6), respectively. The black curve takes correlations in the afferent signals into account and has a variance given by (13). Other parameters: simulation resolution
  , synaptic delay
  , activity measurement in intervals of
  . Threshold of the neurons
  , time constant of inter-update intervals
  . The average activity in the network is
  .
.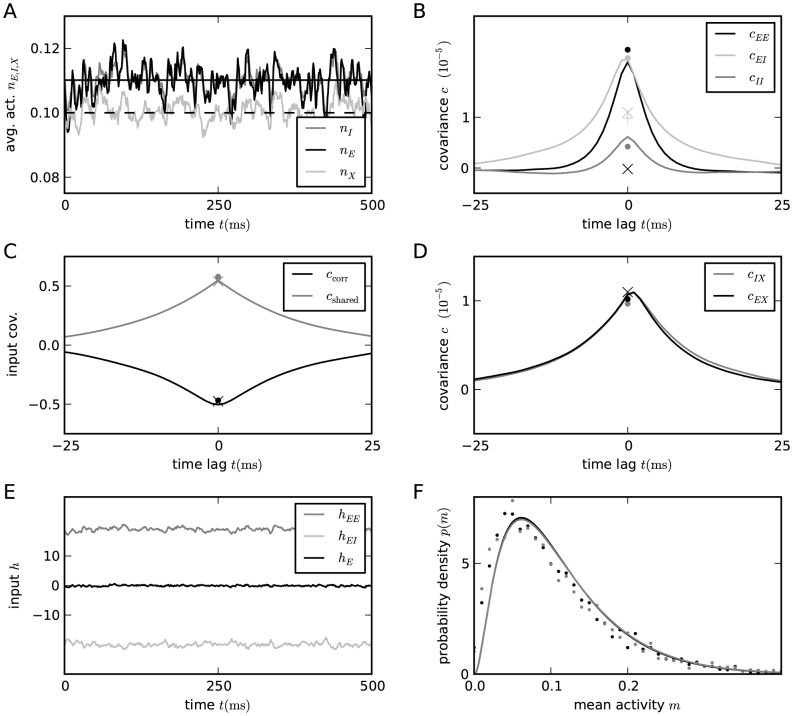
 of synaptic inputs binomially distributed as
  , with connection probability
  . A Population averaged activity (black
  , gray
  , light gray
  ). Analytical prediction (5) for the mean activities
  (dashed horizontal line) and numerical solution of mean field equation (7) (solid horizontal line). B Cross correlation between excitatory neurons (black curve), between inhibitory neurons (gray curve), and between excitatory and inhibitory neurons (light gray curve) obtained from simulation. St. Andrew's Crosses show the theoretical prediction from [24, supplement, eqs. 38,39] (prediction yields
  , so only one cross is visible). Dots show the theoretical prediction (24). The plus symbol shows the prediction for the correlation
  when terms proportional to
  and
and  are set to zero. C Correlation between the input currents to a pair of excitatory neurons. Contribution due to pairwise correlations
  (black curve) and due to shared input
  (gray curve). Symbols show the theoretical predictions based on (crosses) and based on (24) (dots). D Similar to B, but showing the correlations between external neurons and neurons in the excitatory and inhibitory population. E Fluctuating input
  averaged over the excitatory population (black), separated into contributions from excitatory synapses
  (gray) and from inhibitory synapses
  (light gray). F Distribution of time averaged activity obtained by direct simulation (symbols) and analytical prediction (17) using the numerically evaluated self-consistent solution for the first
  and second moments
  ,
,  (19). Duration of simulation
  , mean activity
  , other parameters as in Figure 3.
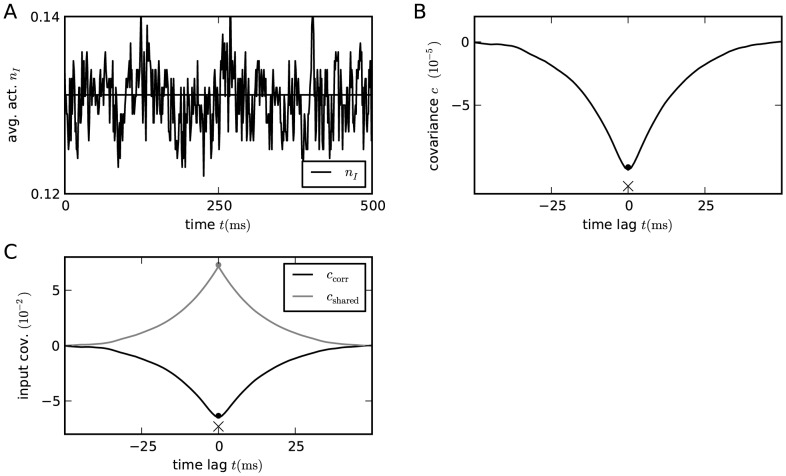
 binary inhibitory neurons with synaptic amplitudes
  . Each neuron receives
  randomly drawn inputs (fixed in-degree) with
  . A Population averaged activity. Numerical solution of mean field equation (7) (solid horizontal line). B Cross covariance between inhibitory neurons. Theoretical result (32) shown as dot. St. Andrew's Cross indicates the leading order term
  . C Correlation between the input currents to a pair of excitatory neurons. The black curve is the contribution due to pairwise correlations
  , the gray curve is the contribution of shared input
  . The dot symbols show the theoretical expectations (33) based on the leading order (crosses) and based on the full solution (32) (dot). Threshold of neurons
  .
.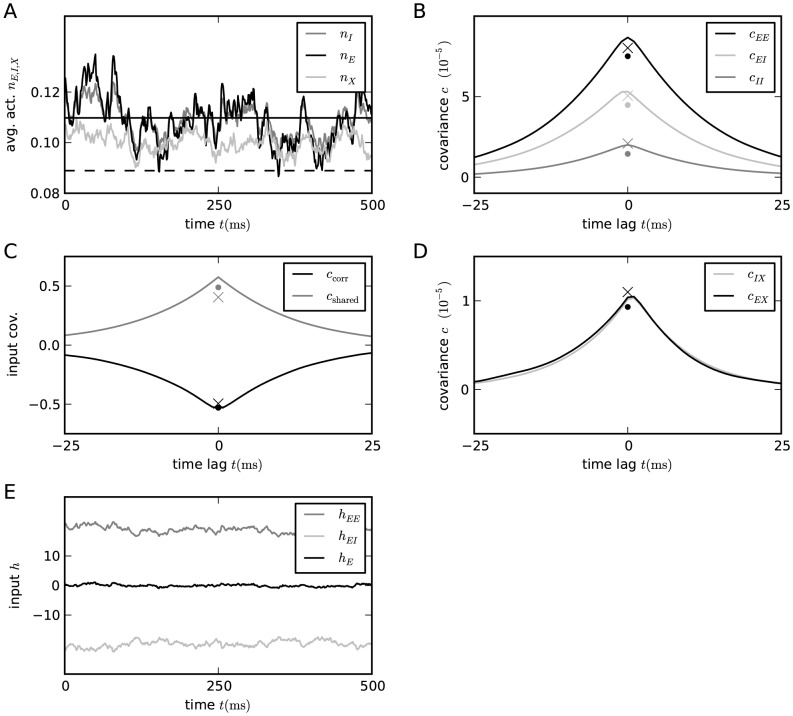
 randomly drawn inputs (fixed in-degree,
  ). A Population averaged activity (black
  , gray
  , light gray
  ). Analytical prediction (5) for the mean activities
  (dashed horizontal line) and numerical solution of mean field equation (7) (solid horizontal line). B Cross covariance between excitatory neurons (black), between inhibitory neurons (gray), and between excitatory and inhibitory neurons (light gray). Theoretical results (24) shown as dots. St. Andrew's Crosses indicate the theoretical prediction of leading order in
  (43). C Correlation between the input currents to a pair of excitatory neurons. The black curve is the contribution due to pairwise correlations
  , the gray curve is the contribution of shared input
  . The symbols show the theoretical expectation (25) and (26) based on (43) (crosses) and based on (24) (dots). D Similar to B, but showing the correlations between external neurons and neurons in the excitatory and inhibitory population. Note that both theories yield
  , so for each theory ((43) crosses, (24) dots) only the symbol for
  is visible. E Contributions
  (gray) due to excitatory synapses and
  (light gray) due to inhibitory synapses to the input
  averaged over all excitatory neurons. Duration of simulation
  , mean activity
  ,
,  , other parameters as in Figure 3.
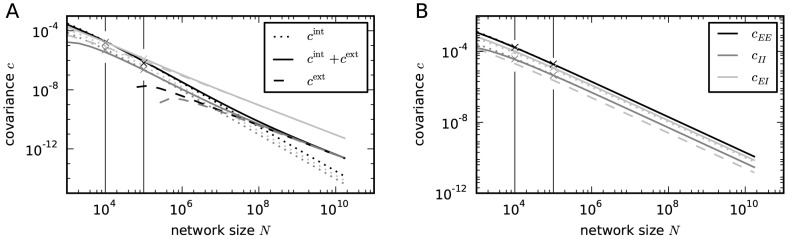
 (dashed). Gray coded are the different pairs of covariances, black (
 ), mid gray (
 ), light gray (
 ). A Network as in with non-homogeneous synaptic coupling as in Figure 4. The dashed curve is given by the leading order term
  (38) and [24, eqs. (38)–(39)] driven by external fluctuations, the dotted curve is the next order term
  (37), driven by intrinsic fluctuations generated by the excitatory and inhibitory population. The dashed curve is not shown for networks smaller than
  neurons as it assumes negative values. Relative error of the theory with respect to simulation at
  neurons is
  percent. The solid curve is the full solution of (24)
  . The relative error at
  neurons is
  percent. Symbols show direct simulations. B Network with homogeneous connectivity, as in Figure 6. Same symbol code as in A. Both contributions
  (36) and
  (37) show the same scaling (44). Note that for the parameters here
  , so the only dashed curve shown is
  . Symbols indicate the results of direct simulations; vertical lines are included to guide the eye.
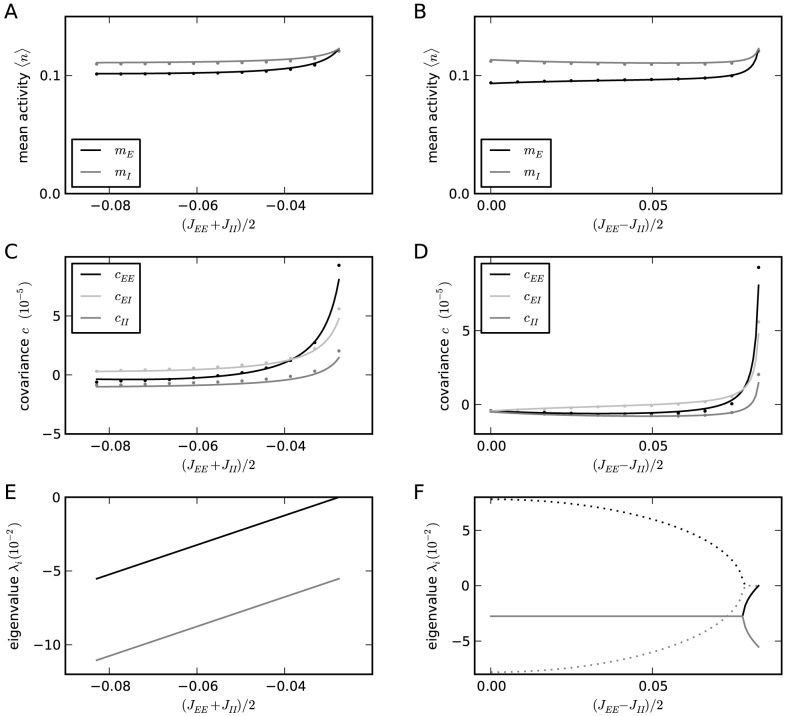
 is the independent variable, in the right column (B,D,F)
  . A,B Mean activity in the network as a function of the structural parameters
  and
and  , respectively. C,D Correlations averaged over pairs of neurons. Dots obtained from direct simulation, solid curves given by theory (24) E,F Eigenvalues (30) of the population-averaged connectivity matrix; solid curves show the real part, dashed curves the imaginary part.
Similar articles
-
Decorrelation of neural-network activity by inhibitory feedback.PLoS Comput Biol. 2012 Aug;8(8):e1002596. doi: 10.1371/journal.pcbi.1002596. Epub 2012 Aug 2. PLoS Comput Biol. 2012. PMID: 23133368 Free PMC article.
-
Emergence of network structure due to spike-timing-dependent plasticity in recurrent neuronal networks. II. Input selectivity--symmetry breaking.Biol Cybern. 2009 Aug;101(2):103-14. doi: 10.1007/s00422-009-0320-y. Epub 2009 Jun 18. Biol Cybern. 2009. PMID: 19536559
-
How plasticity shapes the formation of neuronal assemblies driven by oscillatory and stochastic inputs.J Comput Neurosci. 2025 Mar;53(1):9-23. doi: 10.1007/s10827-024-00885-z. Epub 2024 Dec 11. J Comput Neurosci. 2025. PMID: 39661297
-
Neuronal computations with stochastic network states.Science. 2006 Oct 6;314(5796):85-90. doi: 10.1126/science.1127241. Science. 2006. PMID: 17023650 Review.
-
Propagation delays determine neuronal activity and synaptic connectivity patterns emerging in plastic neuronal networks.Chaos. 2018 Oct;28(10):106308. doi: 10.1063/1.5037309. Chaos. 2018. PMID: 30384625 Review.
Cited by
-
MR. Estimator, a toolbox to determine intrinsic timescales from subsampled spiking activity.PLoS One. 2021 Apr 29;16(4):e0249447. doi: 10.1371/journal.pone.0249447. eCollection 2021. PLoS One. 2021. PMID: 33914774 Free PMC article.
-
Nonlinear stimulus representations in neural circuits with approximate excitatory-inhibitory balance.PLoS Comput Biol. 2020 Sep 18;16(9):e1008192. doi: 10.1371/journal.pcbi.1008192. eCollection 2020 Sep. PLoS Comput Biol. 2020. PMID: 32946433 Free PMC article.
-
On the Complexity of Resting State Spiking Activity in Monkey Motor Cortex.Cereb Cortex Commun. 2021 May 18;2(3):tgab033. doi: 10.1093/texcom/tgab033. eCollection 2021. Cereb Cortex Commun. 2021. PMID: 34296183 Free PMC article.
-
Attentional modulation of neuronal variability in circuit models of cortex.Elife. 2017 Jun 7;6:e23978. doi: 10.7554/eLife.23978. Elife. 2017. PMID: 28590902 Free PMC article.
-
Topographic Organization of Correlation Along the Longitudinal and Transverse Axes in Rat Hippocampal CA3 Due to Excitatory Afferents.Front Comput Neurosci. 2020 Nov 20;14:588881. doi: 10.3389/fncom.2020.588881. eCollection 2020. Front Comput Neurosci. 2020. PMID: 33328947 Free PMC article.
References
-
- Maldonado P, Babul C, Singer W, Rodriguez E, Berger D, et al. (2008) Synchronization of neuronal responses in primary visual cortex of monkeys viewing natural images. J Neurophysiol 100: 1523–1532 - PubMed
-
- Crochet S, Poulet JF, Kremer Y, Petersen CC (2011) Synaptic mechanisms underlying sparse coding of active touch. Neuron 69: 1160–1175 - PubMed
-
- Poulet J, Petersen C (2008) Internal brain state regulates membrane potential synchrony in barrel cortex of behaving mice. Nature 454: 881–885 - PubMed
Publication types
MeSH terms
LinkOut - more resources
Full Text Sources
Other Literature Sources
Research Materials
