

Nutrient limitation governs Staphylococcus aureus metabolism and niche adaptation in the human nose
- PMID: 24453967
- PMCID: PMC3894218
- DOI: 10.1371/journal.ppat.1003862
Nutrient limitation governs Staphylococcus aureus metabolism and niche adaptation in the human nose
Abstract
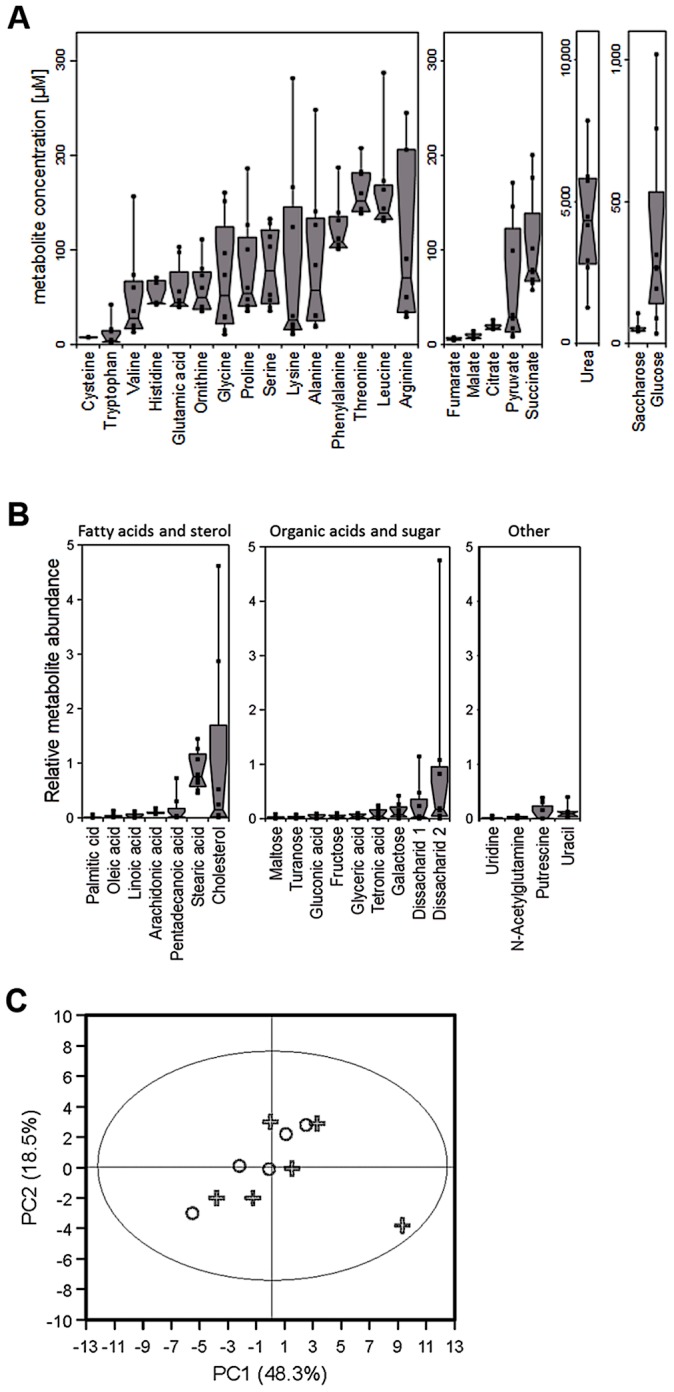
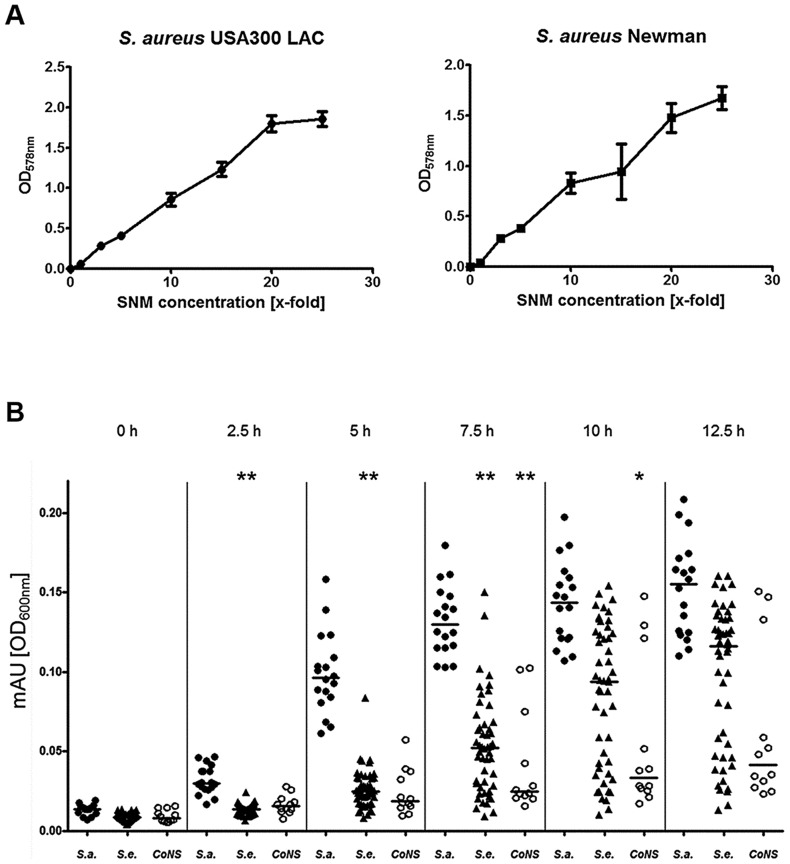
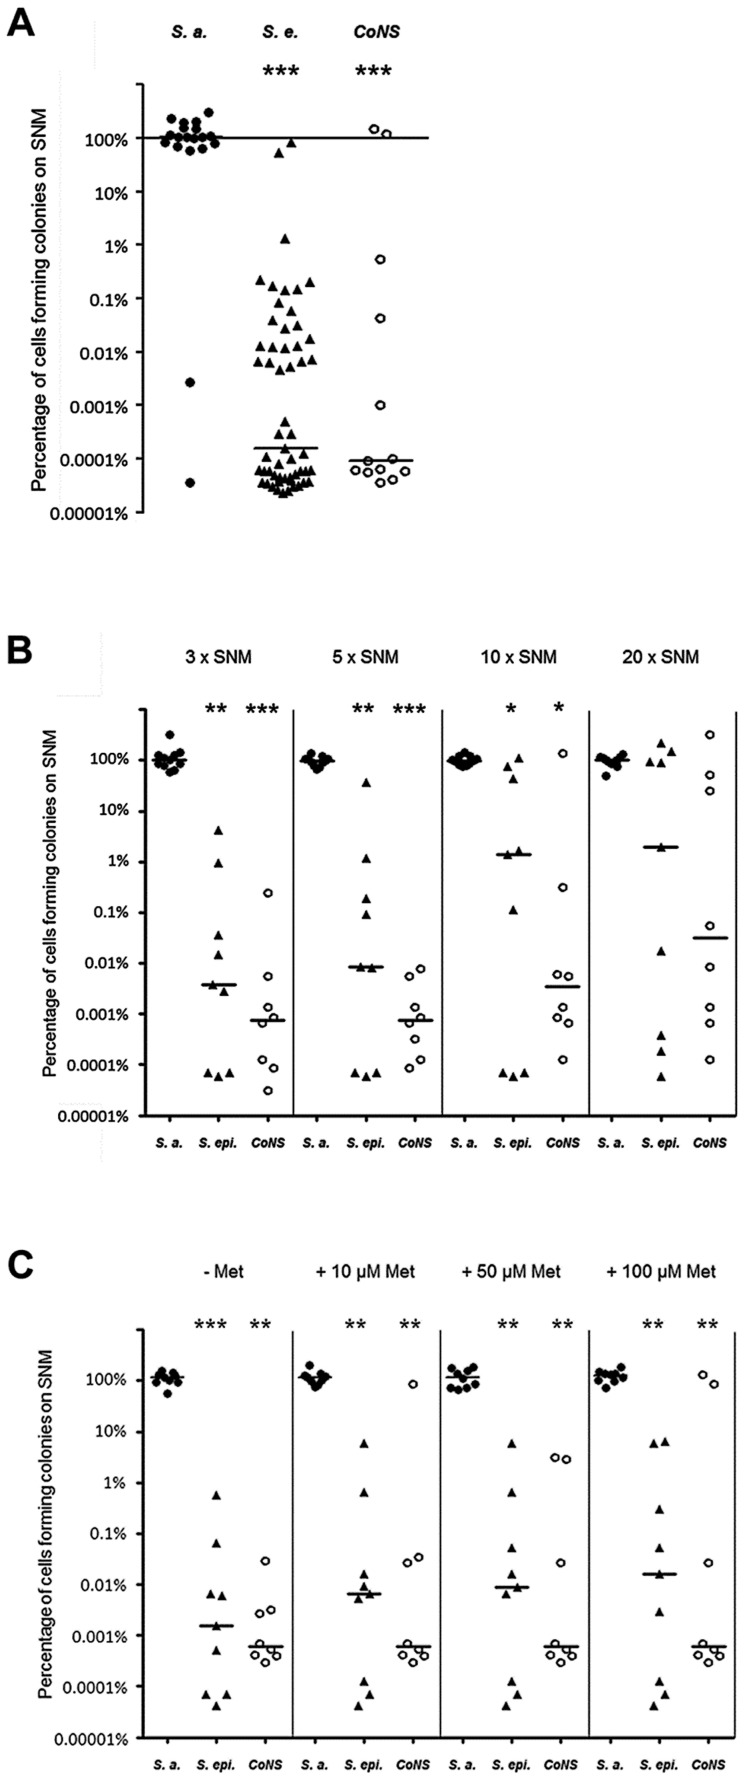
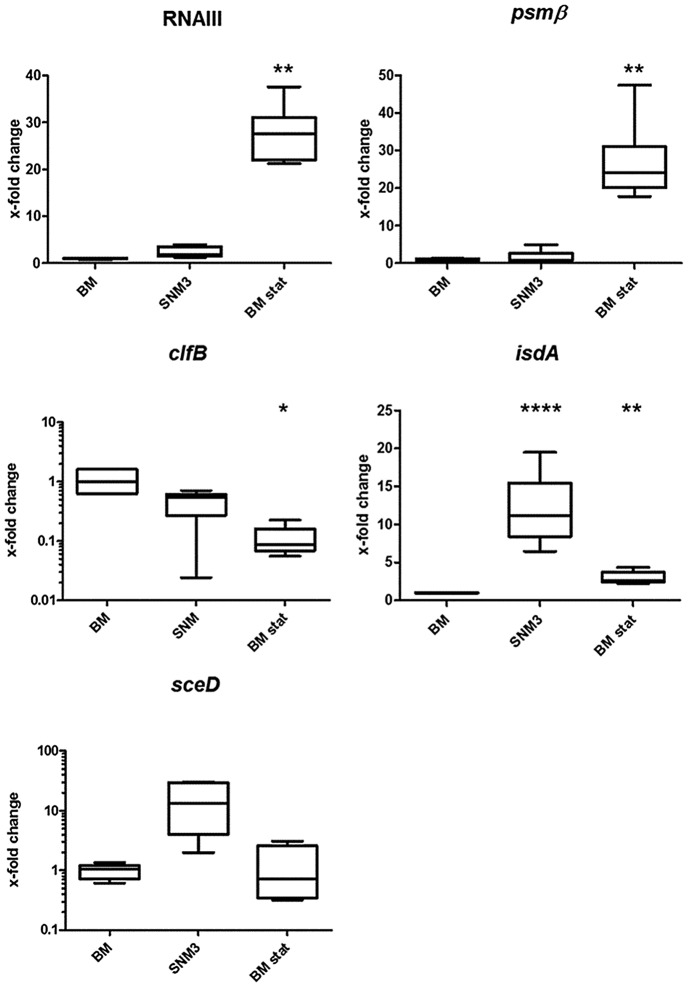
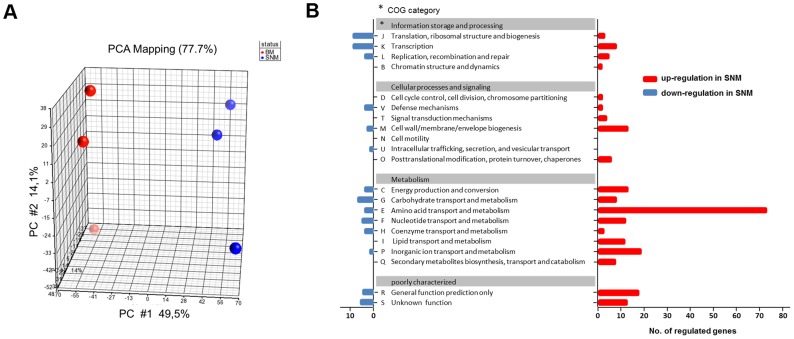
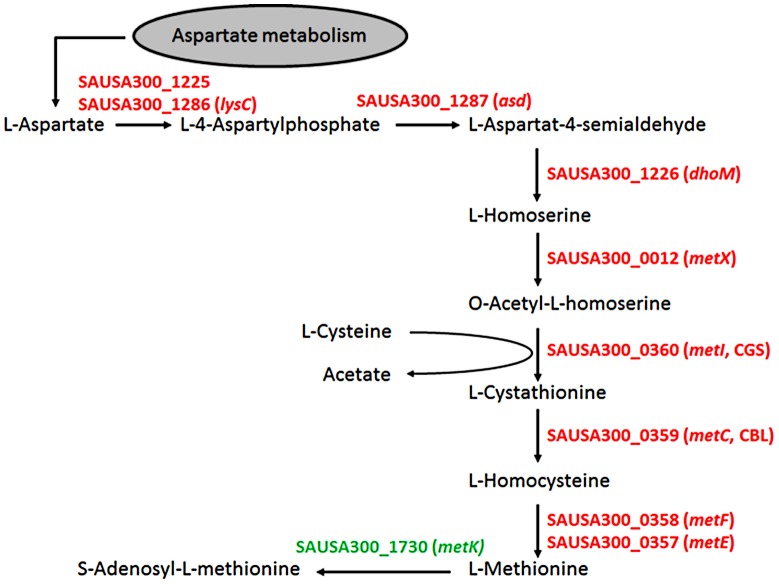
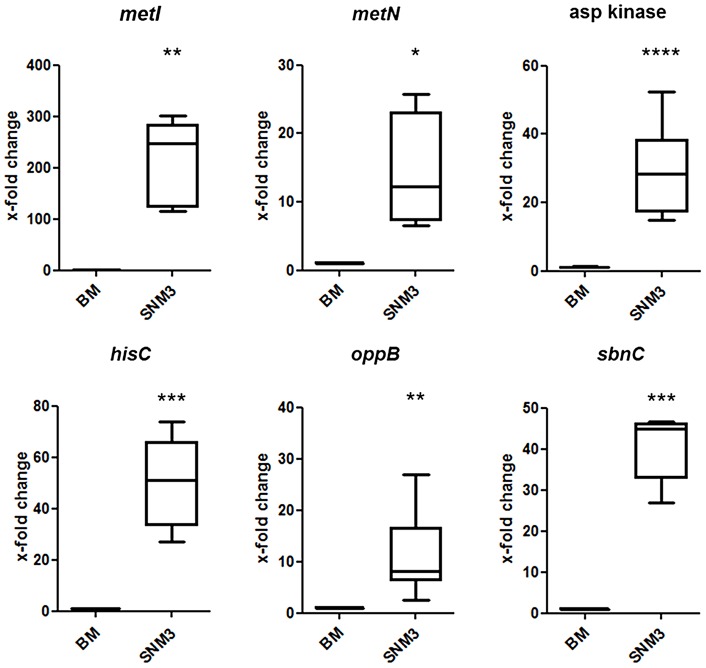
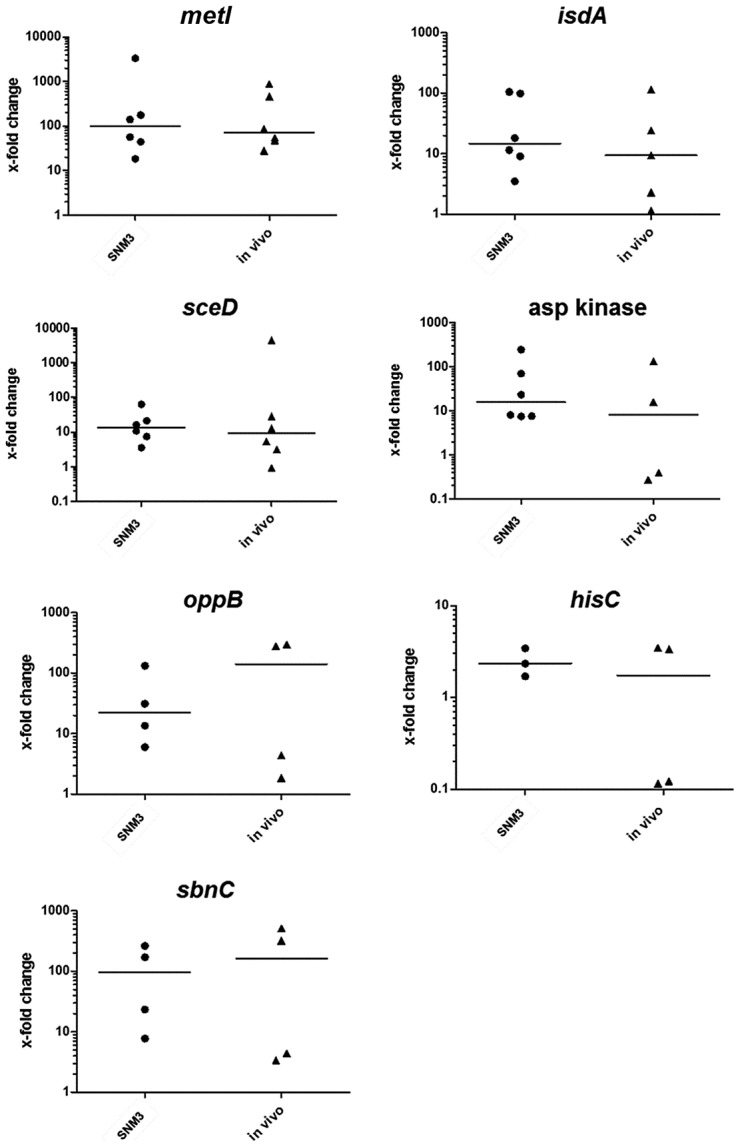
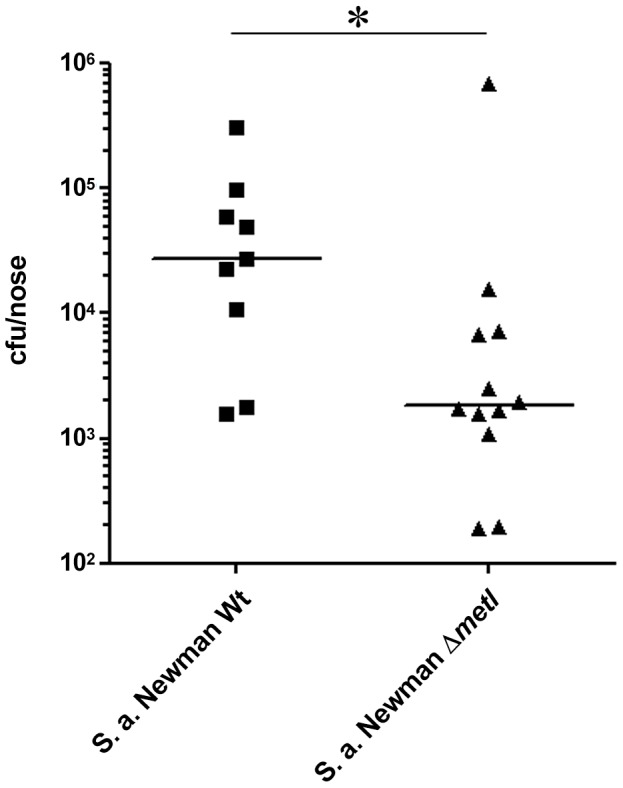
Colonization of the human nose by Staphylococcus aureus in one-third of the population represents a major risk factor for invasive infections. The basis for adaptation of S. aureus to this specific habitat and reasons for the human predisposition to become colonized have remained largely unknown. Human nasal secretions were analyzed by metabolomics and found to contain potential nutrients in rather low amounts. No significant differences were found between S. aureus carriers and non-carriers, indicating that carriage is not associated with individual differences in nutrient supply. A synthetic nasal medium (SNM3) was composed based on the metabolomics data that permits consistent growth of S. aureus isolates. Key genes were expressed in SNM3 in a similar way as in the human nose, indicating that SNM3 represents a suitable surrogate environment for in vitro simulation studies. While the majority of S. aureus strains grew well in SNM3, most of the tested coagulase-negative staphylococci (CoNS) had major problems to multiply in SNM3 supporting the notion that CoNS are less well adapted to the nose and colonize preferentially the human skin. Global gene expression analysis revealed that, during growth in SNM3, S. aureus depends heavily on de novo synthesis of methionine. Accordingly, the methionine-biosynthesis enzyme cysteine-γ-synthase (MetI) was indispensable for growth in SNM3, and the MetI inhibitor DL-propargylglycine inhibited S. aureus growth in SNM3 but not in the presence of methionine. Of note, metI was strongly up-regulated by S. aureus in human noses, and metI mutants were strongly abrogated in their capacity to colonize the noses of cotton rats. These findings indicate that the methionine biosynthetic pathway may include promising antimicrobial targets that have previously remained unrecognized. Hence, exploring the environmental conditions facultative pathogens are exposed to during colonization can be useful for understanding niche adaptation and identifying targets for new antimicrobial strategies.
Conflict of interest statement
The authors have declared that no competing interests exist.
Figures
Similar articles
-
Temporal expression of adhesion factors and activity of global regulators during establishment of Staphylococcus aureus nasal colonization.J Infect Dis. 2010 May 1;201(9):1414-21. doi: 10.1086/651619. J Infect Dis. 2010. PMID: 20307206
-
Exploring the transcriptome of Staphylococcus aureus in its natural niche.Sci Rep. 2016 Sep 19;6:33174. doi: 10.1038/srep33174. Sci Rep. 2016. PMID: 27641137 Free PMC article.
-
Adhesion of Staphylococcus aureus to epithelial cells: an in vitro approach to study interactions within the nasal microbiota.J Med Microbiol. 2020 Oct;69(10):1253-1261. doi: 10.1099/jmm.0.001248. Epub 2020 Sep 10. J Med Microbiol. 2020. PMID: 32909934
-
The commensal lifestyle of Staphylococcus aureus and its interactions with the nasal microbiota.Nat Rev Microbiol. 2017 Oct 12;15(11):675-687. doi: 10.1038/nrmicro.2017.104. Nat Rev Microbiol. 2017. PMID: 29021598 Review.
-
Intestinal carriage of Staphylococcus aureus: how does its frequency compare with that of nasal carriage and what is its clinical impact?Eur J Clin Microbiol Infect Dis. 2009 Feb;28(2):115-27. doi: 10.1007/s10096-008-0602-7. Epub 2008 Aug 8. Eur J Clin Microbiol Infect Dis. 2009. PMID: 18688664 Review.
Cited by
-
Staphylococcus epidermidis clones express Staphylococcus aureus-type wall teichoic acid to shift from a commensal to pathogen lifestyle.Nat Microbiol. 2021 Jun;6(6):757-768. doi: 10.1038/s41564-021-00913-z. Epub 2021 May 24. Nat Microbiol. 2021. PMID: 34031577
-
Staphylococcus aureus and the Cutaneous Microbiota Biofilms in the Pathogenesis of Atopic Dermatitis.Microorganisms. 2019 Aug 29;7(9):301. doi: 10.3390/microorganisms7090301. Microorganisms. 2019. PMID: 31470558 Free PMC article. Review.
-
Antimicrobial Activity of Clinically Isolated Bacterial Species Against Staphylococcus aureus.Front Microbiol. 2020 Jan 15;10:2977. doi: 10.3389/fmicb.2019.02977. eCollection 2019. Front Microbiol. 2020. PMID: 32010080 Free PMC article.
-
Host-microbe interactions in chronic rhinosinusitis biofilms and models for investigation.Biofilm. 2023 Sep 29;6:100160. doi: 10.1016/j.bioflm.2023.100160. eCollection 2023 Dec 15. Biofilm. 2023. PMID: 37928619 Free PMC article. Review.
-
Application of a Novel "Pan-Genome"-Based Strategy for Assigning RNAseq Transcript Reads to Staphylococcus aureus Strains.PLoS One. 2015 Dec 30;10(12):e0145861. doi: 10.1371/journal.pone.0145861. eCollection 2015. PLoS One. 2015. PMID: 26717500 Free PMC article.
References
-
- Lowy FD (1998) Staphylococcus aureus infections. N Engl J Med 339: 520–532. - PubMed
-
- Miles AA (1941) Some problems of wound infection. The Lancet 238: 507–510.
-
- Krismer B, Peschel A (2011) Does Staphylococcus aureus nasal colonization involve biofilm formation? Future Microbiol 6: 489–493. - PubMed
-
- Weidenmaier C, Goerke C, Wolz C (2012) Staphylococcus aureus determinants for nasal colonization. Trends Microbiol 20: 243–250. - PubMed
Publication types
MeSH terms
Substances
LinkOut - more resources
Full Text Sources
Other Literature Sources
Molecular Biology Databases
