. 2014 Jan;10(1):e1003882.
doi: 10.1371/journal.ppat.1003882. Epub 2014 Jan 16.

Gammaherpesviral gene expression and virion composition are broadly controlled by accelerated mRNA degradation

Affiliations

Gammaherpesviral gene expression and virion composition are broadly controlled by accelerated mRNA degradation

Emma Abernathy et al. PLoS Pathog. 2014 Jan.

Abstract

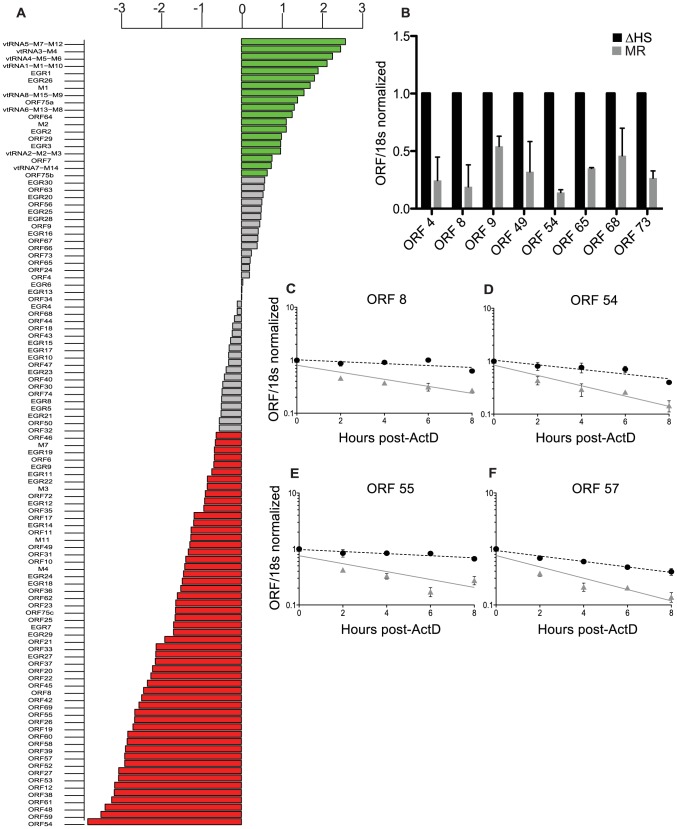
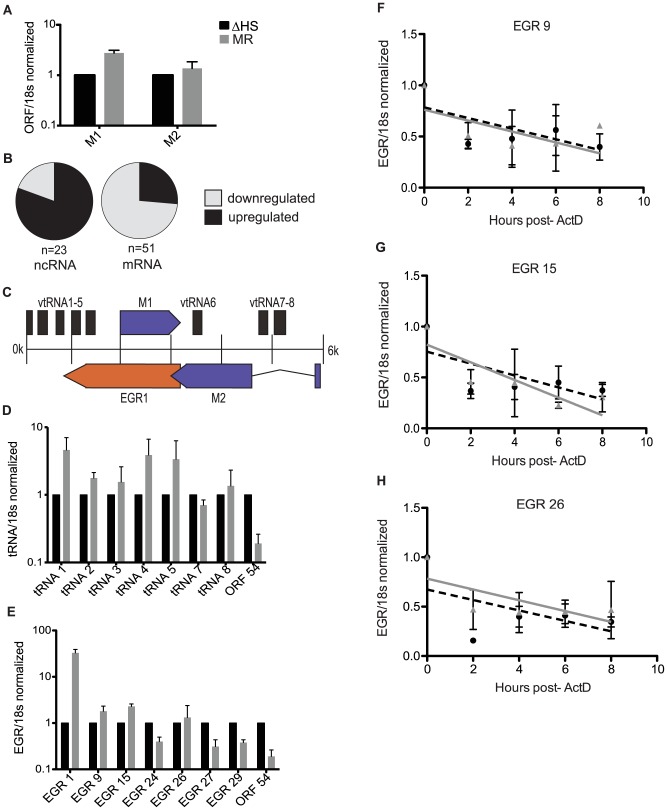
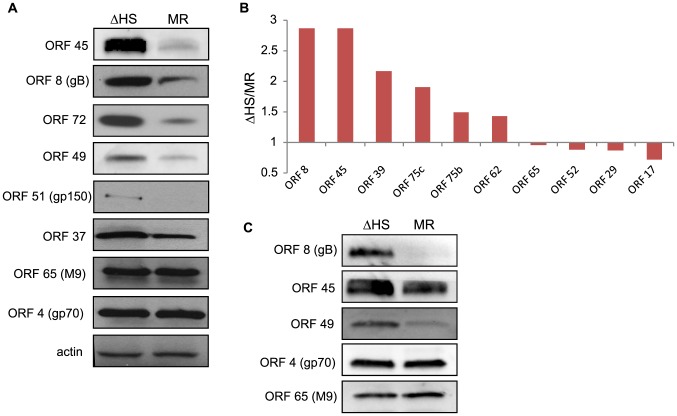
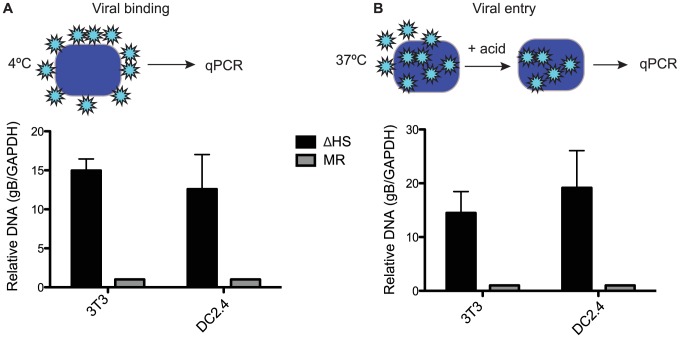
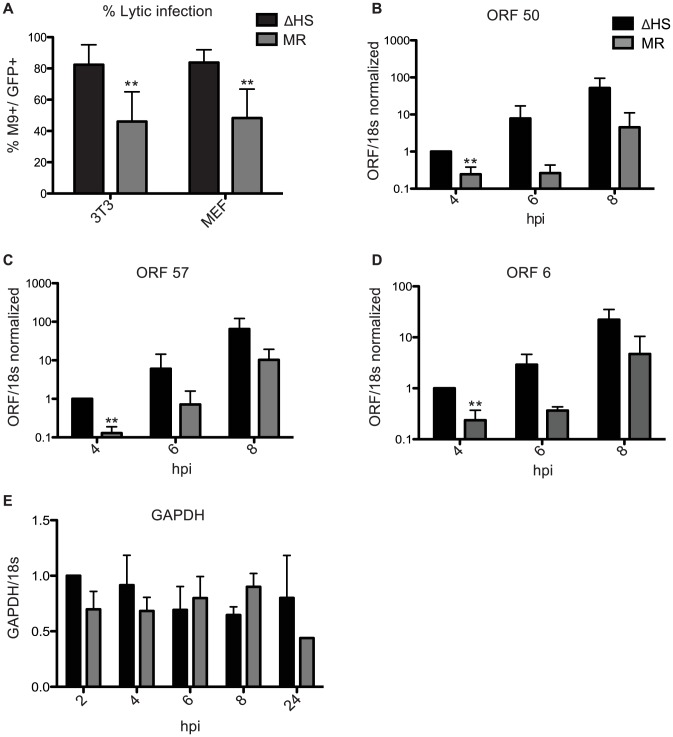
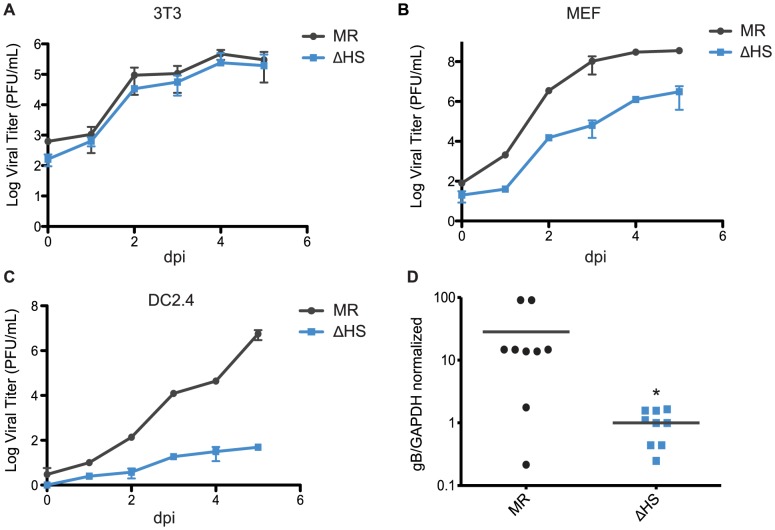
Lytic gammaherpesvirus infection restricts host gene expression by promoting widespread degradation of cytoplasmic mRNA through the activity of the viral endonuclease SOX. Though generally assumed to be selective for cellular transcripts, the extent to which SOX impacts viral mRNA stability has remained unknown. We addressed this issue using the model murine gammaherpesvirus MHV68 and, unexpectedly, found that all stages of viral gene expression are controlled through mRNA degradation. Using both comprehensive RNA expression profiling and half-life studies we reveal that the levels of the majority of viral mRNAs but not noncoding RNAs are tempered by MHV68 SOX (muSOX) activity. The targeting of viral mRNA by muSOX is functionally significant, as it impacts intracellular viral protein abundance and progeny virion composition. In the absence of muSOX-imposed gene expression control the viral particles display increased cell surface binding and entry as well as enhanced immediate early gene expression. These phenotypes culminate in a viral replication defect in multiple cell types as well as in vivo, highlighting the importance of maintaining the appropriate balance of viral RNA during gammaherpesviral infection. This is the first example of a virus that fails to broadly discriminate between cellular and viral transcripts during host shutoff and instead uses the targeting of viral messages to fine-tune overall gene expression.


Conflict of interest statement

The authors have declared that no competing interests exist.

Figures

Figure 1
Figure 1. Expression of the majority of viral mRNAs is dampened during host shutoff.
(A) For viral genes, the log2 fold change in expression upon infection with WT compared to ΔHS MHV68 expression was plotted and data points were colored to indicate the adjusted P values, with green points indicating positive log2 fold change with P value<0.05 and red indicating negative log2 fold change with P value<0.05. (B) RT-qPCR was used to validate selective viral transcripts. RNA was isolated at 24 hpi from NIH 3T3 cells infected with MR or ΔHS MHV68 at an MOI of 5. Transcript levels were normalized to 18 s and ΔHS levels set to 1. (C–F) mRNA half-life analyses were conducted by infecting NIH 3T3 cells with MR or ΔHS MHV68 at an MOI of 5. At 18 hpi, 2 ug of Actinomycin D was added to block transcription and RNA was harvested at the indicated times thereafter. RT-qPCR was performed with ORF-specific primers and probes to determine mRNA levels. The black dotted line indicates the best-fit line for the ΔHS virus, and the grey solid line indicates the best-fit line for the MR virus.
Figure 2
Figure 2. Noncoding RNAs are enriched in the escapee population.
(A) RT-qPCR on viral transcripts M1 and M2. RNA was harvested from infected NIH 3T3 cells at 24 hpi. Viral transcripts were normalized to 18 s and ΔHS levels set to 1. (B) The array data was used to determine what percentage of viral noncoding RNAs (ncRNAs) are upregulated during a MR infection (70%), and what percentage of viral mRNAs are downregulated (83.3%). (C) Schematic of the left end of the MHV68 genome, including the 8 viral tRNAs, Expressed Genomic Region (EGR 1), and ORFs M1 and M2. (D and E) RT-qPCR on viral ncRNA was done by harvesting RNA from infected NIH 3T3 cells at 24 hpi. cDNA was made using transcript specific reverse primers and each transcript was normalized to 18 s and ΔHS levels set to 1. ORF54 was used as a control to show downregulation. 3–5 independent RT-qPCRs were done for each transcript. (F–H) EGR half-life analyses were conducted by infecting NIH 3T3 cells with MR or ΔHS MHV68 at an MOI of 5. At 18 hpi, 2 ug of Actinomycin D was added to block transcription and RNA was harvested at the indicated times thereafter. RT-qPCR was performed with EGR-specific primers to determine transcript levels. The black dotted line indicates the best-fit line for the ΔHS virus, and the grey solid line indicates the best-fit line for the MR virus.
Figure 3
Figure 3. RNA degradation alters intracellular viral protein levels and virion composition.
(A) To compare the accumulation of viral proteins during infection with ΔHS and MR MHV68, NIH 3T3 cells were infected at MOI of 5 and cell lysates collected at 24 hpi. Viral proteins were detected using antibodies against ORF 45, 8, 72, 49, 51, 37, 65, and 4. Actin was used as a loading control. (B) Relative abundance of some virion proteins comparing ΔHS levels over MR based on mass spectrometry (MS) peptide counts. Virions were isolated by sucrose gradient centrifugation and run through MS. Peptide numbers were normalized to major capsid ORF 25 and genome number as determined by qPCR. Graph includes data from two independent MS runs. (C) Virions were isolated by sucrose gradient centrifugation and abundance of the virion proteins ORF 8, 45, 49, 4, and 65 were determined by Western blot.
Figure 4
Figure 4. Altered virion composition leads to enhanced cell surface binding and entry.
(A) Schematic showing cells were infected at an MOI of 5 at 4°C to allow viral binding, but prevent uptake. Both NIH 3T3 cells and DC2.4 cells were infected with MR or ΔHS MHV68. Cells were washed 4X with PBS at 90 min post infection, DNA was isolated, and qPCR used to quantify relative DNA levels by normalizing gB to GAPDH levels and setting MR levels to 1. (B) Cells were infected at an MOI of 5 at 37°C to allow uptake of virions. At 90 min post infection, the viral particles not internalized were stripped from the surface by the addition of 40 mM citric acid for 5 minutes and washed 4X with PBS. DNA was isolated and qPCR used to quantify relative DNA levels of internalized virus. Each graph represents 3 independent experiments.
Figure 5
Figure 5. Failure to degrade viral mRNAs leads to enhanced lytic cycle entry.
(A) Shown is the percent of lytic-expressing infected NIH 3T3 or MEF cells. Cells were infected at an MOI of 5 with GFP-BAC MHV68 MR or ΔHS and were analyzed at 18 hpi for GFP and M9 expression by immunofluorescence using anti-M9 antibodies. 5 fields of view from three independent experiments were counted and the percentage of GFP+M9+ cells calculated. ** Indicates p-value<0.01, determined by student t-test. (B–D) To measure levels of RTA-responsive transcripts after infection with MR or ΔHS MHV68, NIH 3T3 cells were infected at an MOI of 5 and RNA harvested at indicated times post infection. RT-qPCR was used to quantify relative levels of ORF 50 (B), ORF 57 (C), and ORF 6 (D). (E) GAPDH levels were measured to show that host shutoff had not yet initiated at the 8 hpi time point.
Figure 6
Figure 6. muSOX-induced mRNA degradation is important for viral amplification in a cell type specific manner in vitro and in vivo.
(A–C) Multi-step growth curves were done in (A) NIH 3T3 cells, (B) murine embryonic fibroblasts, or (C) DC2.4 cells. Cells were infected at an MOI of 0.05 with MR or ΔHS MHV68, cells and supernatant collected at the indicated times post infection, and the titer was determined by plaque assay. At least three independent experiments were performed for each cell type. (D) C57BL/6 mice were infected by the intraperitoneal route with 1×10³ pfu of MR or ΔHS MHV68. At 10 dpi spleens were harvested, homogenized, DNA extracted, and qPCR used to quantify viral particles. Each dot represents the relative value from a single spleen, and the bar indicates the mean value for each virus. * Indicates p-value<0.05.

References

    1. Richner JM, Clyde K, Pezda AC, Cheng BY, Wang T, et al. (2011) Global mRNA degradation during lytic gammaherpesvirus infection contributes to establishment of viral latency. PLoS Pathog 7: e1002150. - PMC - PubMed
    1. Kwong AD, Frenkel N (1989) The herpes simplex virus virion host shutoff function. J Virol 63: 4834–4839. - PMC - PubMed
    1. Strelow LI, Leib DA (1995) Role of the virion host shutoff (vhs) of herpes simplex virus type 1 in latency and pathogenesis. J Virol 69: 6779–6786. - PMC - PubMed
    1. Krausslich HG, Nicklin MJ, Toyoda H, Etchison D, Wimmer E (1987) Poliovirus proteinase 2A induces cleavage of eucaryotic initiation factor 4F polypeptide p220. J Virol 61: 2711–2718. - PMC - PubMed
    1. Zamora M, Marissen WE, Lloyd RE (2002) Multiple eIF4GI-specific protease activities present in uninfected and poliovirus-infected cells. J Virol 76: 165–177. - PMC - PubMed

Publication types