. 2014 Jan;10(1):e1003900.
doi: 10.1371/journal.ppat.1003900. Epub 2014 Jan 16.

TREM-1 deficiency can attenuate disease severity without affecting pathogen clearance

Affiliations

TREM-1 deficiency can attenuate disease severity without affecting pathogen clearance

Benjamin Weber et al. PLoS Pathog. 2014 Jan.

Abstract

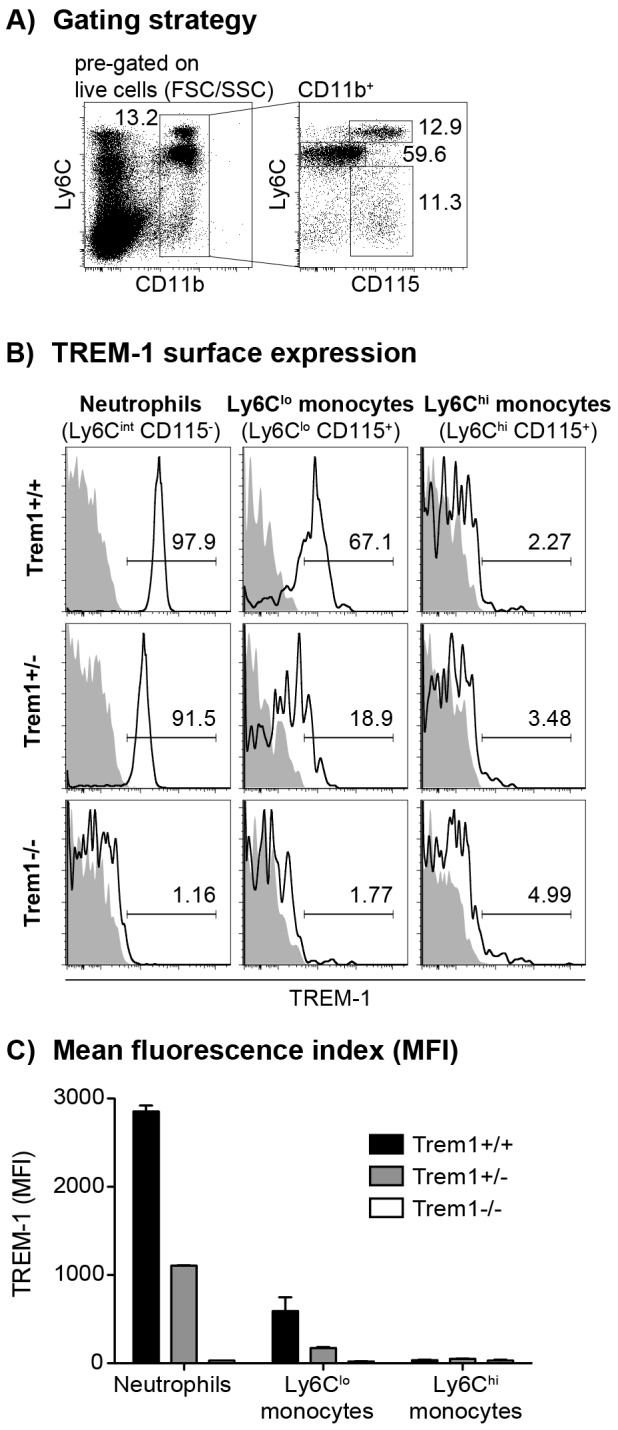
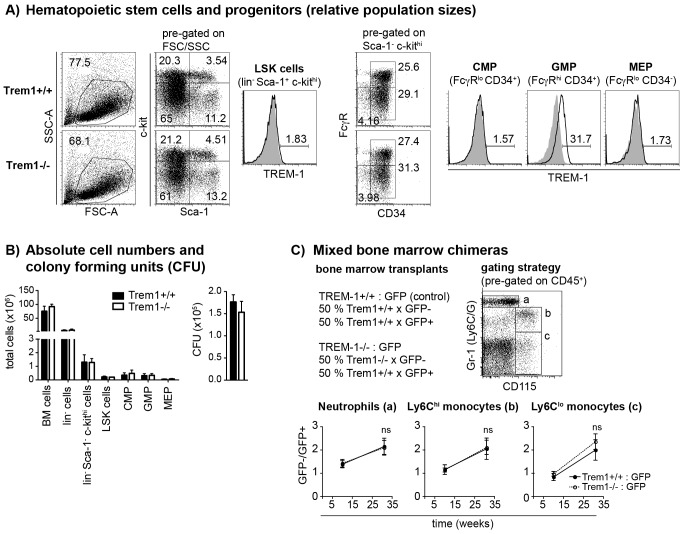
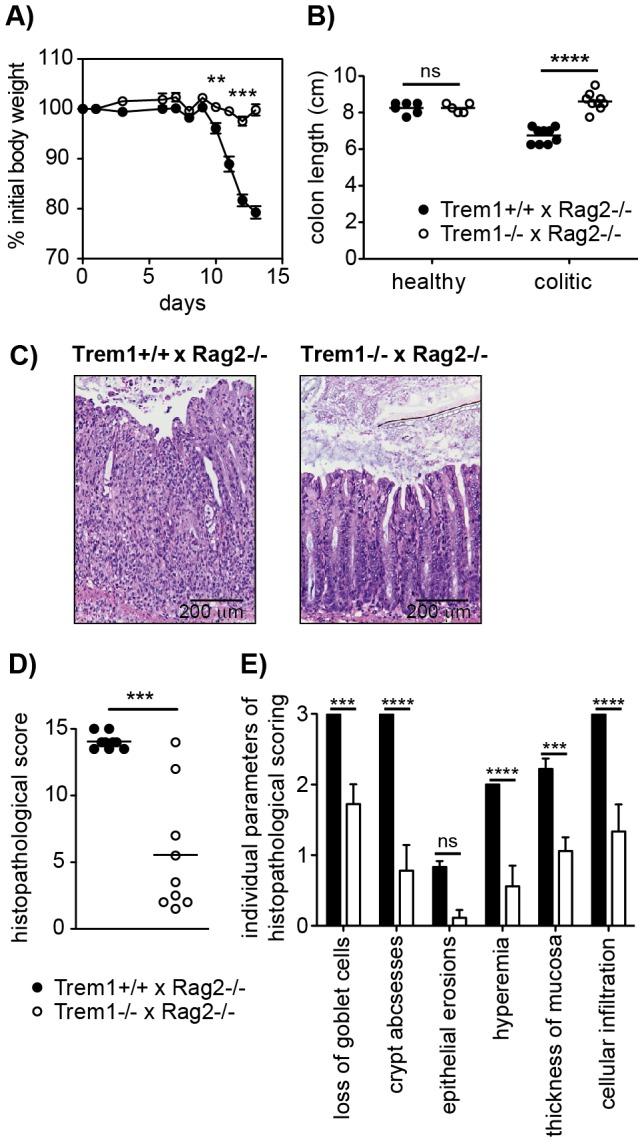
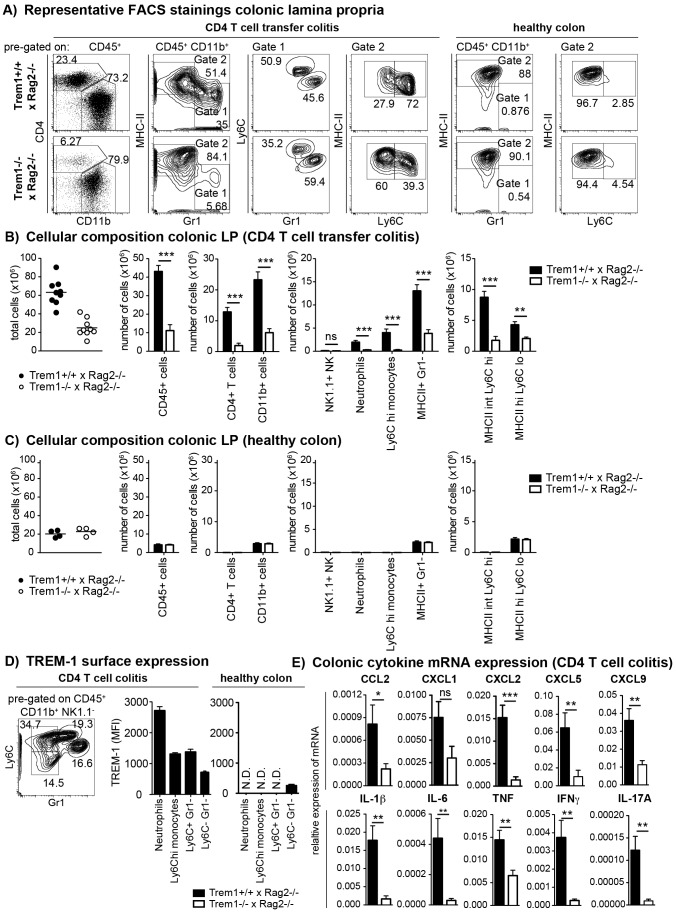
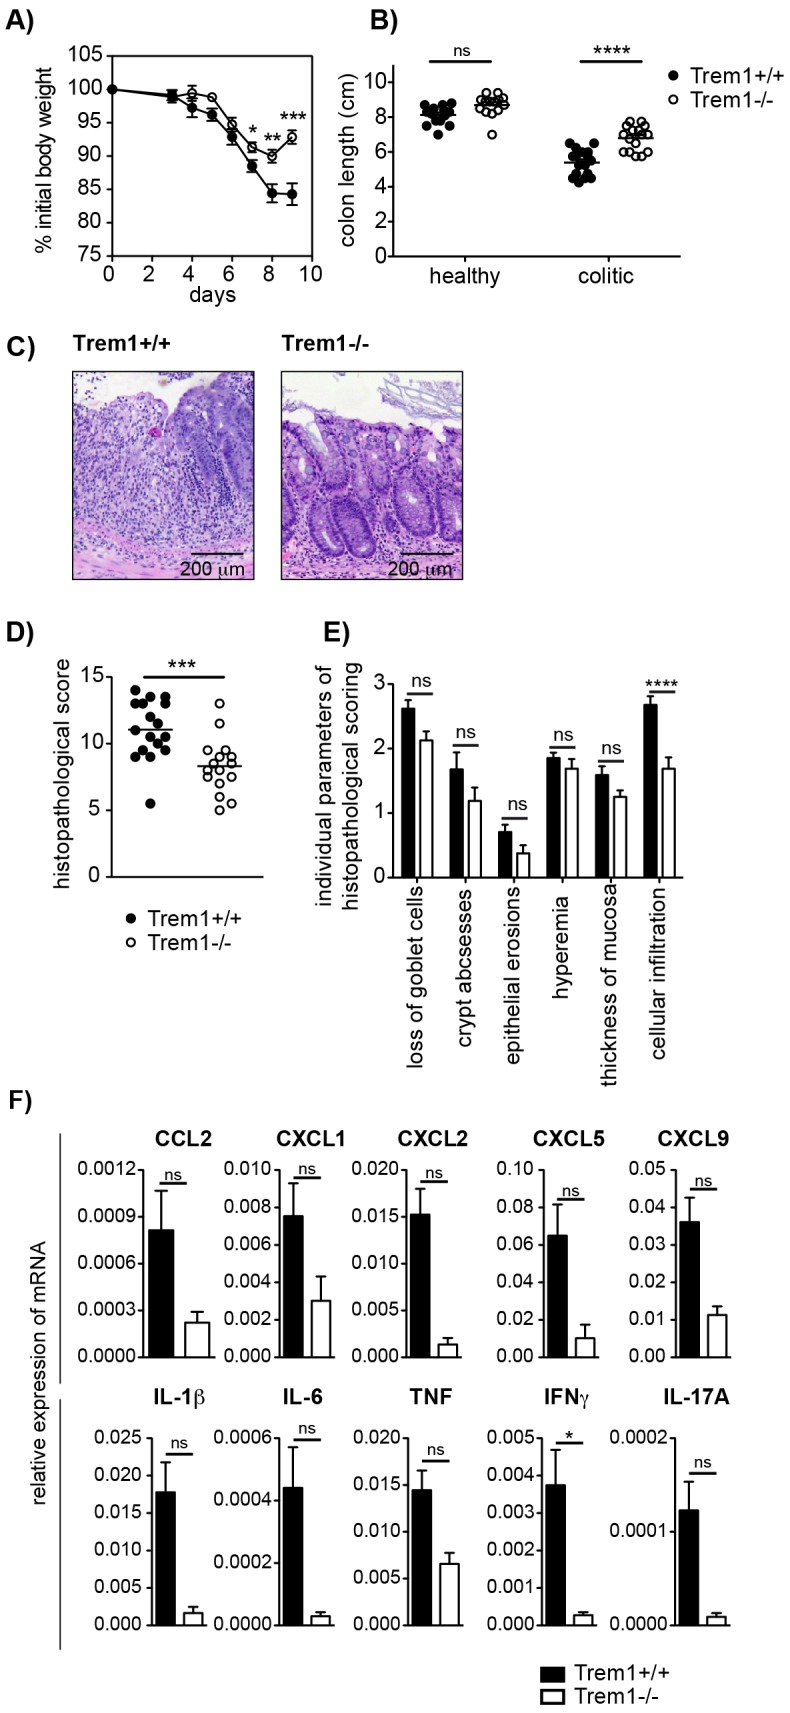
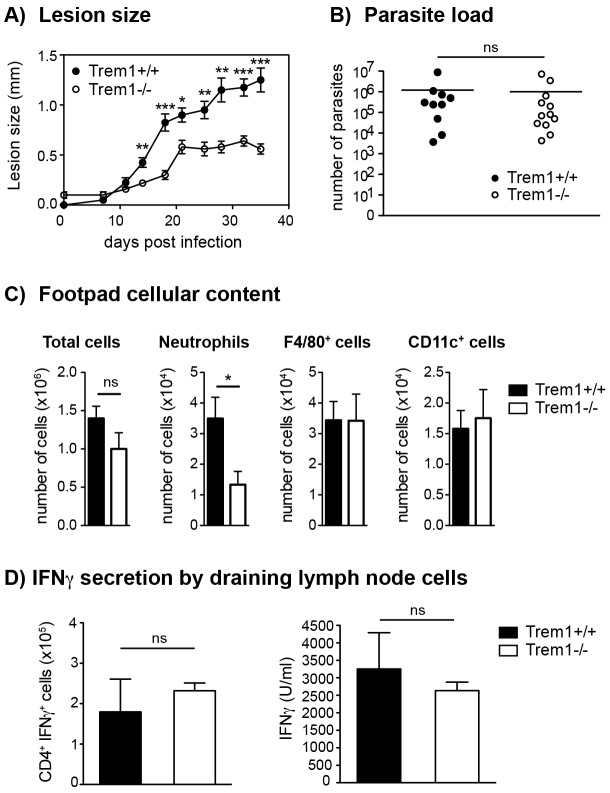
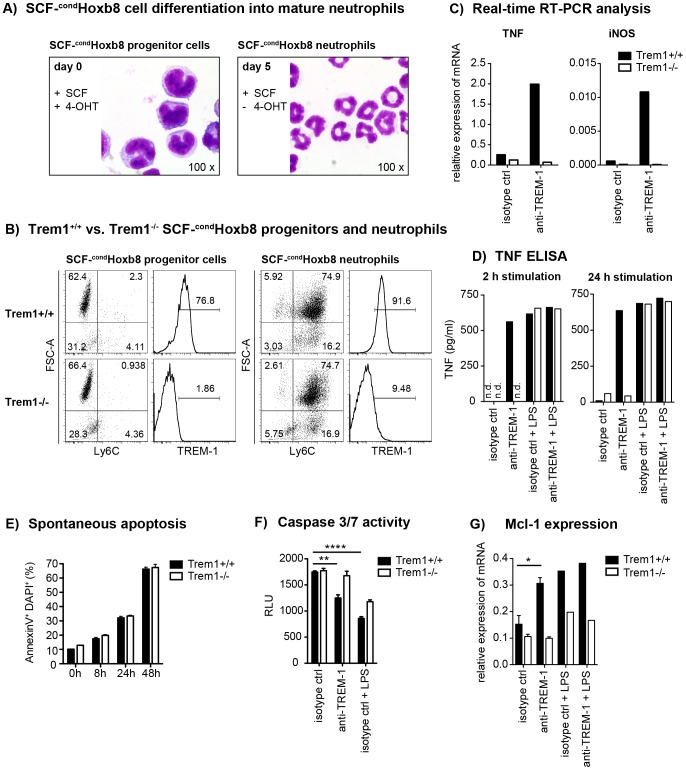
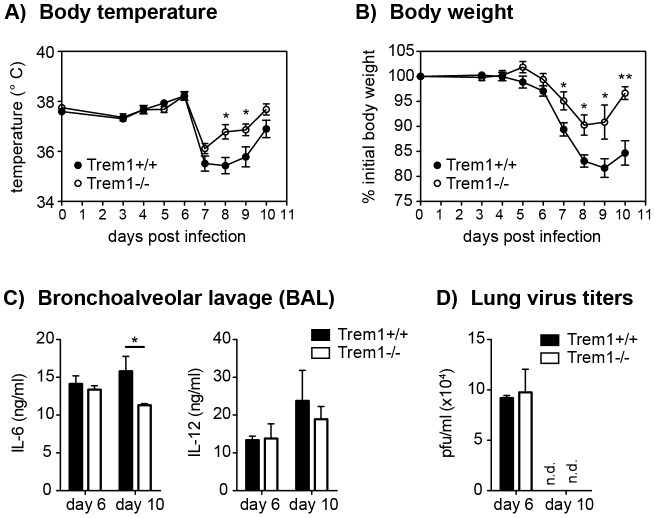
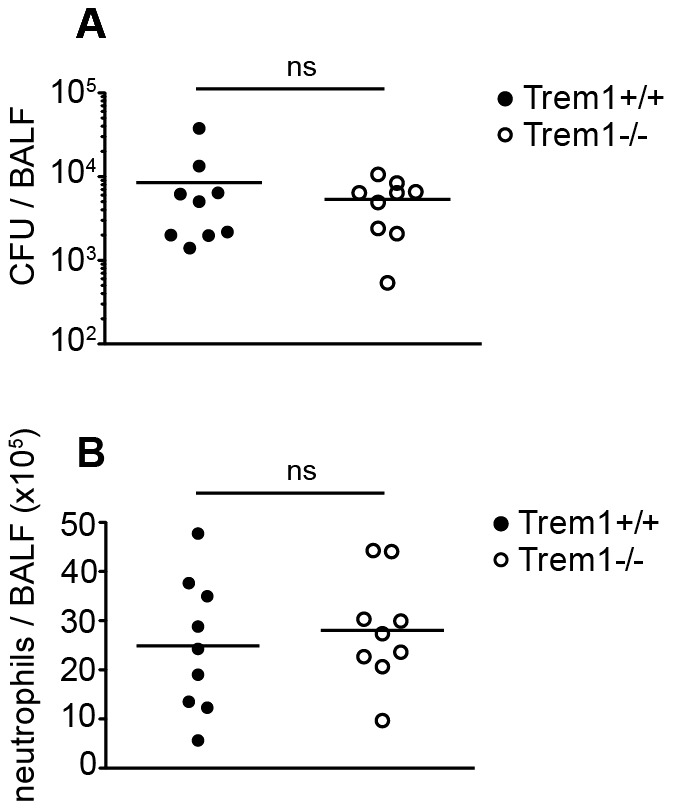
Triggering receptor expressed on myeloid cells-1 (TREM-1) is a potent amplifier of pro-inflammatory innate immune reactions. While TREM-1-amplified responses likely aid an improved detection and elimination of pathogens, excessive production of cytokines and oxygen radicals can also severely harm the host. Studies addressing the pathogenic role of TREM-1 during endotoxin-induced shock or microbial sepsis have so far mostly relied on the administration of TREM-1 fusion proteins or peptides representing part of the extracellular domain of TREM-1. However, binding of these agents to the yet unidentified TREM-1 ligand could also impact signaling through alternative receptors. More importantly, controversial results have been obtained regarding the requirement of TREM-1 for microbial control. To unambiguously investigate the role of TREM-1 in homeostasis and disease, we have generated mice deficient in Trem1. Trem1(-/-) mice are viable, fertile and show no altered hematopoietic compartment. In CD4(+) T cell- and dextran sodium sulfate-induced models of colitis, Trem1(-/-) mice displayed significantly attenuated disease that was associated with reduced inflammatory infiltrates and diminished expression of pro-inflammatory cytokines. Trem1(-/-) mice also exhibited reduced neutrophilic infiltration and decreased lesion size upon infection with Leishmania major. Furthermore, reduced morbidity was observed for influenza virus-infected Trem1(-/-) mice. Importantly, while immune-associated pathologies were significantly reduced, Trem1(-/-) mice were equally capable of controlling infections with L. major, influenza virus, but also Legionella pneumophila as Trem1(+/+) controls. Our results not only demonstrate an unanticipated pathogenic impact of TREM-1 during a viral and parasitic infection, but also indicate that therapeutic blocking of TREM-1 in distinct inflammatory disorders holds considerable promise by blunting excessive inflammation while preserving the capacity for microbial control.


Conflict of interest statement

The authors have declared that no competing interests exist.

Figures

Figure 1
Figure 1. TREM-1 surface expression by peripheral blood myeloid cell subsets from wildtype versus Trem1-deficient mice.
Peripheral blood cells obtained from wildtype (Trem1+/+) and Trem1-deficient (Trem1+/− and Trem1−/−) mice (n = 2 mice for each group) were stained for surface expression of TREM-1 and analysed by FACS. (A) Representative gating strategy to identify neutrophils and LyC6lo and Ly6Chi monocytes. (B) Representative histograms showing TREM-1 surface expression (lines) versus isotype controls (filled histograms). (C) Mean fluorescence intensity (MFI) of TREM-1 surface expression. Mean values of n = 2 mice analysed are shown with error bars indicating the range. Data are representative of several independent analyses.
Figure 2
Figure 2. Unimpaired hematopoiesis in Trem1−/− mice.
(A) Representative dot plots show the FACS-based identification of lineage-depleted (lin) Sca1+ c-kithi (LSK) cells and lin Sca1 c-Kithi myeloid progenitors in Trem1+/+ (top panels) and Trem1−/− (bottom panels) bone marrow (BM) following lineage depletion and depletion of lymphoid progenitors by MACS. Common myeloid progenitors (CMP), granulocyte-macrophage progenitors (GMP) and megakaryocyte/erythrocyte progenitors (MEP) were further discriminated according to their expression of FcγR and CD34. Filled histograms show TREM-1 surface expression by LSK cells, CMP, GMP and MEP progenitors from Trem1−/− mice in comparison to Trem1+/+ mice (lines). (B) Absolute cell numbers of total BM cells, lin BM cells, lin Sca1 c-kithi myeloid progenitors, LSK cells, CMP, GMP and MEP and colony forming units (CFU) of hematopoietic precursors isolated from the BM of Trem1+/+ and Trem1−/− mice were determined as described in the Materials and Methods section. Mean values of n = 2 mice analysed are shown with error bars indicating the range. (C) Mixed BM chimeras were generated by i.v. transfer of 1∶1 mixed Trem1+/+ x GFP+/+ and Trem1−/− x GFP−/− BM cells (white circles, dotted lines) into irradiated recipient mice. As control, and to account for potential interfering effects of the GFP expression, mixed BM from Trem1+/+ x GFP+/+ and Trem1+/+ x GFP−/− mice (black circles and lines) was transferred into additional recipient mice. BM chimeras were analyzed after 10 and 31 weeks of chimerism. Neutrophils, Ly6Chi and Ly6Clo monocytes were identified in the peripheral blood according to the depicted gating strategy and the GFP : GFP+ cell ratio in the respective cell subsets was determined. Mean values of n = 4–5 mice analyzed per group are shown with error bars indicating the SEM. ns, no statistically significant difference. Data depicted in Figure 2 are representative of two independent experiments.
Figure 3
Figure 3. Trem1−/− x Rag2−/− mice are protected from a CD4+ T cell-induced colitis.
Colitis was induced in Trem1+/+ x Rag2−/− (filled circles) and Trem1−/− x Rag2−/− mice (white circles) by i.p. injection of 2×10⁵ CD4+ CD45RBhi T cells. (A) Weight loss relative to the initial body weight. Mean values of n = 9 mice analysed per group are shown with error bars indicating the SEM. (B) Colon lengths were determined in individual mice (symbols). Lines show mean values for each group of mice. (C) Representative H&E-stained colonic tissue sections of a Trem1+/+ x Rag2−/− (histopathological score: 14) and Trem1−/− x Rag2−/− mouse (histopathological score: 2). (D) Total histopathological scores. Symbols show total scores for individual mice and lines indicate the mean value for each group of mice. Histopathological scores were determined for individual mice by a pathologist according to parameters defined in the Materials and Methods section. (E) Individual parameters of histopathological scoring. Columns show mean values for n = 9 mice analysed per group and error bars indicate the SEM. ****, p<0.0001; ***, p<0.001; **, p<0.01. One representative experiment out of three independent experiments is shown.
Figure 4
Figure 4. Upon colitis induction, Trem1−/− x Rag2−/− mice exhibit substantially reduced inflammatory infiltrates and diminished expression of pro-inflammatory mediators.
(A–C) Lamina propria cells were isolated from the colon of Trem1+/+ x Rag2−/− and Trem1−/− x Rag2−/− mice 12–13 days post adoptive transfer of colitogenic CD4 T cells or from untransferred mice (healthy colons) and analysed by FACS. (A) After exclusion of doublets and dead cells, CD11b+ cells were discriminated from CD4+ T cells and further subgated into MHCIIlo Gr1+ (gate 1) and MHCIIhi Gr1 (gate 2) cells. In gate 1, monocytes and neutrophils were identified according to their Ly6Chi Gr1int and Ly6Cint Gr1hi phenotype, respectively. In gate 2, MHCII+ cells were further subdivided into two populations of MHCIIint Ly6Chi and MHCIIhi Ly6Clo cells. (B, C) Absolute numbers of total cells recovered from individual mice (symbols; lines indicate mean values per group) and mean values ± SEM for CD45+ cells, CD4+ T cells, CD11b+ cells and subsets defined within the CD11b+ gate as illustrated in (A). Per group, n = 9 mice adoptively transferred with CD4 T cells (B) and n = 4 untransferred (C) mice were analysed. (D) TREM-1 surface expression by neutrophils (Ly6Cint Gr1hi), monocytes (Ly6Chi Gr1int) and CD11b+ Gr1 Ly6C+ versus Ly6C subsets identified in the lamina propria (according to the gating strategy depicted in D) of colitic (n = 9) versus healthy (n = 4) Trem1+/+ x Rag2−/− mice. (E) Colonic tissues were assessed for the expression of pro-inflammatory mediators by qRT-PCR. Bars show mean values ± SEM for n = 9 mice. ***, p<0.001; **, p<0.01; *, p<0.05. N.D. = not determined due to insufficient cell numbers.
Figure 5
Figure 5. Attenuated dextran sodium-sulfate (DSS)-induced colitis in Trem1−/− mice.
Colitis was induced in Trem1+/+ and Trem1−/− mice by administration of 3% DSS in the drinking water for 5 days, followed by 4 days on regular tap water. (A) Weight loss relative to the initial body weight. Mean values of n = 17 (Trem1+/+) and n = 16 (Trem1−/−) mice are shown with error bars indicating the SEM. (B) Colon lengths were determined in individual DSS-treated and untreated control mice (symbols). Lines show mean values for each group of mice. (C) Representative H&E-stained colonic tissue sections of a Trem1+/+ (histopathological score: 13) and Trem1−/− mouse (histopathological score: 5.5). (D) Total histopathological scores. Symbols show total scores for individual mice and lines indicate the mean value for each group of mice. Histopathological scores were determined for individual mice by a pathologist according to parameters defined in the Materials and Methods section. (E) Individual parameters of histopathological scoring. Columns show mean values and error bars indicate the SEM. (F) Colonic tissues were assessed for the expression of pro-inflammatory mediators by qRT-PCR. Bars show mean values ± SEM for n = 7 mice per group from one independent experiment. (A, B, D) Pooled data from three independent experiments are shown. ****, p<0.001; ***, p<0.001; *, p<0.05.
Figure 6
Figure 6. Trem1−/− mice develop smaller inflammatory lesions and show decreased cellular infiltrates at L. major infection sites.
(A) Trem1+/+ and Trem1−/− mice were inoculated with 3×10⁶ L. major promastigotes s.c. in the footpad and lesion development was measured over time. Each data point represents the mean lesion size ± SEM of n = 5 mice analysed per group. (B) Parasite load was assessed at 35 days post infection (p.i.) by limiting dilution analysis. (C) Infected footpads from Trem1+/+ and Trem1−/− mice (n = 4–5 mice per group) were isolated 21 days p.i., digested and the cellular content was analysed by flow-cytometry. Data show mean values ± SEM and are representative of two independent experiments. (D) Draining lymph node cells from Trem1+/+ and Trem1−/− mice (n = 4 mice per group) were isolated 35 days p.i.; the frequency of CD4+ IFNγ+ T cells was analysed by intracellular FACS staining or cells were re-stimulated with UV-treated L. major parasites and IFNγ levels in the supernatants were assessed by ELISA. Data show mean values ± SEM of triplicate measurements. Representative data from one out of three independent experiments are shown. ***, p<0.001; **, p<0.01; *, p<0.05.
Figure 7
Figure 7. TREM-1 mediates TNF secretion and resistance to apoptosis in SCF-condHoxb8 progenitor-derived neutrophils.
SCF-condHoxb8 Trem1+/+ and Trem1−/− progenitor lines were generated by lentiviral transduction of Hoxb8 into BM-derived hematopoietic cells obtained from the respective mice and cultured in the presence of SCF and 4-hydroxytamoxifen (4-OHT). For in vitro neutrophil differentiation, SCF-cond Hoxb8 cells were cultured for additional 5–6 days in the absence of 4-OHT. (A) H&E stained cytospins of Trem1+/+ SCF-condHoxb8 progenitor cells (left) and differentiated neutrophils (right). (B) FACS-based characterization of Trem1+/+ (top panels) and Trem1−/− (bottom panels) SCF-condHoxb8 progenitor cells (left) and differentiated neutrophils (right). (C) TNF and iNOS mRNA expression by Trem1+/+ and Trem1−/− SCF-condHoxb8 differentiated neutrophils following 2 h stimulation with plate-bound agonistic anti-TREM-1 mAb or an isotype control antibody was determined by qRT-PCR. (D) TNF secretion by Trem1+/+ and Trem1−/− SCF-condHoxb8 differentiated neutrophils in response to stimulation with an agonistic anti-TREM-1 mAb or an irrelevant isotype control mAb in the presence or absence of LPS (100 ng/ml) was assessed by ELISA. (E) Spontaneous apoptosis of Trem1+/+ and Trem1−/− SCF-condHoxb8 neutrophils in vitro was analysed at 5 days post differentiation with SCF (0 h) and the indicated time-points beyond by FACS-based determination of AnnexinV and DAPI double-positive cells. Bars show mean values ± SEM for n = 3 in vitro replicates from one representative experiment out of three independent experiments. (F) Caspase 3/7 activity was assessed upon 24 h stimulation of differentiated Trem1+/+ and Trem1−/− SCF-condHoxb8 neutrophils with plate-bound agonistic anti-TREM-1 mAb, an isotype control antibody, or LPS (100 ng/ml) as a positive survival control. Bars show mean values ± SEM for n = 3 in vitro replicates from one representative experiment out of three independent experiments. n.d., not detected. (G) Expression of Mcl-1 mRNA was assessed by qRT-PCR 2 h post stimulation with plate-bound anti-TREM-1 or an isotype control mAb in the presence or absence of LPS. Bars show mean values ± SEM of three independent experiments for anti-TREM-1 vs. isotype control mAb stimulated cells. n.d., not detected. ****, p<0.01; **, p<0.01; *, p<0.05.
Figure 8
Figure 8. Reduced morbidity but intact viral clearance in influenza virus-infected Trem1−/− mice.
Trem1+/+ and Trem1−/− mice were infected intratracheally with 50 PFU influenza A virus PR8. (A, B) Body temperature and weight loss relative to the initial body weight following infection. Graphs show pooled data from two independent experiments and mean values ± SEM of n = 10 mice per group. (C, D) Mice were sacrificed at the indicated time-points post infection. Bars show mean values ± SEM of n = 4 (day 6) and n = 6 (day 10) mice per group. (C) Lung viral titers were determined by plaque assay on MDCK cells. (D) IL-6 and IL-12 levels in BAL fluid were assessed by ELISA. n.d., not detected. **, p<0.01; *, p<0.05.
Figure 9
Figure 9. Trem1−/− mice are equally capable of clearing L. pneumophila as Trem1+/+ controls.
Trem1+/+ and Trem1−/− mice were infected intranasally with 5×10⁶ CFU L. pneumophila. 3 days post infection CFU (A) and neutrophils (B) were quantified in the BALF. ns, no statistically significant difference. Pooled data from two independent experiments are shown.

References

    1. Allcock RJ, Barrow AD, Forbes S, Beck S, Trowsdale J (2003) The human TREM gene cluster at 6p21.1 encodes both activating and inhibitory single IgV domain receptors and includes NKp44. Eur J Immunol 33: 567–577. - PubMed
    1. Ford JW, McVicar DW (2009) TREM and TREM-like receptors in inflammation and disease. Curr Opin Immunol 21: 38–46. - PMC - PubMed
    1. Klesney-Tait J, Turnbull IR, Colonna M (2006) The TREM receptor family and signal integration. Nat Immunol 7: 1266–1273. - PubMed
    1. Bouchon A, Dietrich J, Colonna M (2000) Cutting edge: inflammatory responses can be triggered by TREM-1, a novel receptor expressed on neutrophils and monocytes. J Immunol 164: 4991–4995. - PubMed
    1. Arts RJ, Joosten LA, van der Meer JW, Netea MG (2013) TREM-1: intracellular signaling pathways and interaction with pattern recognition receptors. J Leukoc Biol 93: 209–15. - PubMed

Publication types

MeSH terms

Substances