. 2014 Jan;10(1):e1004084.
doi: 10.1371/journal.pgen.1004084. Epub 2014 Jan 16.

A comprehensive tRNA deletion library unravels the genetic architecture of the tRNA pool

Affiliations

A comprehensive tRNA deletion library unravels the genetic architecture of the tRNA pool

Zohar Bloom-Ackermann et al. PLoS Genet. 2014 Jan.

Abstract

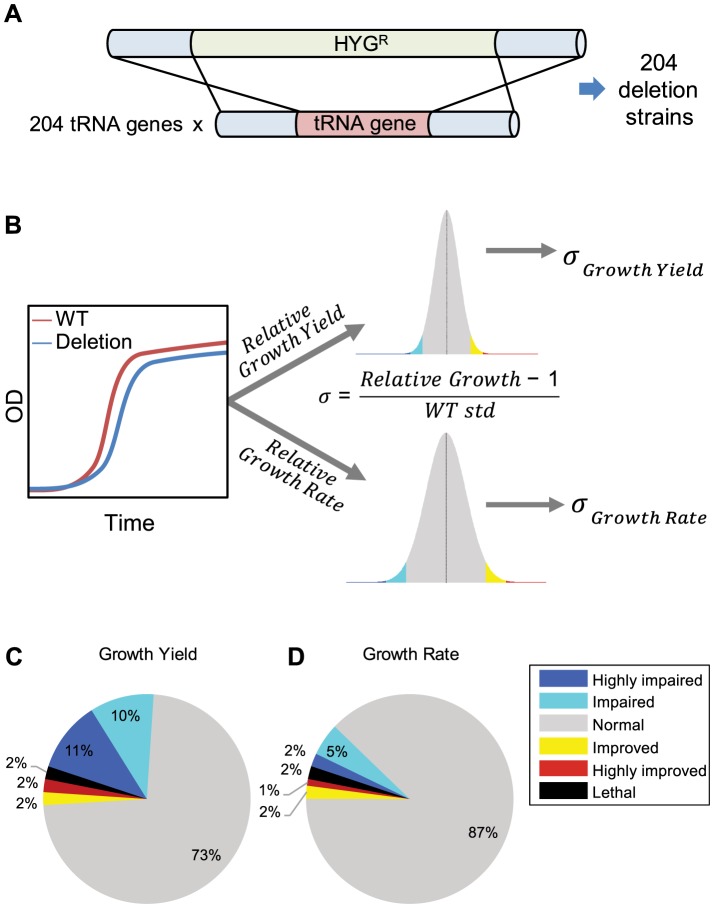
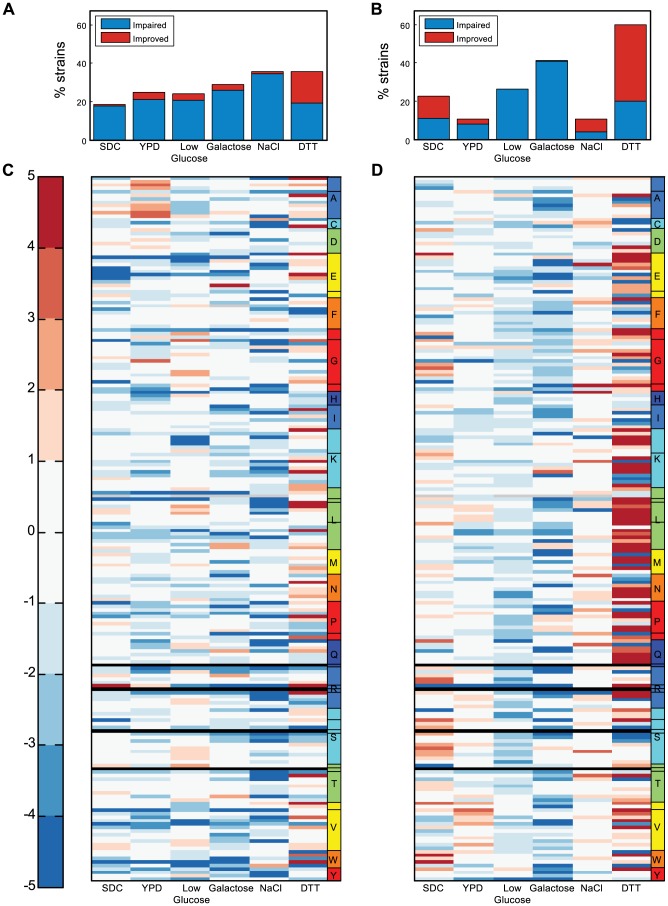
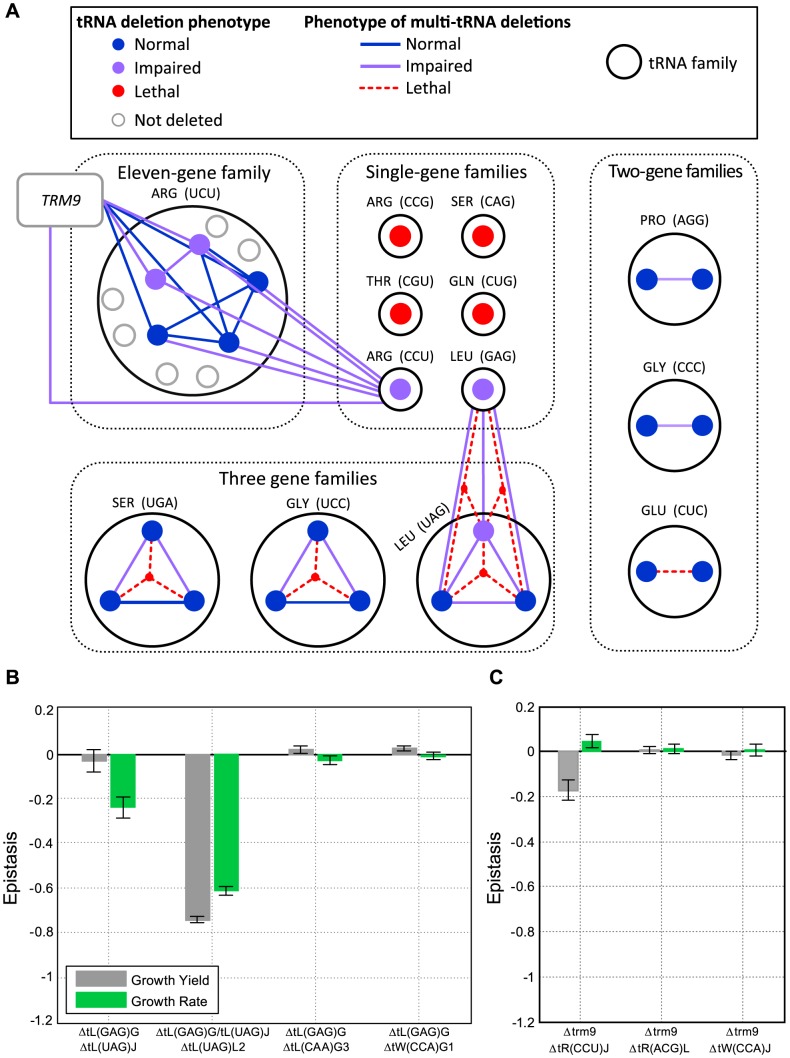
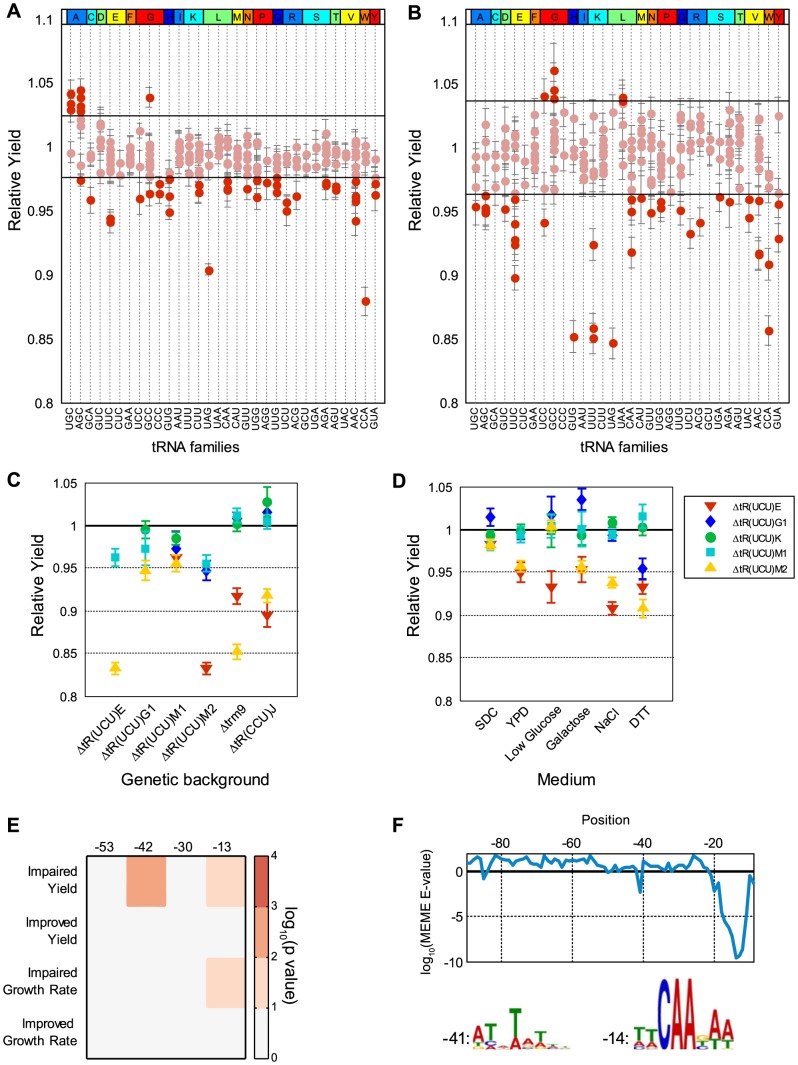
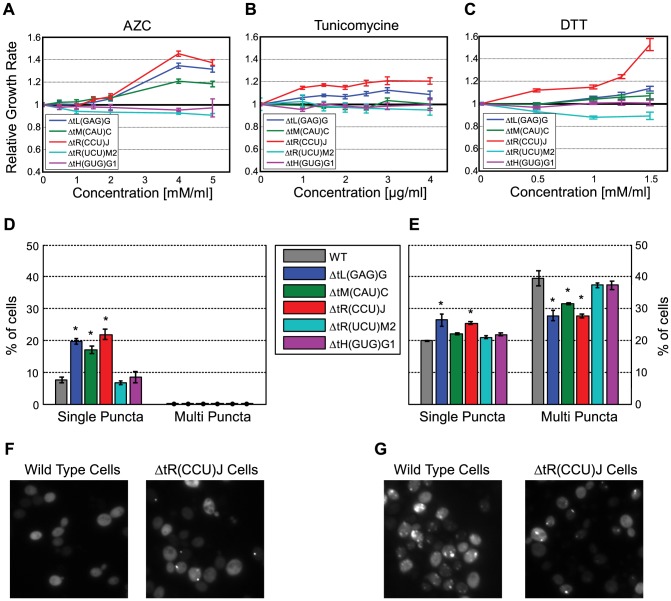
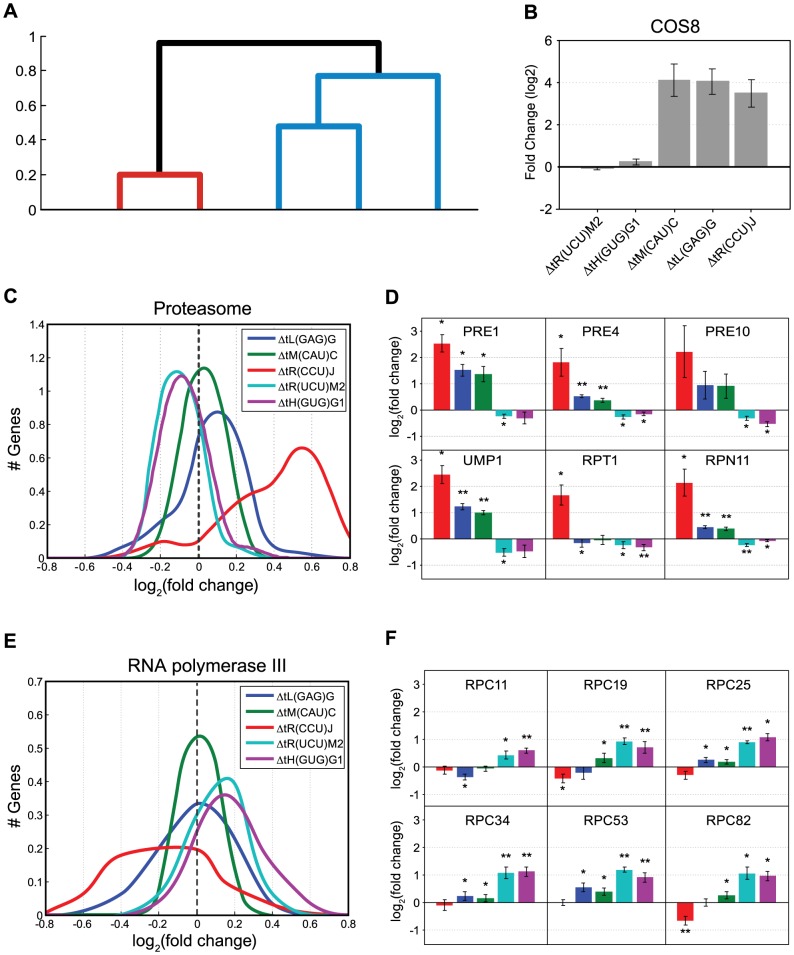
Deciphering the architecture of the tRNA pool is a prime challenge in translation research, as tRNAs govern the efficiency and accuracy of the process. Towards this challenge, we created a systematic tRNA deletion library in Saccharomyces cerevisiae, aimed at dissecting the specific contribution of each tRNA gene to the tRNA pool and to the cell's fitness. By harnessing this resource, we observed that the majority of tRNA deletions show no appreciable phenotype in rich medium, yet under more challenging conditions, additional phenotypes were observed. Robustness to tRNA gene deletion was often facilitated through extensive backup compensation within and between tRNA families. Interestingly, we found that within tRNA families, genes carrying identical anti-codons can contribute differently to the cellular fitness, suggesting the importance of the genomic surrounding to tRNA expression. Characterization of the transcriptome response to deletions of tRNA genes exposed two disparate patterns: in single-copy families, deletions elicited a stress response; in deletions of genes from multi-copy families, expression of the translation machinery increased. Our results uncover the complex architecture of the tRNA pool and pave the way towards complete understanding of their role in cell physiology.


Conflict of interest statement

The authors have declared that no competing interests exist.

Figures

Figure 1
Figure 1. Creation and analysis of tRNA deletion library.
(A) Schematic representation of the deletion process. 204 different tRNA strains were created using homologous recombination. In each strain, a different tRNA gene was replaced by a hygromycin B resistance marker. (B) Schematic representation of growth measurements, analysis, and scoring. For each strain, relative-growth-rate and relative-growth-yield are calculated in relation to the wild-type strain. These parameters are then projected on a distribution of the wild-type growth parameters. Sigma (σ) is calculated according to the formula and denotes the number of standard deviations from the mean of the wild-type (see also Supplemental figure S1A). The color in the histogram are areas were: σ<−3 (blue), −3<σ<−2 (cyan), 2<σ<3 (yellow) and 3<σ (red). The same color code is used to define phenotypes in the pie charts (C and D). (C–D) Distribution of phenotypes for the tRNA deletion library in rich medium, according to two growth parameters: relative growth yield (C) relative growth rate (D). Deletion strains were assigned to categories according to their σ values. Any absolute σ value larger than 2 was considered as non-normal phenotype, where negative sigma denotes impairment (worse than the wild-type) and positive sigma denotes improvement (better than the wild-type). Any absolute σ value larger than 3 was considered as a strong phenotype. Thus, highly impaired for σ<−3, impaired for −2>σ>−3, improved for 2<σ<3, and highly improved for σ>3, see also Supplemental figure S1B.
Figure 2
Figure 2. Screening the tRNA deletion library across various growth conditions.
(A) Percent of strains exhibiting a growth yield phenotype in various conditions. The color indicates the type of phenotype: impaired (blue) or improved (red). (B) Percent of strains exhibiting a growth rate phenotype in various conditions. (C–D) The σ values measured for both the growth yield (C) and the growth rate (D) for all deletion strains across six conditions. The color bar indicates the σ values, red denoting improvement and blue impairment. Each row denotes a tRNA deletion strain and each column denotes different growth condition. Strains are ordered on the y-axis according to amino acids (denoted by letter) and further separated into families (denoted by lines within the amino-acid box). Black rows denote lethal strains. Gray rows indicate strains for which the respective value was not measured.
Figure 3
Figure 3. Extensive redundancy underlies robustness to tRNA gene deletion.
(A) Schematic representation of the genetic interactions within and between tRNA families. Families are denoted by dark grey circles and grouped (black dashed line) according to their tRNA copy number. Each family is denoted by its anti-codon and amino-acid. A protein-coding gene i.e. TRM9 is denoted by a grey box. Each filled circle indicates a tRNA deletion strain. The lines connecting the deletion strains denote a co-deletion of these genes (a multi-tRNAs deletion strain). The color of the filled circles and lines denote the severity of the growth phenotype for the respective strain: blue for normal growth, purple for impaired growth (worse than wild-type) and red for lethality. (B) Epistasis values for multi-tRNAs deletion strains which contain the deletion of tL(GAG) and either: one tL(UAG) gene, two tL(UAG) genes, tL(CAA) (which is a tRNA of different Leucine family), and tW(CCA) (which is a non-Leucine tRNA) as controls. (C) Epistasis values for multi-tRNAs deletion strains which contain the deletion of trm9 with: the singleton tR(CCU), and tR(ACG) which is a tRNA of different Arginine family and tW(CCA) which is a non- Arginine tRNA as controls. In both (B) and (C) epistasis values of the relative growth yield and growth rate are indicated in grey and green respectively. Data is presented as mean of 3 biological repetitions +/− SEM.
Figure 4
Figure 4. Differential contribution of identical tRNA gene copies.
(A–B) Relative growth yield values of the tRNA deletion library strains in rich medium (A) and low glucose (B), sorted by anti-codon and amino-acid identity along the x-axis. Each dot along the vertical lines denotes the value (data are represented as mean of 3 biological repetitions +/− SEM) of a deletion strain of different tRNA gene of the respective family. The horizontal lines mark two standard deviations around the mean of the wild-type. Dots above or below these lines are considered non-normal phenotypes (see also Supplemental figure S7). (C) Relative growth yield values (data are presented as mean of 3 biological repetitions +/− SEM) of various double deletion combinations consisting of: five tR(UCU) family members, tR(CCU) and trm9 deletion strains as indicated on the x-axis, along with the five members of the tR(UCU) family each denoted by a different shape and color in the legend. (D) Relative growth yield of the five tR(UCU) members across different growth conditions, indicated on the x-axis. (E) Enrichment of conserved elements in tRNA genes divided according to phenotype observed in rich media for each growth parameter. Each column in the matrix denotes a conserved element as defined by . Color bar indicates the −log10 of the hypergeometric p-value. (F) log10 E-value found by the MEME software for the most significant motif in a 9 bp window starting from the position indicated by the x-axis. The LOGOs of the two significant motifs are displayed below, next to a number indicating its position. Position 0 is the first position of the mature tRNA.
Figure 5
Figure 5. Changes in the tRNA pool affect protein folding.
(A–C) Relative growth rate (compare to wild-type) of the following five deletion strain: tL(GAG)G (blue), tR(CCU)J (red), tiM(CAU)C (green), tH(GUG)G1 (magenta) and tR(UCU)M2 (cyan). Strains were grown in media supplemented with increasing concentrations of the following proteotoxic agent: AZC (A) Tunicamycin (B) DTT (C). (D) Percentage of cells that contain puncta in the populations of the above strains. (E) Percentage of cells that contain puncta in the populations of the above strains following treatment with 2.5 mM AZC. Data are presented as mean of 3 biological repetitions +/− SEM, in each repetition 500 cells were counted. (*) P<0.001 by Students t-test. (F–G) Images of representative fields for the wild-type and tR(CCU)J deletion strain, without treatment (F) and following treatment with 2.5 mM AZC (G).
Figure 6
Figure 6. Molecular response to changes in the tRNA pool.
(A) Dendrogram created by clustering changes in gene expression for five representative deletion strains, for more information see Materials and Methods. (B) Fold change of the COS8 (YHL048W) mRNA levels in each of the five deletion strains as measured by microarrays. (C) The fold change distribution of mRNA levels as measured by microarrays, of genes composing the Proteasome pathway by the KEGG database , for each of the listed tRNA deletion strains. (D) mRNA Fold change of 6 representative genes from the proteasome pathway measured by RT-qPCR. Presented values are the mean of 3 biological repetitions +/− SEM. The strain colors are as in (C). If the mRNA fold change in a specific strain is significantly different from 0 (t-test) it is marked with:* (p<0.05) or ** (p<0.005). (E) The fold change distribution of mRNA levels as measured by microarrays, of genes composing the Pol III RNA Polymerase machinery module by the KEGG database, for each tRNA deletion strain. (F) mRNA Fold change of 6 representative genes from the Pol III KEGG module measured by RT-qPCR. Presented values are the mean of 3 biological repetitions +/− SEM. The strain colors are as in figure (C). If the mRNA fold change in a specific strain is significantly different from 0 (t-test) it is marked with:* (p<0.05) or ** (p<0.005). In all the sub-figures (C,D,E,F) values are plotted for the same five deletion strains: tL(GAG)G (blue), tR(CCU)J (red), tiM(CAU)C (green), tH(GUG)G1 (magenta) and tR(UCU)M2 (cyan).

Similar articles

Cited by

References

    1. Kozak M (2005) Regulation of translation via mRNA structure in prokaryotes and eukaryotes. Gene 361: 13–37 doi:10.1016/j.gene.2005.06.037 - DOI - PubMed
    1. Jackson RJ, Hellen CUT, Pestova TV (2010) The mechanism of eukaryotic translation initiation and principles of its regulation. Nature reviews Molecular cell biology 11: 113–127 doi:10.1038/nrm2838 - DOI - PMC - PubMed
    1. Varenne S, Buc J, Lloubes R, Lazdunski C (1984) Translation is a non-uniform process. Effect of tRNA availability on the rate of elongation of nascent polypeptide chains. Journal of molecular biology 180: 549–576. - PubMed
    1. Kudla G, Murray AW, Tollervey D, Plotkin JB (2009) Coding-sequence determinants of gene expression in Escherichia coli. Science (New York, NY) 324: 255–258 doi:10.1126/science.1170160 - DOI - PMC - PubMed
    1. Stoletzki N, Eyre-Walker A (2007) Synonymous codon usage in Escherichia coli: selection for translational accuracy. Molecular biology and evolution 24: 374–381 doi:10.1093/molbev/msl166 - DOI - PubMed

Publication types

Associated data