

Regulation of synaptic nlg-1/neuroligin abundance by the skn-1/Nrf stress response pathway protects against oxidative stress
- PMID: 24453991
- PMCID: PMC3894169
- DOI: 10.1371/journal.pgen.1004100
Regulation of synaptic nlg-1/neuroligin abundance by the skn-1/Nrf stress response pathway protects against oxidative stress
Erratum in
- PLoS Genet. 2014 Apr;10(4):e1004361. Egrafov, Oleg [corrected to Evgrafov, Oleg]
Abstract
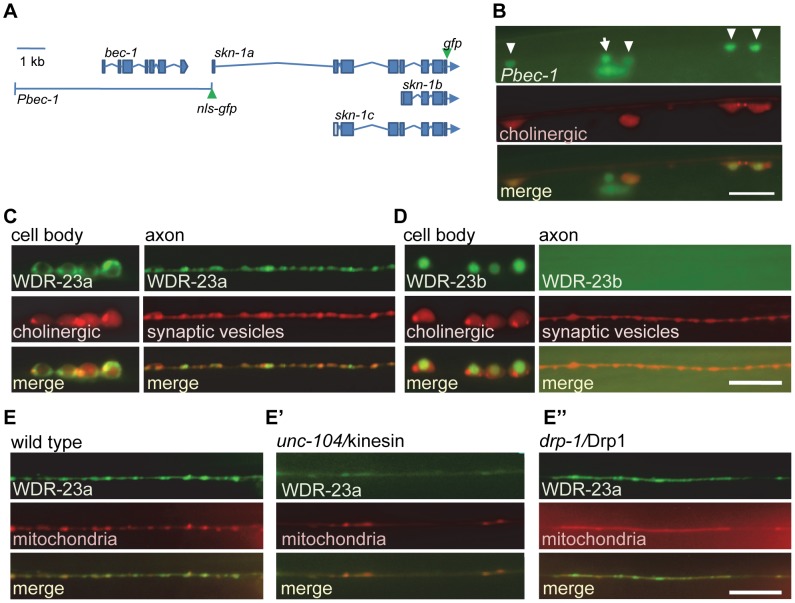
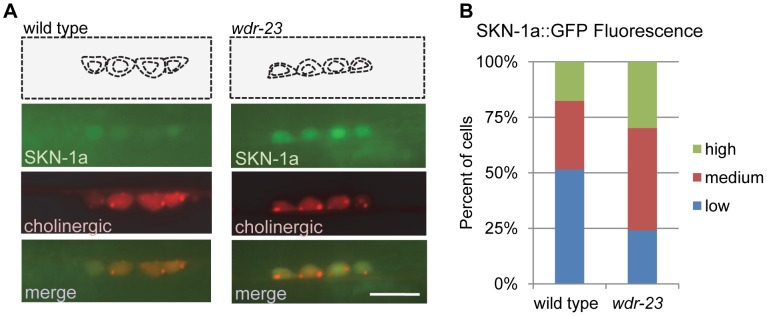
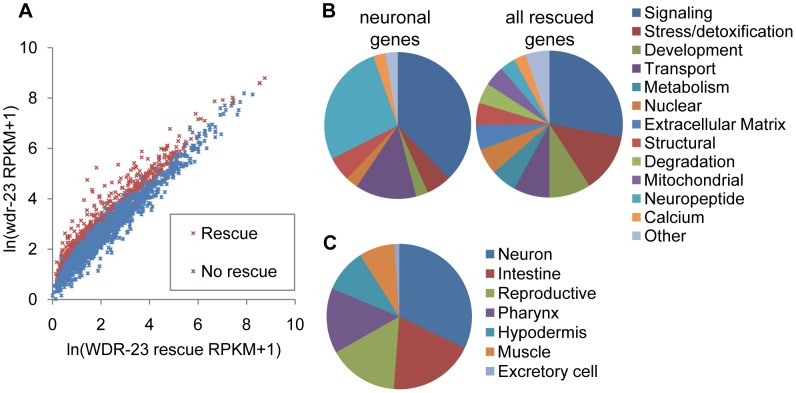
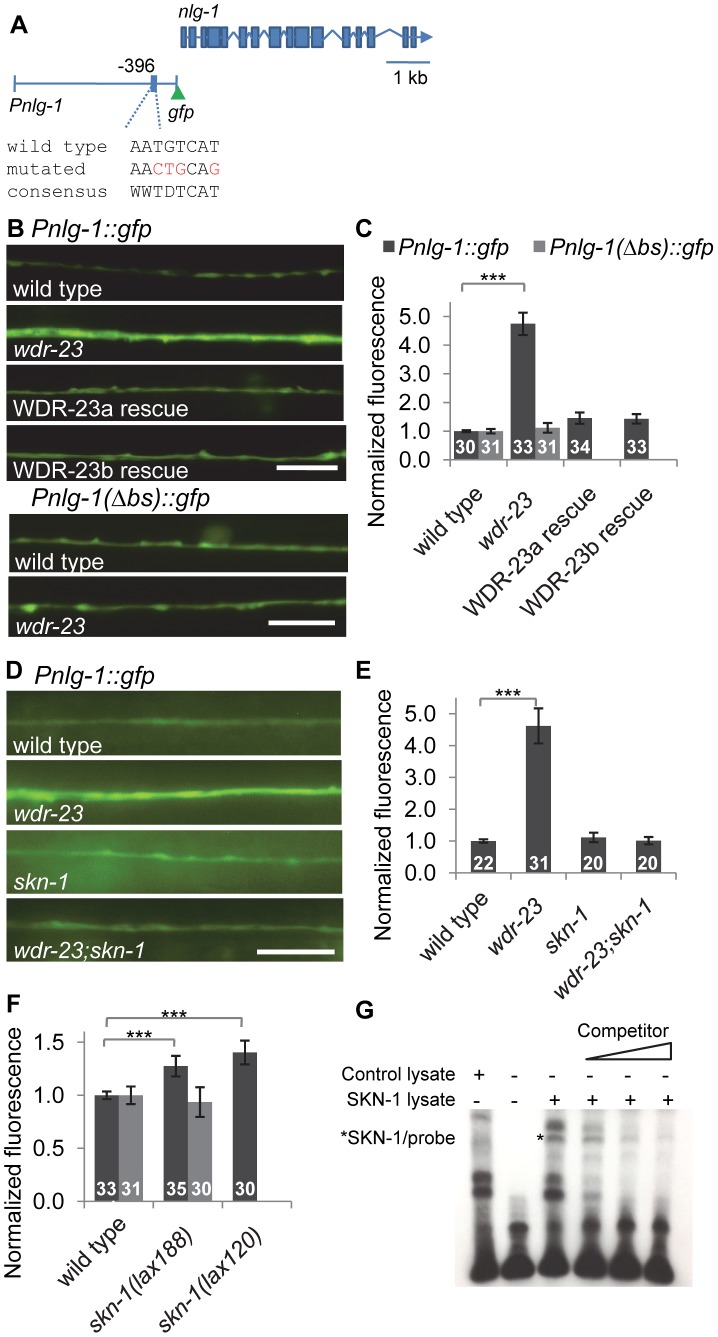
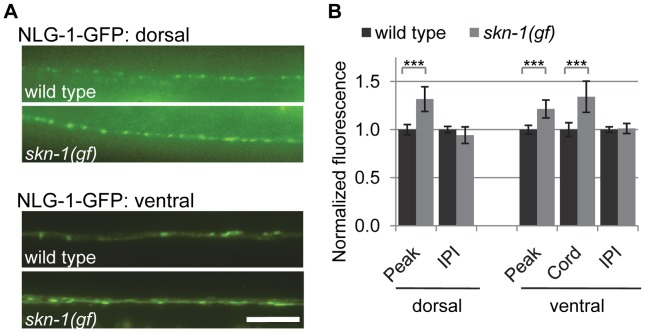
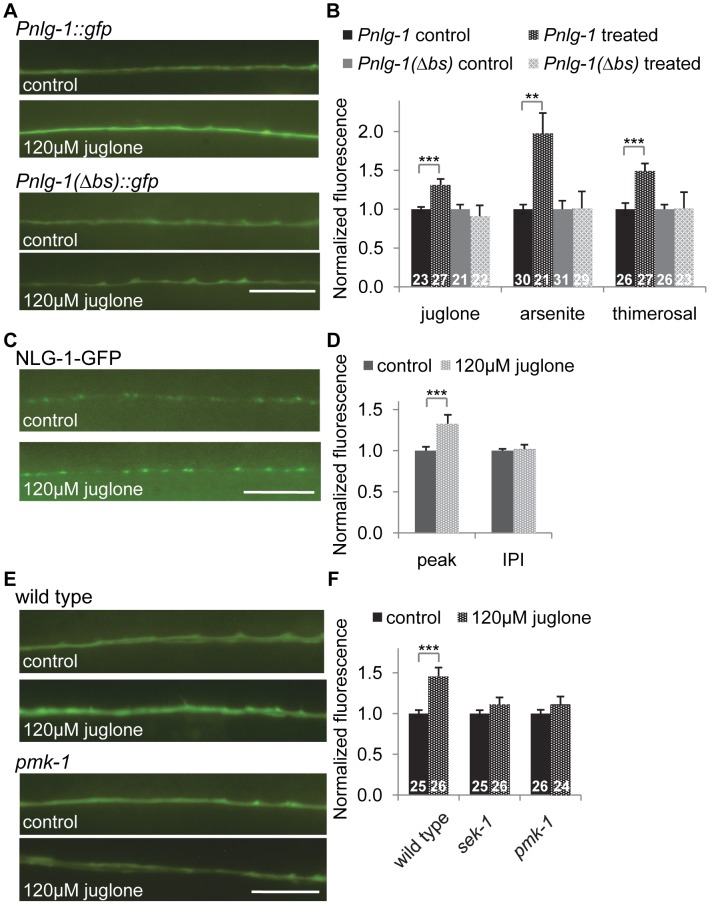
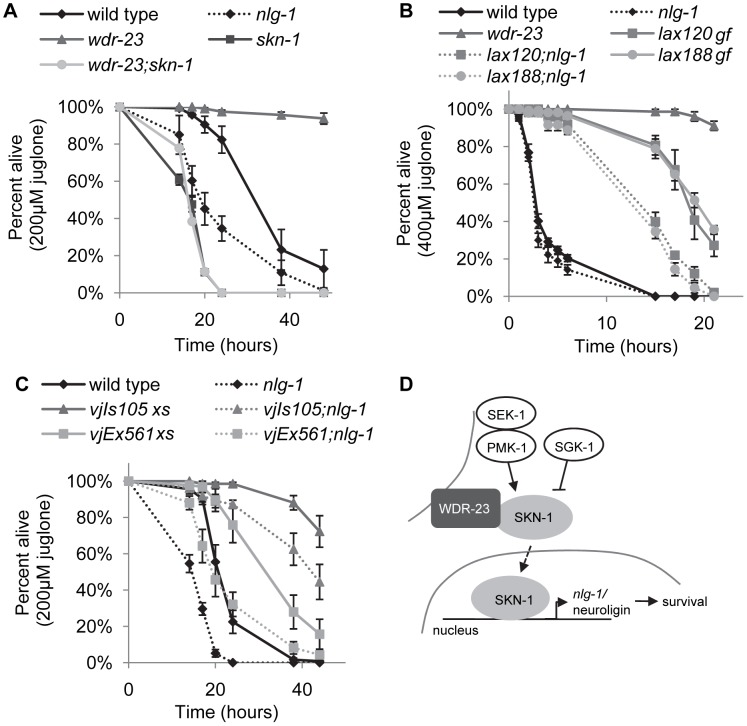
The Nrf family of transcription factors mediates adaptive responses to stress and longevity, but the identities of the crucial Nrf targets, and the tissues in which they function in multicellular organisms to promote survival, are not known. Here, we use whole transcriptome RNA sequencing to identify 810 genes whose expression is controlled by the SKN-1/Nrf2 negative regulator WDR-23 in the nervous system of Caenorhabditis elegans. Among the genes identified is the synaptic cell adhesion molecule nlg-1/neuroligin. We find that the synaptic abundance of NLG-1 protein increases following pharmacological treatments that generate oxidative stress or by the genetic activation of skn-1. Increasing nlg-1 dosage correlates with increased survival in response to oxidative stress, whereas genetic inactivation of nlg-1 reduces survival and impairs skn-1-mediated stress resistance. We identify a canonical SKN-1 binding site in the nlg-1 promoter that binds to SKN-1 in vitro and is necessary for SKN-1 and toxin-mediated increases in nlg-1 expression in vivo. Together, our results suggest that SKN-1 activation in the nervous system can confer protection to organisms in response to stress by directly regulating nlg-1/neuroligin expression.
Conflict of interest statement
The authors have declared that no competing interests exist.
Figures
Similar articles
-
The conserved SKN-1/Nrf2 stress response pathway regulates synaptic function in Caenorhabditis elegans.PLoS Genet. 2013 Mar;9(3):e1003354. doi: 10.1371/journal.pgen.1003354. Epub 2013 Mar 21. PLoS Genet. 2013. PMID: 23555279 Free PMC article.
-
F-Box Protein XREP-4 Is a New Regulator of the Oxidative Stress Response in Caenorhabditis elegans.Genetics. 2017 Jun;206(2):859-871. doi: 10.1534/genetics.117.200592. Epub 2017 Mar 24. Genetics. 2017. PMID: 28341649 Free PMC article.
-
Condition-adapted stress and longevity gene regulation by Caenorhabditis elegans SKN-1/Nrf.Aging Cell. 2009 Sep;8(5):524-41. doi: 10.1111/j.1474-9726.2009.00501.x. Epub 2009 Jul 3. Aging Cell. 2009. PMID: 19575768 Free PMC article.
-
SKN-1/Nrf, stress responses, and aging in Caenorhabditis elegans.Free Radic Biol Med. 2015 Nov;88(Pt B):290-301. doi: 10.1016/j.freeradbiomed.2015.06.008. Epub 2015 Aug 5. Free Radic Biol Med. 2015. PMID: 26232625 Free PMC article. Review.
-
Stress-activated cap'n'collar transcription factors in aging and human disease.Sci Signal. 2010 Mar 9;3(112):re3. doi: 10.1126/scisignal.3112re3. Sci Signal. 2010. PMID: 20215646 Free PMC article. Review.
Cited by
-
Neuronal responses to stress and injury in C. elegans.FEBS Lett. 2015 Jun 22;589(14):1644-52. doi: 10.1016/j.febslet.2015.05.005. Epub 2015 May 13. FEBS Lett. 2015. PMID: 25979176 Free PMC article. Review.
-
Coordination of mitophagy and mitochondrial biogenesis during ageing in C. elegans.Nature. 2015 May 28;521(7553):525-8. doi: 10.1038/nature14300. Epub 2015 Apr 20. Nature. 2015. PMID: 25896323
-
Disrupting the SKN-1 homeostat: mechanistic insights and phenotypic outcomes.Front Aging. 2024 Mar 4;5:1369740. doi: 10.3389/fragi.2024.1369740. eCollection 2024. Front Aging. 2024. PMID: 38501033 Free PMC article. Review.
-
Proteasome dysfunction triggers activation of SKN-1A/Nrf1 by the aspartic protease DDI-1.Elife. 2016 Aug 16;5:e17721. doi: 10.7554/eLife.17721. Elife. 2016. PMID: 27528192 Free PMC article.
-
Stress-Induced Neuron Remodeling Reveals Differential Interplay Between Neurexin and Environmental Factors in Caenorhabditis elegans.Genetics. 2019 Dec;213(4):1415-1430. doi: 10.1534/genetics.119.302415. Epub 2019 Sep 26. Genetics. 2019. PMID: 31558583 Free PMC article.
References
-
- Finkel T, Holbrook NJ (2000) Oxidants, oxidative stress and the biology of ageing. Nature 408: 239–247. - PubMed
-
- Halliwell B (2006) Oxidative stress and neurodegeneration: where are we now? J Neurochem 97: 1634–1658. - PubMed
-
- Abou-Sleiman PM, Muqit MM, Wood NW (2006) Expanding insights of mitochondrial dysfunction in Parkinson's disease. Nat Rev Neurosci 7: 207–219. - PubMed
-
- Zana M, Janka Z, Kalman J (2007) Oxidative stress: a bridge between Down's syndrome and Alzheimer's disease. Neurobiol Aging 28: 648–676. - PubMed
-
- Itoh K, Chiba T, Takahashi S, Ishii T, Igarashi K, et al. (1997) An Nrf2/small Maf heterodimer mediates the induction of phase II detoxifying enzyme genes through antioxidant response elements. Biochem Biophys Res Commun 236: 313–322. - PubMed
Publication types
MeSH terms
Substances
Grants and funding
LinkOut - more resources
Full Text Sources
Other Literature Sources
Molecular Biology Databases
Research Materials
