. 2014 Jan 13:7:285.
doi: 10.3389/fncel.2013.00285.

NMDA receptor-dependent regulation of miRNA expression and association with Argonaute during LTP in vivo

Affiliations

NMDA receptor-dependent regulation of miRNA expression and association with Argonaute during LTP in vivo

Balagopal Pai et al. Front Cell Neurosci. .

Abstract

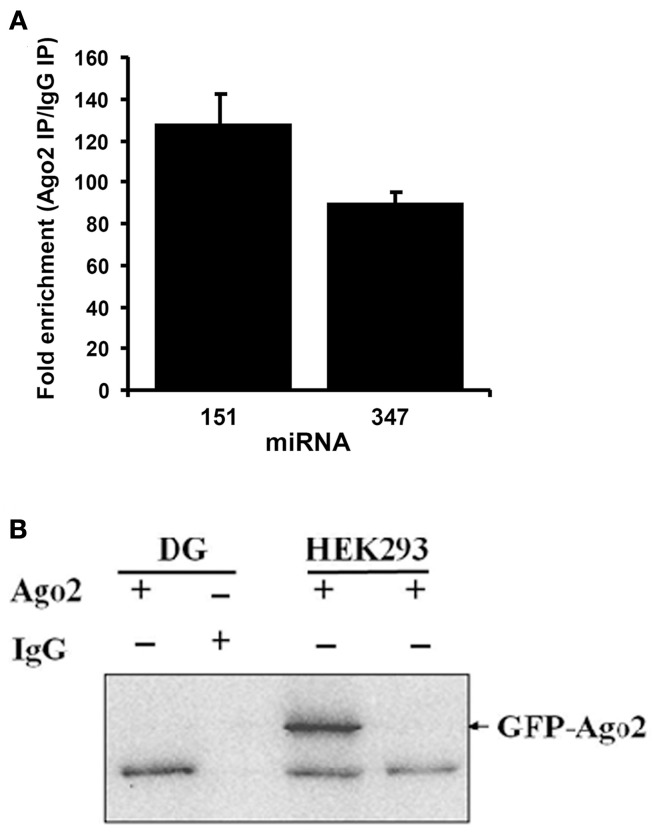
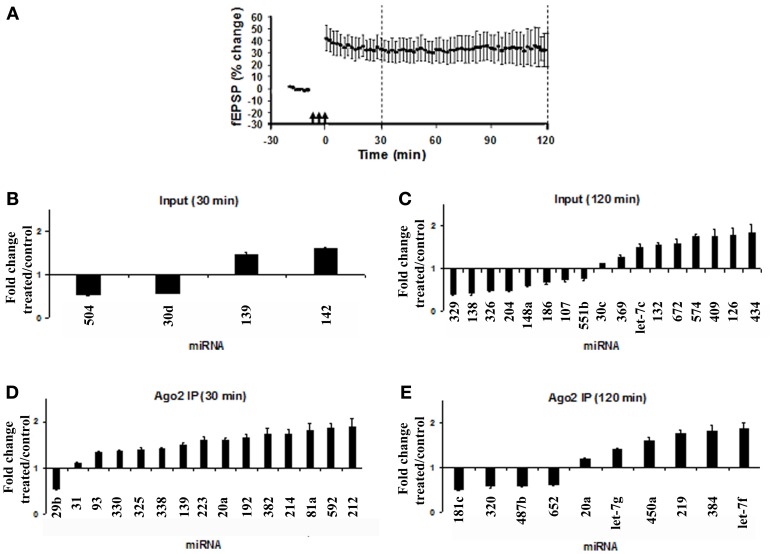
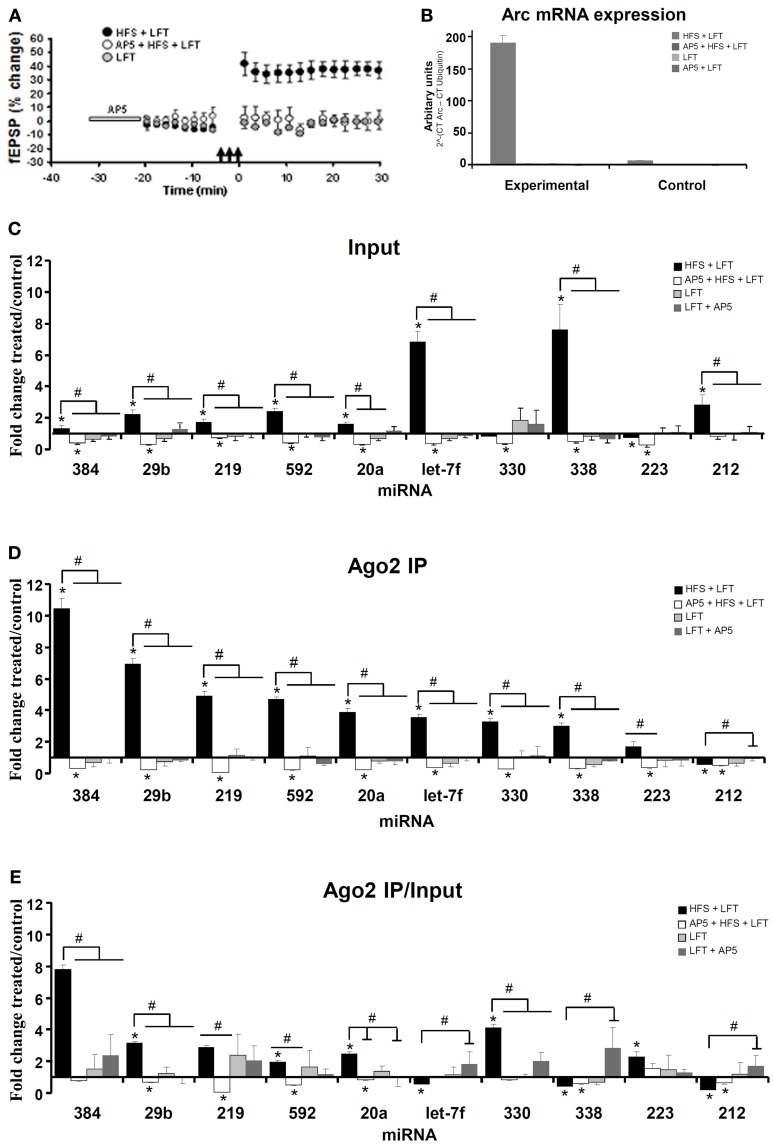
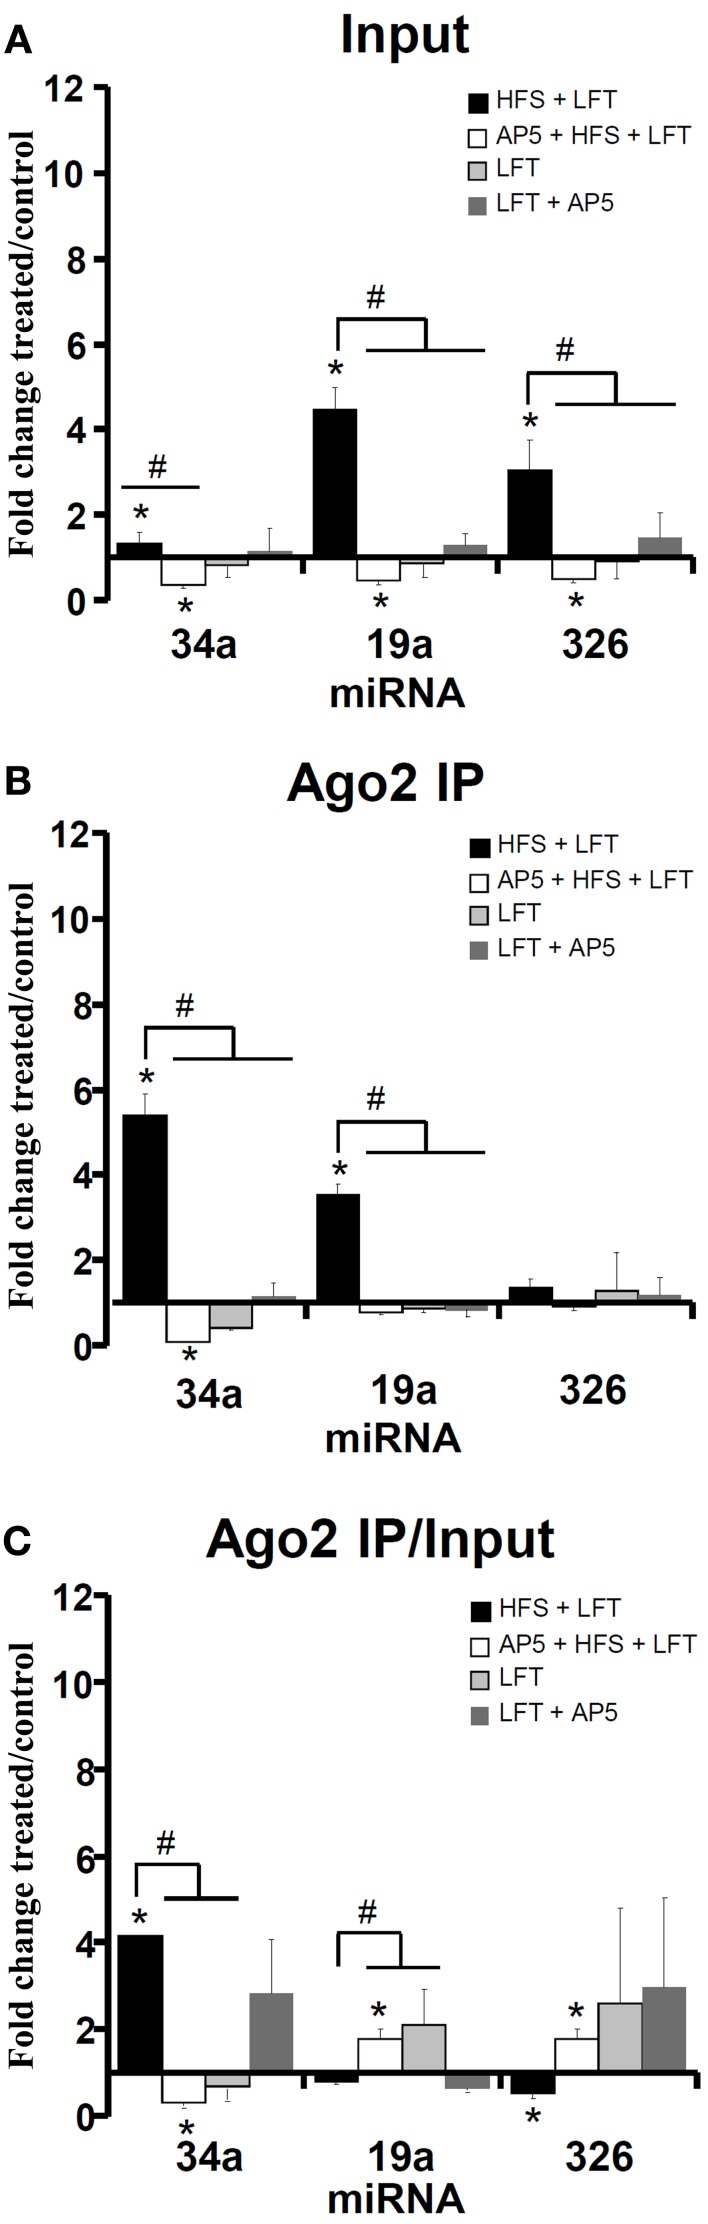
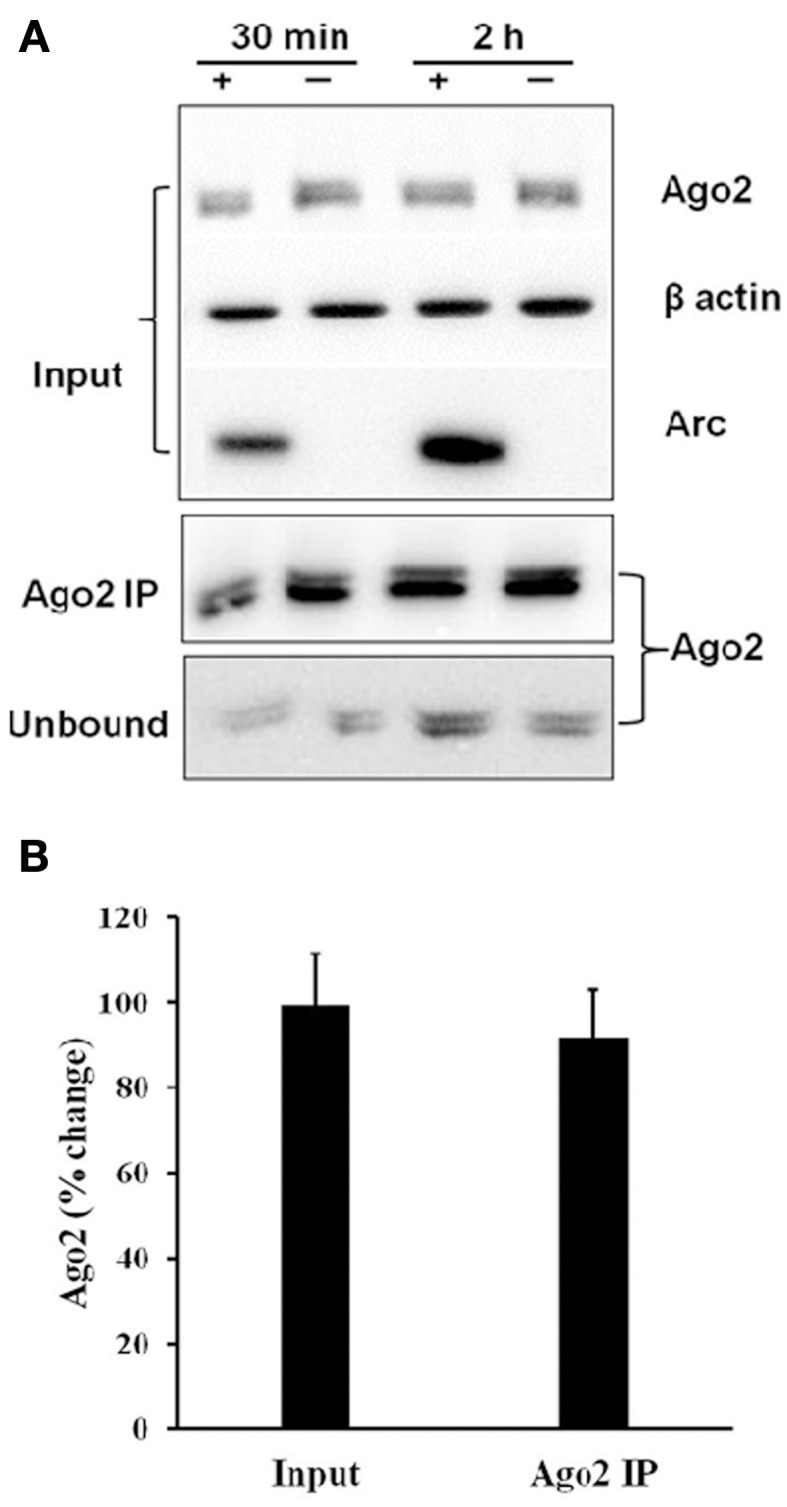
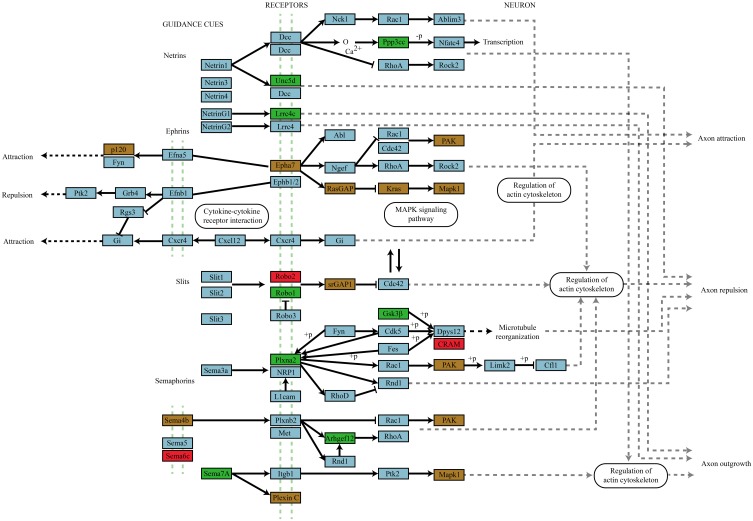
microRNAs (miRNAs) are major regulators of protein synthesis in the brain. A major goal is to identify changes in miRNA expression underlying protein synthesis-dependent forms of synaptic plasticity such as long-term potentiation (LTP). Previous analyses focused on changes in miRNA levels in total lysate samples. Here, we asked whether changes in total miRNA accurately reflect changes in the amount of miRNA bound to Argonaute protein within the miRNA-induced silencing complex (miRISC). Ago2 immunoprecipitation was used to isolate RISC-associated miRNAs following high-frequency stimulation (HFS)-induced LTP in the dentate gyrus of anesthetized rats. Using locked-nucleic acid-based PCR cards for high-throughput screening and independent validation by quantitative TaqMan RT-PCR, we identified differential regulation of Ago2-associated and total miRNA expression. The ratio of Ago2/total miRNA expression was regulated bidirectionally in a miRNA-specific manner and was largely dependent on N-methyl-D-aspartate receptor (NMDA) activation during LTP induction. The present results identify miRNA association with Ago2 as a potential control point in activity-dependent synaptic plasticity in the adult brain. Finally, novel computational analysis for targets of the Ago2-associated miRNAs identifies 21 pathways that are enriched and differentially targeted by the miRNAs including axon guidance, mTOR, MAPK, Ras, and LTP.

Keywords: Argonaute; RNA-induced silencing complex; gene expression; hippocampus; microRNA; microRNA target prediction; protein synthesis; synaptic plasticity.


Figures

Figure 1
Figure 1
Validation of Argonaute 2 immunoprecipitation. (A) Specific Ago2-immunoprecipitation of brain-enriched miRNAs. TaqMan qPCR for brain-enriched miR-347 and miR-151 was performed in Ago2 immunoprecipitated (IP) or non-immune mouse IgG immunoprecipitated samples from dentate gyrus. Values are means (+s.e.m.; n = 3) expressed as fold enrichment in the Ago2 IP relative to IgG IP. (B) Ago2 immunoblots following immunoprecipitation of dentate gyrus (DG) samples with Ago2 antibody or non-immune mouse IgG. A band at ~97 kDa corresponding to Ago2 was detected in Ago2, but not IgG, IP. As a positive control, HEK293 cells were transfected with GFP-Ago2. Endogenous Ago2 protein (lower band) and GFP-Ago2 fusion protein (arrow; band at ~127 kDa) were detected in transfected cells.
Figure 2
Figure 2
Modulation of miRNA expression in total lysates and Ago2 immunoprecipitates following LTP induction. (A) Time course plot showing changes in the medial perforant path-evoked fEPSP slope expressed as a percentage of baseline. Values are mean ± s.e.m. (n = 3). Dentate gyrus tissue was obtained at 30 or 120 min post-HFS. (B–E) miRNA PCR cards from Exiqon were used to screen 373 miRNAs in total lysates (input) and Ago2 immunoprecipitates following high-frequency stimulation (HFS). Data for input and Ago2 IP samples for each time point were normalized to the respective global mean of all miRNAs expressed on the card. Values are mean (+s.e.m.) changes in HFS-treated dentate gyrus relative to the contralateral control (n = 3). Values are significantly different from control (Student's t-test with Dunn–Bonferroni correction, p < 0.05). (B) Fold change in miRNA expression in dentate gyrus input at 30 min post-HFS. (C) Fold change in miRNA expression in dentate gyrus input at 120 min post-HFS. (D) Fold change in miRNA expression in dentate gyrus Ago2 immunoprecipitate at 30 min post-HFS. (E) Fold change in miRNA expression in dentate gyrus Ago2 immunoprecipitates at 120 min post-HFS.
Figure 3
Figure 3
Differential expression of Ago2-associated and total miRNAs linked to NMDA receptor-dependent LTP induction. (A) Time course plot showing changes in the medial perforant path-evoked fEPSP slope expressed as a percentage of baseline. Values are mean (±s.e.m.). HFS + LFT, n = 6; AP5 + HFS + LFT, n = 4; LFT, n = 3. Dentate gyrus tissue was obtained at 30 min. (B) Quantitative PCR was used to validate the expression of Arc mRNA. Changes in Arc mRNA levels in the treated and contralateral control dentate gyrus lysate samples were analyzed. The PCR data was normalized to the expression of Ubiquitin-B using the ΔCt method. Values are mean (+s.e.m.). HFS + LFT, n = 6; AP5 + HFS + LFT, n = 4; LFT, n = 3: AP5 + LFT, n = 5. (C–E) Quantitative TaqMan PCR was used for independent analysis of 10 selected miRNAs from the PCR card screen. The same set of miRNAs were analyzed in the input sample (C) and Ago2-immunoprecipitate (D). qPCR data was normalized to expression of miR-345-3p. (C) Fold change in miRNA expression in dentate gyrus input samples at 30 min. Bar graph shows mean fold change (+s.e.m.) in treated dentate gyrus relative to control, contralateral dentate gyrus. Significant differences between the HFS group and other treatment groups are indicated (#; p < 0.05). Significant difference between the ispilateral (treated) and contralateral (control) dentate gyrus are indicated (*). HFS + LFT, n = 6; AP5 + HFS + LFT, n = 4; LFT alone, n = 5; AP5 + LFT, n = 5. (D) Fold change in miRNA expression in dentate gyrus Ago2 immunoprecipitates at 30 min post-HFS. Significant differences between the HFS group and other treatment groups are indicated (#; p < 0.05). Significant difference between the ispilateral (treated) and contralateral (control) dentate gyrus are indicated (*). (E) Relative fold change in miRNA expression in dentate gyrus Ago2 immunoprecipitates compared to dentate gyrus lysates (Ago2/input expression ratios) at 30 min post-HFS. Bar graph shows relative fold change in treated dentate gyrus relative to control, contralateral dentate gyrus. Significant differences between the HFS group and other treatment groups are indicated (#; p < 0.05). Significant difference between the ispilateral (treated) and contralateral (control) dentate gyrus are indicated (*).
Figure 4
Figure 4
Regulation of Arc-targeting miRNAs in LTP. Quantitative PCR was used to examine the expression of a set of 3 Arc-associated miRNAs at 30 min. The same set of miRNAs were analyzed in the input sample (A) and Ago2 immunoprecipitate (B). The qPCR data was normalized to the expression of miR-345-3p. (A) Fold change in Arc-associated miRNA expression in dentate gyrus lysates at 30 min post-HFS. Bar graph shows mean fold change (+s.e.m.) in treated dentate gyrus relative to control, contralateral dentate gyrus. HFS + LFT, n = 6; AP5 + HFS + LFT, n = 4; LFT alone, n = 5; AP5 + LFT, n = 5. Significant differences between the HFS group and other treatment groups are indicated (#; p < 0.05). Significant difference between the ispilateral (treated) and contralateral (control) dentate gyrus are indicated (*). (B) Fold change in Arc-associated miRNA expression in dentate gyrus Ago2 immunoprecipitates at 30 min post-HFS. Significant differences between the HFS group and other treatment groups are indicated (#; p < 0.05). Significant difference between the ispilateral (treated) and contralateral (control) dentate gyrus are indicated (*). (C) Relative fold change in Arc-associated miRNA expression in dentate gyrus Ago2 immunoprecipitates compared to dentate gyrus lysates (Ago2/input expression ratios) at 30 min post-HFS. Significant differences between the HFS group and other treatment groups are indicated (#; p < 0.05). Significant difference between the ispilateral (treated) and contralateral (control) dentate gyrus are indicated (*).
Figure 5
Figure 5
Stable expression of Argonaute 2 protein during LTP. (A) Immunoprecipitation of Ago2 30 and 120 min post-HFS. Representative immunoblot of Ago2 expression levels in input, Ago2 immunoprecipitate (Ago2 IP), and unbound fraction. (B) Bar graph shows mean % change (+s.e.m.) in Ago2 levels in input and Ago2-IP samples of treated dentate gyrus relative to the contralateral citation(untreated) dentate gyrus (n = 17).
Figure 6
Figure 6
Axon navigation pathway targeting by miRNAs that differentially associate with Ago2 in an activity-dependent manner. Genes targeted by miRNAs that differentially associate with Ago2 in an activity-dependent manner are color coded by whether they are targeted by enhanced (green box), depleted (red box), or by both enhanced and depleted miRNAs (brown box). The involvement of all four guidance molecule families and their convergence on signal transduction systems classically associated with activity-dependent synaptic plasticity suggests an important role for these receptor mediated signaling pathways in plasticity.

References

    1. Ashraf S. I., McLoon A. L., Sclarsic S. M., Kunes S. (2006). Synaptic protein synthesis associated with memory is regulated by the RISC pathway in Drosophila. Cell 124, 191–205 10.1016/j.cell.2005.12.017 - DOI - PubMed
    1. Banerjee S., Neveu P., Kosik K. S. (2009). A coordinated local translational control point at the synapse involving relief from silencing and MOV10 degradation. Neuron 64, 871–884 10.1016/j.neuron.2009.11.023 - DOI - PubMed
    1. Bartel D. P. (2004). MicroRNAs: genomics, biogenesis, mechanism, and function. Cell 116, 281–297 10.1016/S0092-8674(04)00045-5 - DOI - PubMed
    1. Bayat M., Baluchnejadmojarad T., Roghani M., Goshadrou F., Ronaghi A., Mehdizadeh M. (2012). Netrin-1 improves spatial memory and synaptic plasticity impairment following global ischemia in the rat. Brain Res. 1452, 185–194 10.1016/j.brainres.2012.03.008 - DOI - PubMed
    1. Béthune J., Artus-Revel C. G., Filipowicz W. (2012). Kinetic analysis reveals successive steps leading to miRNA-mediated silencing in mammalian cells. EMBO Rep. 13, 716–723 10.1038/embor.2012.82 - DOI - PMC - PubMed