

Could magnetic resonance provide in vivo histology?
- PMID: 24454320
- PMCID: PMC3888945
- DOI: 10.3389/fgene.2013.00298
Could magnetic resonance provide in vivo histology?
Abstract
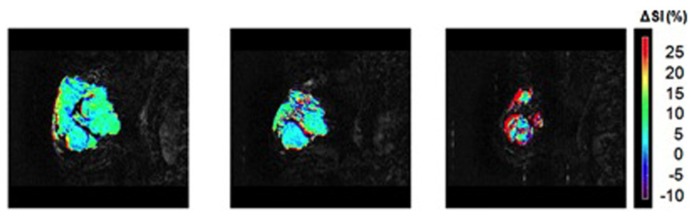
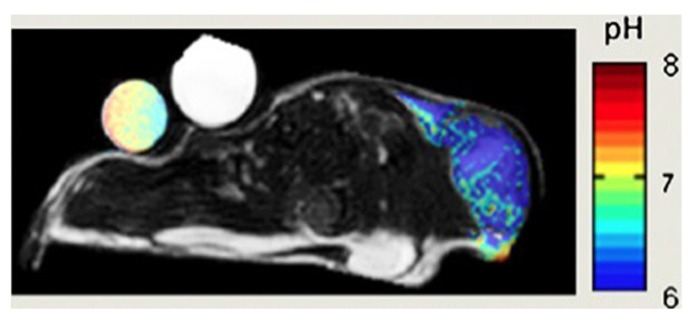
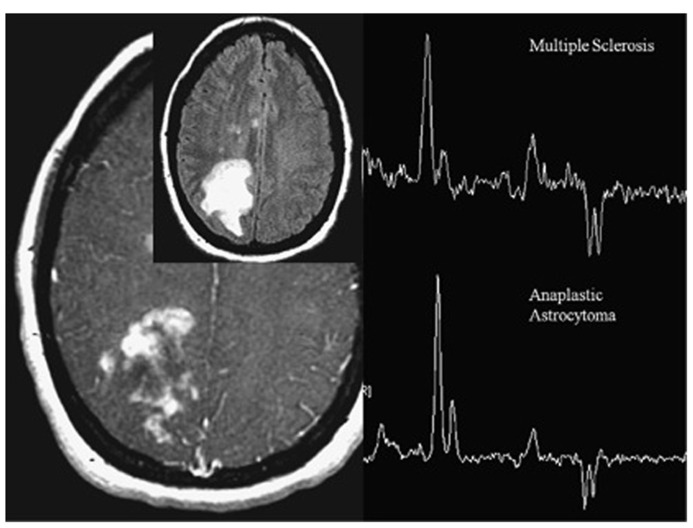
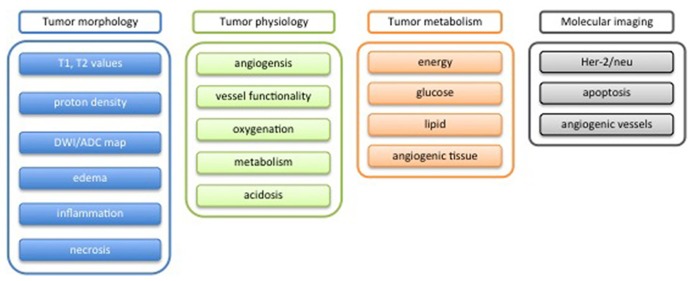
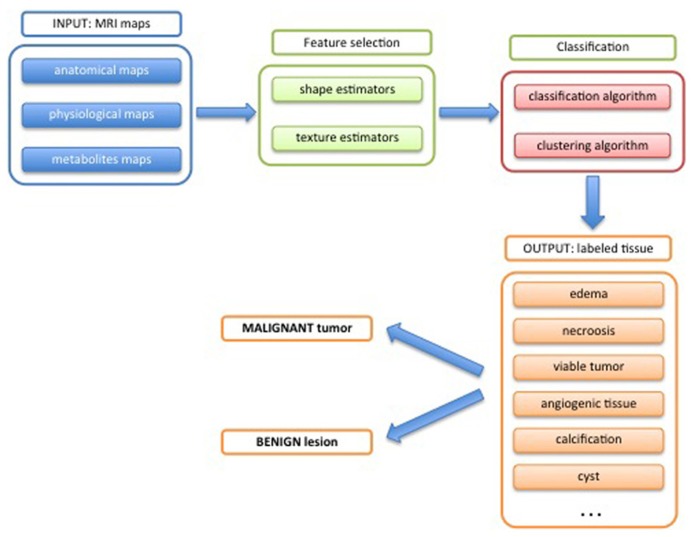
THE DIAGNOSIS OF A SUSPECTED TUMOR LESION FACES TWO BASIC PROBLEMS: detection and identification of the specific type of tumor. Radiological techniques are commonly used for the detection and localization of solid tumors. Prerequisite is a high intrinsic or enhanced contrast between normal and neoplastic tissue. Identification of the tumor type is still based on histological analysis. The result depends critically on the sampling sites, which given the inherent heterogeneity of tumors, constitutes a major limitation. Non-invasive in vivo imaging might overcome this limitation providing comprehensive three-dimensional morphological, physiological, and metabolic information as well as the possibility for longitudinal studies. In this context, magnetic resonance based techniques are quite attractive since offer at the same time high spatial resolution, unique soft tissue contrast, good temporal resolution to study dynamic processes and high chemical specificity. The goal of this paper is to review the role of magnetic resonance techniques in characterizing tumor tissue in vivo both at morphological and physiological levels. The first part of this review covers methods, which provide information on specific aspects of tumor phenotypes, considered as indicators of malignancy. These comprise measurements of the inflammatory status, neo-vascular physiology, acidosis, tumor oxygenation, and metabolism together with tissue morphology. Even if the spatial resolution is not sufficient to characterize the tumor phenotype at a cellular level, this multiparametric information might potentially be used for classification of tumors. The second part discusses mathematical tools, which allow characterizing tissue based on the acquired three-dimensional data set. In particular, methods addressing tumor heterogeneity will be highlighted. Finally, we address the potential and limitation of using MRI as a tool to provide in vivo tissue characterization.
Keywords: MRI; classification; histology; in vivo; metabolism; physiology; tissue; tumor.
Figures
Similar articles
-
More advantages in detecting bone and soft tissue metastases from prostate cancer using 18F-PSMA PET/CT.Hell J Nucl Med. 2019 Jan-Apr;22(1):6-9. doi: 10.1967/s002449910952. Epub 2019 Mar 7. Hell J Nucl Med. 2019. PMID: 30843003
-
Quantitative Clinical Imaging Methods for Monitoring Intratumoral Evolution.Methods Mol Biol. 2017;1513:61-81. doi: 10.1007/978-1-4939-6539-7_6. Methods Mol Biol. 2017. PMID: 27807831 Review.
-
Magnetic resonance spectroscopy and imaging on fresh human brain tumor biopsies at microscopic resolution.Anal Bioanal Chem. 2015 Sep;407(22):6771-80. doi: 10.1007/s00216-015-8847-3. Epub 2015 Jun 30. Anal Bioanal Chem. 2015. PMID: 26123440
-
Added-value of advanced magnetic resonance imaging to conventional morphologic analysis for the differentiation between benign and malignant non-fatty soft-tissue tumors.Eur Radiol. 2021 Mar;31(3):1536-1547. doi: 10.1007/s00330-020-07190-0. Epub 2020 Sep 3. Eur Radiol. 2021. PMID: 32885297
-
Magnetic resonance spectroscopic imaging of tumor metabolic markers for cancer diagnosis, metabolic phenotyping, and characterization of tumor microenvironment.Dis Markers. 2003-2004;19(2-3):69-94. doi: 10.1155/2004/424395. Dis Markers. 2003. PMID: 15096706 Free PMC article. Review.
Cited by
-
In vivo analysis of lung cancer metabolism: nothing like the real thing.J Clin Invest. 2015 Feb;125(2):495-7. doi: 10.1172/JCI79188. Epub 2015 Jan 20. J Clin Invest. 2015. PMID: 25607834 Free PMC article.
-
Multiparametric MR for non-invasive evaluation of tumour tissue histological characteristics after radionuclide therapy.NMR Biomed. 2019 Mar;32(3):e4060. doi: 10.1002/nbm.4060. Epub 2019 Jan 28. NMR Biomed. 2019. PMID: 30693592 Free PMC article.
-
Quantification of antiangiogenic treatment effects on tissue heterogeneity in glioma tumour xenograft model using a combination of DCE-MRI and 3D-ultramicroscopy.Eur Radiol. 2017 Jul;27(7):2894-2902. doi: 10.1007/s00330-016-4629-3. Epub 2016 Nov 9. Eur Radiol. 2017. PMID: 27830379
-
Microvascular MRI and unsupervised clustering yields histology-resembling images in two rat models of glioma.J Cereb Blood Flow Metab. 2014 Aug;34(8):1354-62. doi: 10.1038/jcbfm.2014.90. Epub 2014 May 21. J Cereb Blood Flow Metab. 2014. PMID: 24849664 Free PMC article.
-
The value of advanced MRI techniques in the assessment of cervical cancer: a review.Insights Imaging. 2017 Oct;8(5):471-481. doi: 10.1007/s13244-017-0567-0. Epub 2017 Aug 21. Insights Imaging. 2017. PMID: 28828723 Free PMC article. Review.
References
-
- Arizmendi C., Vellido A., Romero E. (2012). Classification of human brain tumours from MRS data using discrete wavelet transform and Bayesian neural networks. Expert Syst. Appl. 39 5223–5232 10.1016/j.eswa.2011.11.017 - DOI
Publication types
LinkOut - more resources
Full Text Sources
Other Literature Sources
Research Materials