

Plastic and evolutionary responses to climate change in fish
- PMID: 24454549
- PMCID: PMC3894899
- DOI: 10.1111/eva.12135
Plastic and evolutionary responses to climate change in fish
Abstract
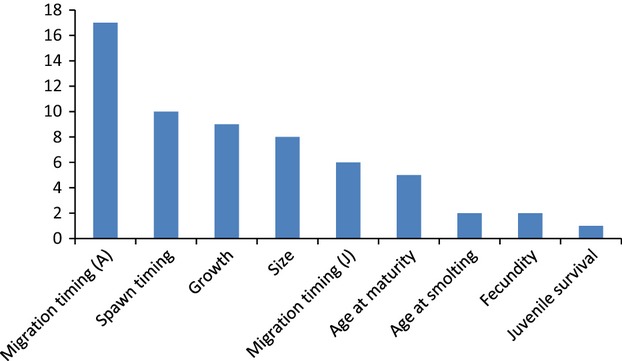
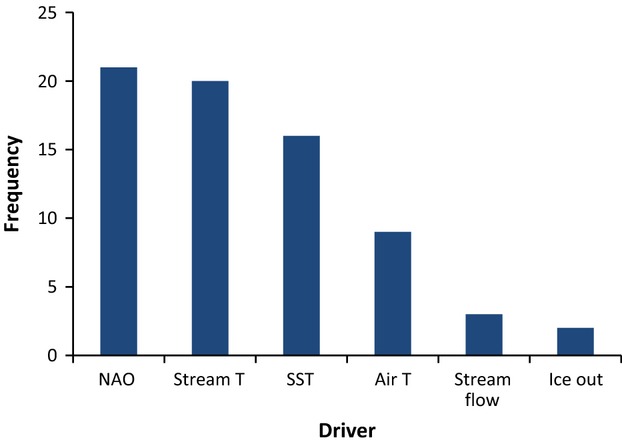
The physical and ecological 'fingerprints' of anthropogenic climate change over the past century are now well documented in many environments and taxa. We reviewed the evidence for phenotypic responses to recent climate change in fish. Changes in the timing of migration and reproduction, age at maturity, age at juvenile migration, growth, survival and fecundity were associated primarily with changes in temperature. Although these traits can evolve rapidly, only two studies attributed phenotypic changes formally to evolutionary mechanisms. The correlation-based methods most frequently employed point largely to 'fine-grained' population responses to environmental variability (i.e. rapid phenotypic changes relative to generation time), consistent with plastic mechanisms. Ultimately, many species will likely adapt to long-term warming trends overlaid on natural climate oscillations. Considering the strong plasticity in all traits studied, we recommend development and expanded use of methods capable of detecting evolutionary change, such as the long term study of selection coefficients and temporal shifts in reaction norms, and increased attention to forecasting adaptive change in response to the synergistic interactions of the multiple selection pressures likely to be associated with climate change.
Keywords: adaptation; climate change; evolutionary theory; fisheries management; life-history evolution; phenotypic plasticity.
Figures
References
-
- Ahas R, Aasa A. The effects of climate change on the phenology of selected Estonian plant, bird and fish populations. International Journal of Biometeorology. 2006;51:17–26. - PubMed
-
- Al-Chokhachy R, Alder J, Hostetler S, Gresswell R, Shepard B. Thermal controls of yellowstone cutthroat trout and invasive fishes under climate change. Global Change Biology. 2013;19:3069–3081. - PubMed
-
- Angilletta MJ. Thermal Adaptation: A Theoretical and Empirical Synthesis. Oxford: Oxford University Press; 2009.
-
- Anttila K, Dhillon RS, Boulding EG, Farrell AP, Glebe BD, Elliott JAK, Wolters WR, et al. Variation in temperature tolerance among families of Atlantic salmon (Salmo salar) is associated with hypoxia tolerance, ventricle size and myoglobin level. Journal of Experimental Biology. 2013;216:1183–1190. - PubMed
-
- Arismendi I, Johnson SL, Dunham JB, Haggerty R, Hockman-Wert D. The paradox of cooling streams in a warming world: regional climate trends do not parallel variable local trends in stream temperature in the Pacific continental United States. Geophysical Research Letters. 2012;39:L10401.
LinkOut - more resources
Full Text Sources
Other Literature Sources
Miscellaneous
