Life under flow: A novel microfluidic device for the assessment of anti-biofilm technologies
- PMID: 24454610
- PMCID: PMC3888455
- DOI: 10.1063/1.4850796
Life under flow: A novel microfluidic device for the assessment of anti-biofilm technologies
Abstract
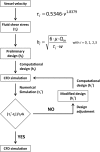
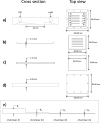
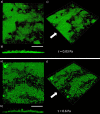
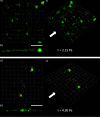
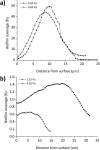
In the current study, we have developed and fabricated a novel lab-on-a-chip device for the investigation of biofilm responses, such as attachment kinetics and initial biofilm formation, to different hydrodynamic conditions. The microfluidic flow channels are designed using computational fluid dynamic simulations so as to have a pre-defined, homogeneous wall shear stress in the channels, ranging from 0.03 to 4.30 Pa, which are relevant to in-service conditions on a ship hull, as well as other man-made marine platforms. Temporal variations of biofilm formation in the microfluidic device were assessed using time-lapse microscopy, nucleic acid staining, and confocal laser scanning microscopy (CLSM). Differences in attachment kinetics were observed with increasing shear stress, i.e., with increasing shear stress there appeared to be a delay in bacterial attachment, i.e., at 55, 120, 150, and 155 min for 0.03, 0.60, 2.15, and 4.30 Pa, respectively. CLSM confirmed marked variations in colony architecture, i.e.,: (i) lower shear stresses resulted in biofilms with distinctive morphologies mainly characterised by mushroom-like structures, interstitial channels, and internal voids, and (ii) for the higher shear stresses compact clusters with large interspaces between them were formed. The key advantage of the developed microfluidic device is the combination of three architectural features in one device, i.e., an open-system design, channel replication, and multiple fully developed shear stresses.
Figures



Similar articles
-
Early biofilm and streamer formation is mediated by wall shear stress and surface wettability: A multifactorial microfluidic study.Microbiologyopen. 2022 Aug;11(4):e1310. doi: 10.1002/mbo3.1310. Microbiologyopen. 2022. PMID: 36031954 Free PMC article.
-
A Selection of Platforms to Evaluate Surface Adhesion and Biofilm Formation in Controlled Hydrodynamic Conditions.Microorganisms. 2021 Sep 21;9(9):1993. doi: 10.3390/microorganisms9091993. Microorganisms. 2021. PMID: 34576888 Free PMC article. Review.
-
A Microfluidic-Based Investigation of Bacterial Attachment in Ureteral Stents.Micromachines (Basel). 2020 Apr 13;11(4):408. doi: 10.3390/mi11040408. Micromachines (Basel). 2020. PMID: 32295085 Free PMC article.
-
The influence of flow cell geometry related shear stresses on the distribution, structure and susceptibility of Pseudomonas aeruginosa 01 biofilms.Biofouling. 2009 Nov;25(8):711-25. doi: 10.1080/08927010903114603. Biofouling. 2009. PMID: 20183130
-
Computational and Experimental Investigation of Biofilm Disruption Dynamics Induced by High-Velocity Gas Jet Impingement.mBio. 2020 Jan 7;11(1):e02813-19. doi: 10.1128/mBio.02813-19. mBio. 2020. PMID: 31911489 Free PMC article.
Cited by
-
The Flagellar Gene Regulates Biofilm Formation and Mussel Larval Settlement and Metamorphosis.Int J Mol Sci. 2020 Jan 21;21(3):710. doi: 10.3390/ijms21030710. Int J Mol Sci. 2020. PMID: 31973189 Free PMC article.
-
Bactericidal Efficacy of Nanostructured Surfaces Increases under Flow Conditions.ACS Omega. 2022 Nov 4;7(45):41711-41722. doi: 10.1021/acsomega.2c05828. eCollection 2022 Nov 15. ACS Omega. 2022. PMID: 36406483 Free PMC article.
-
Ultrasound-mediated therapies for the treatment of biofilms in chronic wounds: a review of present knowledge.Microb Biotechnol. 2020 May;13(3):613-628. doi: 10.1111/1751-7915.13471. Epub 2019 Aug 7. Microb Biotechnol. 2020. PMID: 32237219 Free PMC article. Review.
-
Monitoring bacterial biofilms with a microfluidic flow chip designed for imaging with white-light interferometry.Biomicrofluidics. 2017 Aug 18;11(4):044113. doi: 10.1063/1.4985773. eCollection 2017 Jul. Biomicrofluidics. 2017. PMID: 28868106 Free PMC article.
-
Bactericidal efficiency of micro- and nanostructured surfaces: a critical perspective.RSC Adv. 2021 Jan 13;11(3):1883-1900. doi: 10.1039/d0ra08878a. eCollection 2021 Jan 4. RSC Adv. 2021. PMID: 35424086 Free PMC article. Review.
References
-
- Howell D., in Advances in Marine Antifouling Coatings and Technologies, edited by Hellio C. and Yebra D. (Woodhead, Cambridge, UK, 2009).
-
- Lewthwaite J., Molland A., and Thomas K., Trans. RINA 126, 269–284 (1985).
-
- Bohlander G., Polym. Mar. Environ. 16, 1–4 (1991).
-
- Schultz M. and Swain G., J. Fluids Eng. 121, 733–746 (1999).10.1115/1.2822009 - DOI
LinkOut - more resources
Full Text Sources
Other Literature Sources
Miscellaneous
