. 2014 Jan 14;9(1):e84974.
doi: 10.1371/journal.pone.0084974. eCollection 2014.

Proteomic analysis of cellular response induced by multi-walled carbon nanotubes exposure in A549 cells

Affiliations

Proteomic analysis of cellular response induced by multi-walled carbon nanotubes exposure in A549 cells

Li Ju et al. PLoS One. .

Abstract

The wide application of multi-walled carbon nanotubes (MWCNT) has raised serious concerns about their safety on human health and the environment. However, the potential harmful effects of MWCNT remain unclear and contradictory. To clarify the potentially toxic effects of MWCNT and to elucidate the associated underlying mechanisms, the effects of MWCNT on human lung adenocarcinoma A549 cells were examined at both the cellular and the protein level. Cytotoxicity and genotoxicity were examined, followed by a proteomic analysis (2-DE coupled with LC-MS/MS) of the cellular response to MWCNT. Our results demonstrate that MWCNT induces cytotoxicity in A549 cells only at relatively high concentrations and longer exposure time. Within a relatively low dosage range (30 µg/ml) and short time period (24 h), MWCNT treatment does not induce significant cytotoxicity, cell cycle changes, apoptosis, or DNA damage. However, at these low doses and times, MWCNT treatment causes significant changes in protein expression. A total of 106 proteins show altered expression at various time points and dosages, and of these, 52 proteins were further identified by MS. Identified proteins are involved in several cellular processes including proliferation, stress, and cellular skeleton organization. In particular, MWCNT treatment causes increases in actin expression. This increase has the potential to contribute to increased migration capacity and may be mediated by reactive oxygen species (ROS).


Conflict of interest statement

Competing Interests: The authors have declared that no competing interests exist.

Figures

Figure 1
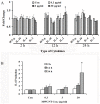
Figure 1. MWCNT induces cytotoxicity in A549 cells at high concentrations and longer exposure time.
A549 cells were seeded into 24-well plates (1×10⁴ cells/well) and treated with MWCNT (0.3, 3, 30 and 300 µg/ml) for 2, 12 and 24 h. Cell viability was determined using the trypan blue exclusion assay.
Figure 2
Figure 2. MWCNT causes apoptosis and cell cycle perturbation in A549 cells.
(A) Cells were incubated with 0.3, 3, 30 and 300 µg/ml MWCNT for 24 and 48 h, and then were stained with FITC-conjugated Annexin V and PI. The percentage of early stage apoptotic cells and total apoptotic cells were calculated. (B) Cells were incubated with 30 µg/ml MWCNT for 8, 16, 24, 48 and 72 h, and then were fixed and stained with PI. Cells in G1/G0, S and G2/M phases were counted. * p<0.05, compared with control.
Figure 3
Figure 3. MWCNT does not cause genotoxic injury to A549 cells.
(A) Following treatment with MWCNT at 0.3, 3 and 30 µg/ml for 2, 12 and 24 h, cells were fixed and stained with anti-γH2AX antibody, then subjected to immunofluorescent microscopy. Blue, Hoechst3358 stain for nuclei; Green, γH2AX. (B) Cells were treated with MWCNT for 24 h at 0.3, 3 and 30 µg/ml, and then subjected to the comet assay detection. The nucleus was stained with gel-red. 10 µM cisplatin (Pt) treated cells were used as a positive control.
Figure 4
Figure 4. Treatment with MWCNT significantly changes protein expression.
Protein extracts (200 µg) were separated on a pH 3–10, 24 cm IPG strip, followed by 12% SDS-PAGE. Proteins spots were visualized by silver staining. Shown are representative 2-DE proteomic maps of A549 cells treated with MWCNT at the indicated concentrations (a, 0.3; b, 3; c, 30 µg/ml) for various time periods (A, 2 h; B, 12 h; C, 24 h). Arrows indicate the spots identified by MS (↑up-regulated protein, down-regulated protein), and details of the corresponding spots are listed in Table 2. The location (D) and function classification (E) of identified proteins are shown in the pie charts.
Figure 5
Figure 5. MWCNT treatment decreases 14-3-3ε and HSP27 expression.
(A) Enlarged 2-DE images of spot 0306 (left panel) and spot 2203 (right panel), which were down-regulated in MWCNT-treated A549 cells; (B) Western blot results for 14-3-3ε (left panel)/HSP27 (right panel) expression in A549 cells treated with 0.3, 3 and 30 µg/ml for 2 h/24 h; (C) Densitometry analysis of (B). GAPDH was used as a loading control. * p<0.05.
Figure 6
Figure 6. MWCNT treatment increases actin expression.
(A) Enlarged 2-DE images of spot 4507, which was up-regulated in MWCNT-treated A549 cells. (B) Western blot results for actin expression in A549 cells treated with 0.3, 3 and 30 µg/ml for 24 h. (C) Densitometry analysis of (B). GAPDH was used as a loading control, * p<0.05. (D) Immunofluorescence microscopic analysis of actin expression after MWCNT treatment. After treatment with MWCNT at 0.3, 3 and 30 µg/ml for 2, 12 and 24 h, cells were fixed and stained with phalloidin, then subjected to immunofluorescence microscopy. Shown are representative images from one of three independent experiments. Blue, Hoechst3358 stain for nuclei. Red, Actin. 10 µM Pt was used as a positive control. (E) Semi-quantification data of the average fluorescent intensity. * p<0.05, compared to control.
Figure 7
Figure 7. MWCNT induces the generation of cellular reactive oxygen species (ROS).
(A) Cells were exposed to 0.3, 3 and 30 µg/ml MWCNT for 2, 12 and 24 h, and ROS generation was measured using MitoSOX™ Red mitochondrial superoxide indicator by Immunofluorescence microscopy. (B) Cells were exposed to the indicated concentrations of MWCNT for various times, and ROS generation was measured using 2′,7′-dichlorofluorescin diacetate (DCFH-DA) using a spectrofluorometer. ROS generation was expressed as fold increase of fluorescence compared to the control; * p<0.05, compared to PBS treated control. (C) Cells were pretreated with NAC (10 mM) for 2 h, and then exposed to 30 µg/ml of MWNCT for 24 h. * p<0.05, compared with the control. # p<0.05, compared to MWCNT treatment without NAC pre-incubation.
Figure 8
Figure 8. Inhibition of ROS generation attenuates actin expression in MWCNT-treated A549 cells.
After MWCNT treatment, cells were fixed and stained with phalloidin, and then subjected to immunofluorescent microscopy. (A) Control; (B) Cells treated with 30 µg/ml of MWNCT for 24 h; (C) Cells treated with NAC (10 mM, 2 h) followed by 30 µg/ml of MWNCT for 24 h; (D) Quantitative analysis of average fluorescent intensity of the above images. * p<0.05, compared with the control; # p<0.05, compared with MWCNT treatment cells.
Figure 9
Figure 9. MWNCT leads to increased cell migration.
A549 cells were grown to confluence, scratched, and allowed to recover for 24(A) Control; (B) 30 µg/ml MWCNT exposure; (C) Cells treated with NAC (10 mM, 2 h) followed by 30 µg/ml of MWNCT for 24 h. Shown were representative images from three independent experiments. Scale bar = 50 µm. (D) The distances of migrating cells were determined and data were presented as mean ± SD. * p<0.05 versus control, # p<0.05 versus MWCNT treated cells.
Figure 10
Figure 10. Effects of MWCNT exposure on the expression of Th1/Th2 cytokines.
Following treatment with MWCNT at 0.3, 3 and 30 µg/ml for 2, 12 and 24 h, the supernatants of A549 cells were collected and detected using a Human Th1/Th2 Cytokine Kit II by flow cytometry. Shown are expression levels of IFN-γ, IL-10, IL-4, IL-2 (A) and IL-6 (B).

Similar articles

Cited by

References

    1. Tretyakov YD, Goodilin EA (2009) Key trends in basic and application-oriented research on nanomaterials. Russ Chem Rev 78: 801–820 10.1070/RC2009v078n09ABEH004029 - DOI
    1. He L, Toh CS (2006) Recent advances in analytical chemistry–a material approach. Anal Chim Acta 556: 1–15. PubMed: 17723326. - PubMed
    1. Iijima S (1991) Helical microtubules of graphitic carbon. Nature 354: 56–58 10.1038/354056a0 - DOI
    1. Murr LE, Bang JJ, Esquivel PA, Guerrero PA, Lopez DA (2004) Carbon nanotubes, nanocrystal forms and complex nanoparticle aggregates in common fuel-gas combustion source and ambient air. J Nanoparticle Res 6: 241–251.
    1. Endo M (1988) Grow carbon fibers in the vapor phase. Chem Tech 18: 568–576.

Publication types

LinkOut - more resources