

The MoxR ATPase RavA and its cofactor ViaA interact with the NADH:ubiquinone oxidoreductase I in Escherichia coli
- PMID: 24454883
- PMCID: PMC3893208
- DOI: 10.1371/journal.pone.0085529
The MoxR ATPase RavA and its cofactor ViaA interact with the NADH:ubiquinone oxidoreductase I in Escherichia coli
Abstract
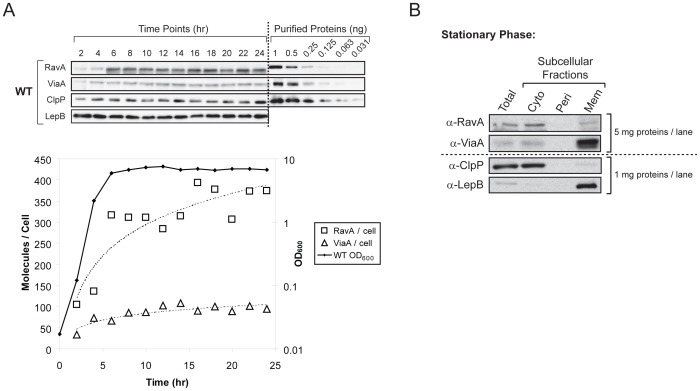
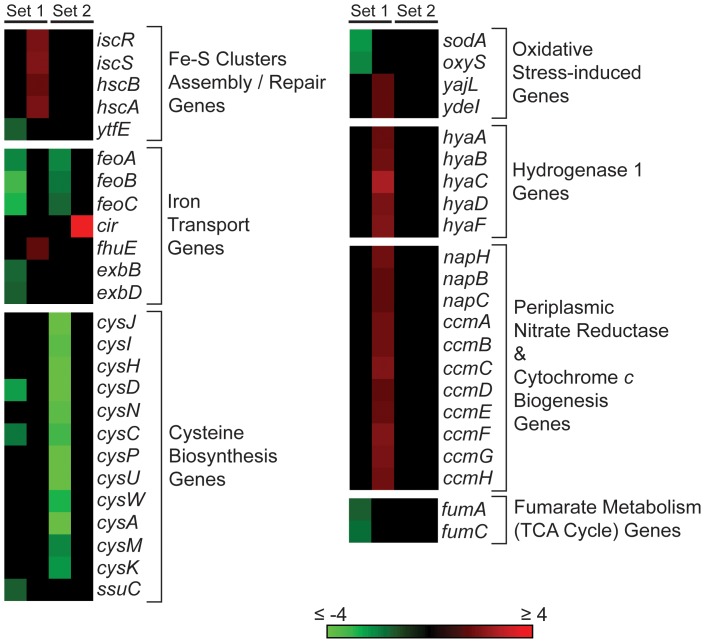
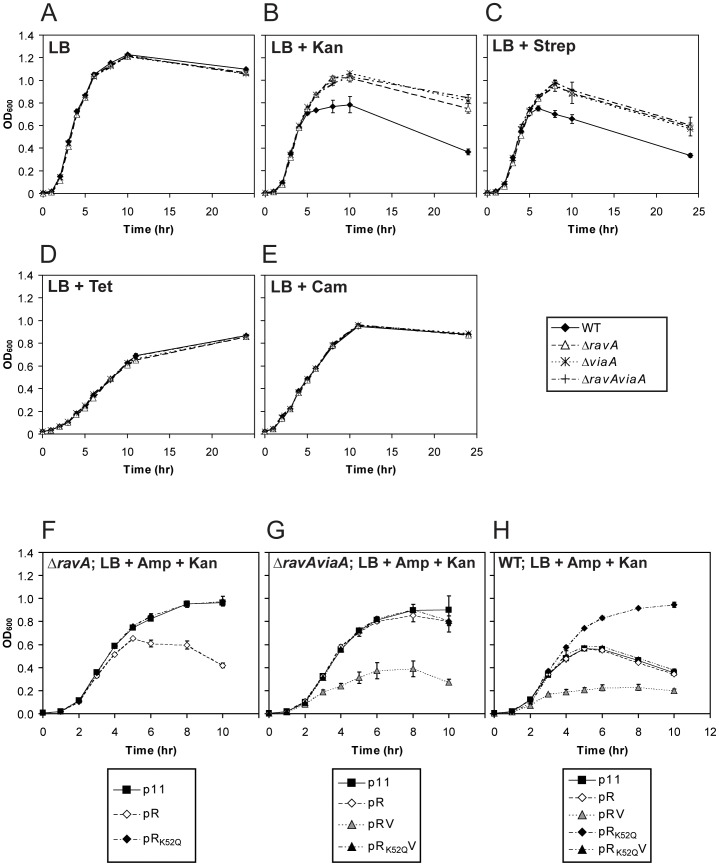
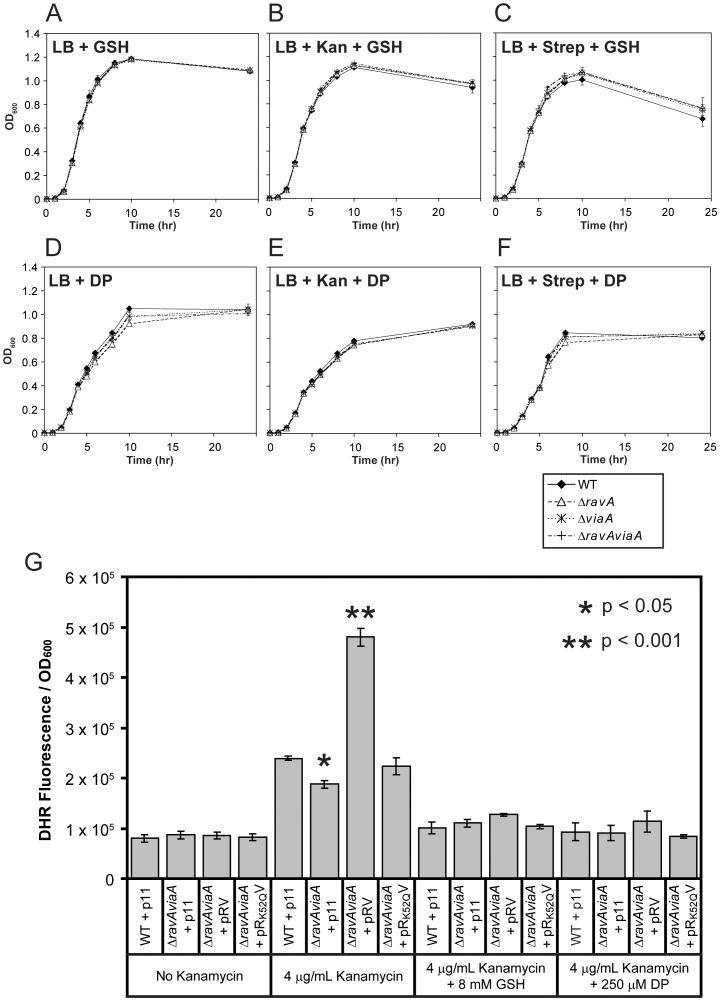
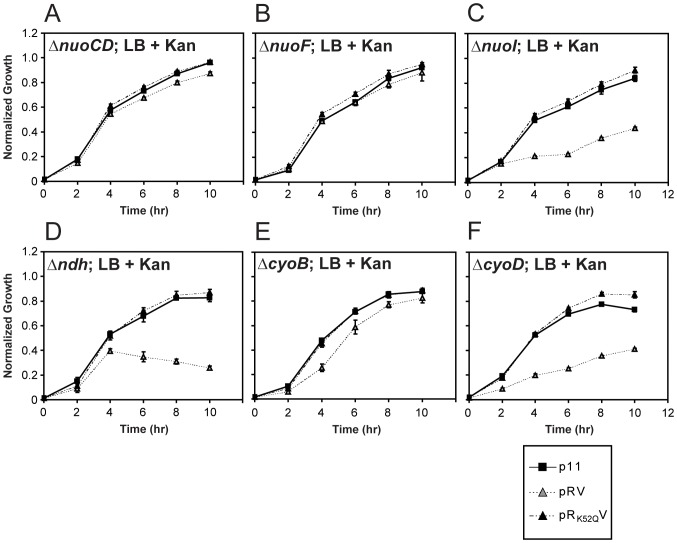
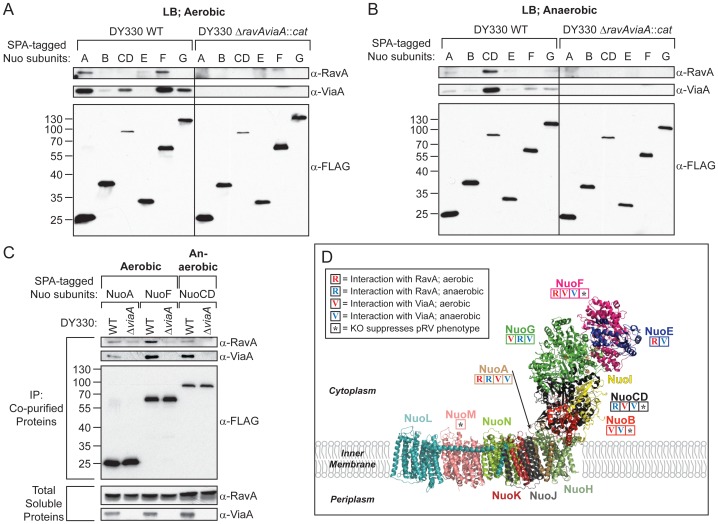
MoxR ATPases are widespread throughout bacteria and archaea. The experimental evidence to date suggests that these proteins have chaperone-like roles in facilitating the maturation of dedicated protein complexes that are functionally diverse. In Escherichia coli, the MoxR ATPase RavA and its putative cofactor ViaA are found to exist in early stationary-phase cells at 37 °C at low levels of about 350 and 90 molecules per cell, respectively. Both proteins are predominantly localized to the cytoplasm, but ViaA was also unexpectedly found to localize to the cell membrane. Whole genome microarrays and synthetic lethality studies both indicated that RavA-ViaA are genetically linked to Fe-S cluster assembly and specific respiratory pathways. Systematic analysis of mutant strains of ravA and viaA indicated that RavA-ViaA sensitizes cells to sublethal concentrations of aminoglycosides. Furthermore, this effect was dependent on RavA's ATPase activity, and on the presence of specific subunits of NADH:ubiquinone oxidoreductase I (Nuo Complex, or Complex I). Importantly, both RavA and ViaA were found to physically interact with specific Nuo subunits. We propose that RavA-ViaA facilitate the maturation of the Nuo complex.
Conflict of interest statement
Figures
Similar articles
-
The RavA-ViaA chaperone complex modulates bacterial persistence through its association with the fumarate reductase enzyme.J Biol Chem. 2023 Oct;299(10):105199. doi: 10.1016/j.jbc.2023.105199. Epub 2023 Sep 3. J Biol Chem. 2023. PMID: 37660904 Free PMC article.
-
The RavA-ViaA Chaperone-Like System Interacts with and Modulates the Activity of the Fumarate Reductase Respiratory Complex.J Mol Biol. 2017 Jan 20;429(2):324-344. doi: 10.1016/j.jmb.2016.12.008. Epub 2016 Dec 12. J Mol Biol. 2017. PMID: 27979649
-
Bioenergetic State of Escherichia coli Controls Aminoglycoside Susceptibility.mBio. 2023 Feb 28;14(1):e0330222. doi: 10.1128/mbio.03302-22. Epub 2023 Jan 10. mBio. 2023. PMID: 36625597 Free PMC article.
-
Assembly of the Escherichia coli NADH:ubiquinone oxidoreductase (respiratory complex I).Biochim Biophys Acta. 2016 Mar;1857(3):214-23. doi: 10.1016/j.bbabio.2015.12.004. Epub 2015 Dec 9. Biochim Biophys Acta. 2016. PMID: 26682761 Review.
-
Assembly of the Escherichia coli NADH:ubiquinone oxidoreductase (complex I).Biochim Biophys Acta. 2008 Jul-Aug;1777(7-8):735-9. doi: 10.1016/j.bbabio.2008.03.003. Epub 2008 Mar 15. Biochim Biophys Acta. 2008. PMID: 18394423 Review.
Cited by
-
Structural Characterization of a Newly Identified Component of α-Carboxysomes: The AAA+ Domain Protein CsoCbbQ.Sci Rep. 2015 Nov 5;5:16243. doi: 10.1038/srep16243. Sci Rep. 2015. PMID: 26538283 Free PMC article.
-
Insertion of the FeB cofactor in cNORs lacking metal inserting chaperones.FEBS Lett. 2025 May;599(9):1269-1284. doi: 10.1002/1873-3468.70007. Epub 2025 Feb 10. FEBS Lett. 2025. PMID: 39927524 Free PMC article.
-
Structural insights into ATP hydrolysis by the MoxR ATPase RavA and the LdcI-RavA cage-like complex.Commun Biol. 2020 Jan 28;3(1):46. doi: 10.1038/s42003-020-0772-0. Commun Biol. 2020. PMID: 31992852 Free PMC article.
-
Mycobacterium tuberculosis protein MoxR1 enhances virulence by inhibiting host cell death pathways and disrupting cellular bioenergetics.Virulence. 2023 Dec;14(1):2180230. doi: 10.1080/21505594.2023.2180230. Virulence. 2023. PMID: 36799069 Free PMC article.
-
Mutations in respiratory complex I promote antibiotic persistence through alterations in intracellular acidity and protein synthesis.Nat Commun. 2022 Jan 27;13(1):546. doi: 10.1038/s41467-022-28141-x. Nat Commun. 2022. PMID: 35087069 Free PMC article.
References
-
- Snider J, Houry WA (2006) MoxR AAA+ ATPases: a novel family of molecular chaperones? J Struct Biol 156: 200–209. - PubMed
-
- Wong KS, Houry WA (2012) Novel structural and functional insights into the MoxR family of AAA+ ATPases. J Struct Biol 179: 211–221. - PubMed
-
- Van Spanning RJ, Wansell CW, De Boer T, Hazelaar MJ, Anazawa H, et al. (1991) Isolation and characterization of the moxJ, moxG, moxI, and moxR genes of Paracoccus denitrificans: inactivation of moxJ, moxG, and moxR and the resultant effect on methylotrophic growth. J Bacteriol 173: 6948–6961. - PMC - PubMed
-
- Toyama H, Anthony C, Lidstrom ME (1998) Construction of insertion and deletion mxa mutants of Methylobacterium extorquens AM1 by electroporation. FEMS Microbiol Lett 166: 1–7. - PubMed
-
- Jungst A, Zumft WG (1992) Interdependence of Respiratory No Reduction and Nitrite Reduction Revealed by Mutagenesis of Nirq, a Novel Gene in the Denitrification Gene-Cluster of Pseudomonas-Stutzeri. FEBS Lett 314: 308–314. - PubMed
Publication types
MeSH terms
Substances
Grants and funding
LinkOut - more resources
Full Text Sources
Other Literature Sources
Molecular Biology Databases
Miscellaneous
