. 2014 Jan 15;9(1):e85813.
doi: 10.1371/journal.pone.0085813. eCollection 2014.

Imaging the directed transport of single engineered RNA transcripts in real-time using ratiometric bimolecular beacons

Affiliations

Imaging the directed transport of single engineered RNA transcripts in real-time using ratiometric bimolecular beacons

Xuemei Zhang et al. PLoS One. .

Abstract

The relationship between RNA expression and cell function can often be difficult to decipher due to the presence of both temporal and sub-cellular processing of RNA. These intricacies of RNA regulation can often be overlooked when only acquiring global measurements of RNA expression. This has led to development of several tools that allow for the real-time imaging of individual engineered RNA transcripts in living cells. Here, we describe a new technique that utilizes an oligonucleotide-based probe, ratiometric bimolecular beacon (RBMB), to image RNA transcripts that were engineered to contain 96-tandem repeats of the RBMB target sequence in the 3'-untranslated region. Binding of RBMBs to the target RNA resulted in discrete bright fluorescent spots, representing individual transcripts, that could be imaged in real-time. Since RBMBs are a synthetic probe, the use of photostable, bright, and red-shifted fluorophores led to a high signal-to-background. RNA motion was readily characterized by both mean squared displacement and moment scaling spectrum analyses. These analyses revealed clear examples of directed, Brownian, and subdiffusive movements.


Conflict of interest statement

Competing Interests: The authors have the following interests. Dr. Mark Behlke and Dr. Ling Huang are employed by Integrated DNA Technologies, Inc. (IDT). IDT offers oligonucleotides for sale similar to some of the compounds described in the manuscript. IDT is, however, not a publicly traded company and they personally do not own any shares/equity in IDT. Dr. Andrew Tsourkas is an inventor on a pending patent application on ratiometric bimolecular beacons. There are no further patents, products in development or marketed products to declare. This does not alter the authors' adherence to all the PLOS ONE policies on sharing data and materials, as detailed online in the guide for authors. The information for the pending patent application is: Novel Molecular Beacons, 2009 Andrew Tsourkas and Antony Chen US Application Number: 61/243,586.

Figures

Figure 1
Figure 1. Schematic of RBMBs and the methodology used to detect individual RNA transcripts in living cells.
(A) RBMBs are hairpin-forming oligonucleotide probes that are labeled with a reporter dye, quencher, and reference dye. The close proximity of the reporter dye and quencher in the absence of target RNA results in a low fluorescent state. Upon hybridization to complementary RNA, the fluorescent dye and quencher are forced apart, resulting in the restoration of fluorescence. The reference dye remains unquenched regardless of the conformation of the RBMB. The double-stranded domain with a 3′-UU overhang drives nuclear export. (B) To detect individual RNA transcripts, cells were engineered to stably express RNA with 96-tandem repeats of the RBMB target site in the 3′-untranslated region. Binding of up to 96 RBMBs to each RNA transcript results in discrete bright fluorescent spots that can be readily visualized and tracked in real-time by wide-field fluorescence microscopy.
Figure 2
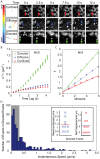
Figure 2. Analysis of RNA motion in living cells.
(A) Montage of RNA transcripts classified as confined, diffusive or directed based on mean squared displacement analysis (MSD) analysis. The trajectories (far left) for the transcripts that are indicated by the arrows are color-coded for time/frames. Scale bar: 2 µm. The motion of RNA transcripts was assessed using (B) MSD analysis and (C) motion scaling spectrum (MSS) analysis. The MSD and MSS plots represent 10 tracks per category (mean ± SEM). (D) Analysis of the speed and distance covered by directed particles. After smoothing the position over 5 frames, the instantaneous frame-to-frame velocity was calculated for all directed tracks (N = 10). A histogram of the speed distribution for all tracks is shown with a gray bar indicating speeds below our resolution limit. The inset shows the maximum speed achieved in each directed track (mean = red line, 1.4 µm/s), and the net displacement per track (mean = blue line, 7 µm).

Similar articles

Cited by

References

    1. Tyagi S (2009) Imaging intracellular RNA distribution and dynamics in living cells. Nat Methods 6: 331–338. - PubMed
    1. Ainger K, Avossa D, Morgan F, Hill SJ, Barry C, et al. (1993) Transport and localization of exogenous myelin basic protein mRNA microinjected into oligodendrocytes. J Cell Biol 123: 431–441. - PMC - PubMed
    1. Cha BJ, Koppetsch BS, Theurkauf WE (2001) In vivo analysis of Drosophila bicoid mRNA localization reveals a novel microtubule-dependent axis specification pathway. Cell 106: 35–46. - PubMed
    1. Shan J, Munro TP, Barbarese E, Carson JH, Smith R (2003) A molecular mechanism for mRNA trafficking in neuronal dendrites. J Neurosci 23: 8859–8866. - PMC - PubMed
    1. Ishihama Y, Funatsu T (2009) Single molecule tracking of quantum dot-labeled mRNAs in a cell nucleus. Biochem Biophys Res Commun 381: 33–38. - PubMed

Publication types

LinkOut - more resources