

Using environmental DNA to census marine fishes in a large mesocosm
- PMID: 24454960
- PMCID: PMC3893283
- DOI: 10.1371/journal.pone.0086175
Using environmental DNA to census marine fishes in a large mesocosm
Abstract
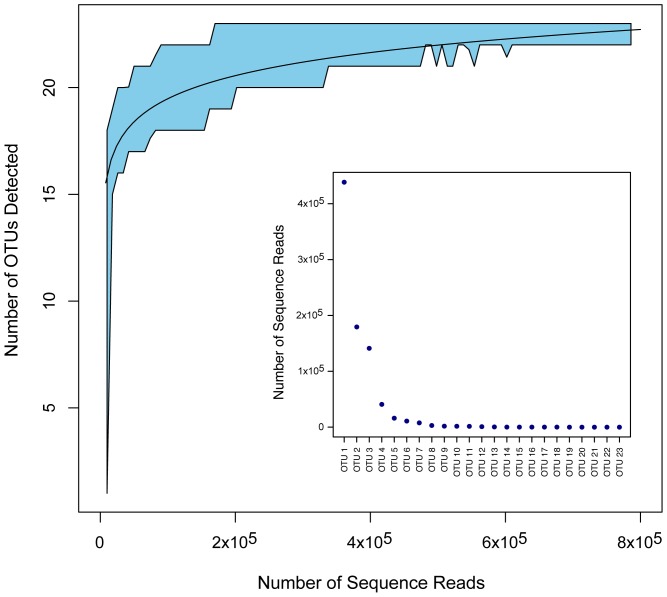
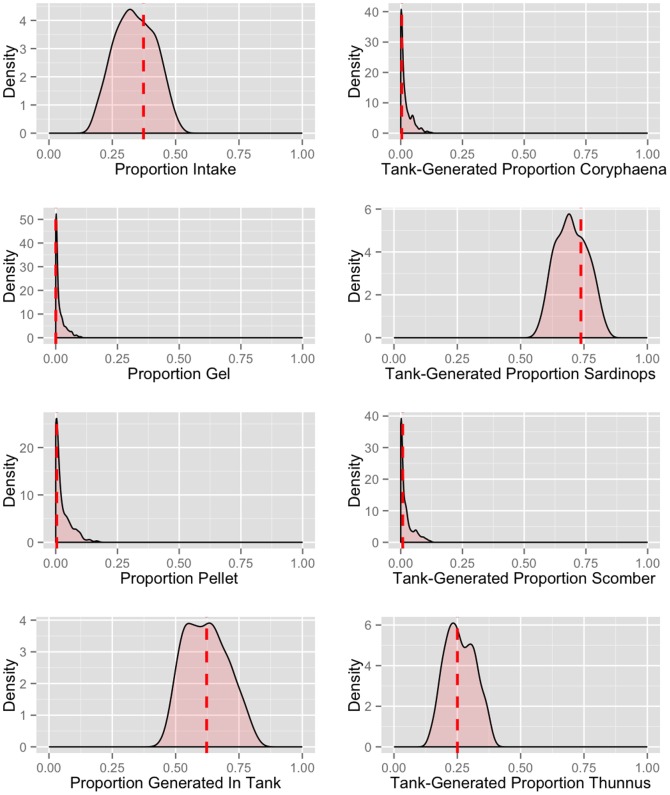
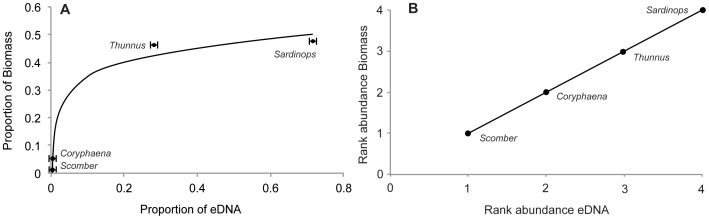
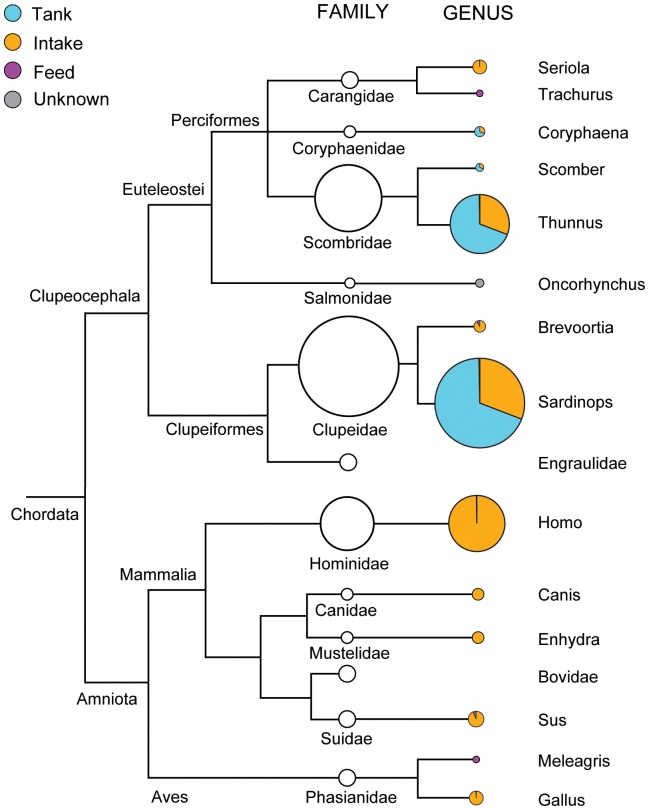
The ocean is a soup of its resident species' genetic material, cast off in the forms of metabolic waste, shed skin cells, or damaged tissue. Sampling this environmental DNA (eDNA) is a potentially powerful means of assessing whole biological communities, a significant advance over the manual methods of environmental sampling that have historically dominated marine ecology and related fields. Here, we estimate the vertebrate fauna in a 4.5-million-liter mesocosm aquarium tank at the Monterey Bay Aquarium of known species composition by sequencing the eDNA from its constituent seawater. We find that it is generally possible to detect mitochondrial DNA of bony fishes sufficient to identify organisms to taxonomic family- or genus-level using a 106 bp fragment of the 12S ribosomal gene. Within bony fishes, we observe a low false-negative detection rate, although we did not detect the cartilaginous fishes or sea turtles present with this fragment. We find that the rank abundance of recovered eDNA sequences correlates with the abundance of corresponding species' biomass in the mesocosm, but the data in hand do not allow us to develop a quantitative relationship between biomass and eDNA abundance. Finally, we find a low false-positive rate for detection of exogenous eDNA, and we were able to diagnose non-native species' tissue in the food used to maintain the mesocosm, underscoring the sensitivity of eDNA as a technique for community-level ecological surveys. We conclude that eDNA has substantial potential to become a core tool for environmental monitoring, but that a variety of challenges remain before reliable quantitative assessments of ecological communities in the field become possible.
Conflict of interest statement
Figures
References
-
- MPA Monitoring Enterprise (2010) North Central Coast MPA Monitoring Plan. Oakland, CA: California Ocean Science Trust. 256 p.
-
- Jerde CL, Mahon AR, Chadderton WL, Lodge DM (2011) “Sight-unseen” detection of rare aquatic species using environmental DNA. Conserv Lett 4: 150–157.
-
- Biber E (2011) The problem of environmental monitoring. U Colo L Rev 83: 1–82.
-
- Tyre AJ, Tenhumberg B, Field SA, Niejalke D, Parris K, et al. (2003) Improving precision and reducing bias in biological surveys: Estimating false-negative error rates. Ecol Appl 13: 1790–1801.
Publication types
MeSH terms
Substances
LinkOut - more resources
Full Text Sources
Other Literature Sources
Miscellaneous
