Quantifying habitat impacts of natural gas infrastructure to facilitate biodiversity offsetting
- PMID: 24455163
- PMCID: PMC3894890
- DOI: 10.1002/ece3.884
Quantifying habitat impacts of natural gas infrastructure to facilitate biodiversity offsetting
Abstract
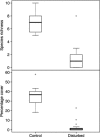
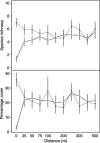
Habitat degradation through anthropogenic development is a key driver of biodiversity loss. One way to compensate losses is "biodiversity offsetting" (wherein biodiversity impacted is "replaced" through restoration elsewhere). A challenge in implementing offsets, which has received scant attention in the literature, is the accurate determination of residual biodiversity losses. We explore this challenge for offsetting gas extraction in the Ustyurt Plateau, Uzbekistan. Our goal was to determine the landscape extent of habitat impacts, particularly how the footprint of "linear" infrastructure (i.e. roads, pipelines), often disregarded in compensation calculations, compares with "hub" infrastructure (i.e. extraction facilities). We measured vegetation cover and plant species richness using the line-intercept method, along transects running from infrastructure/control sites outward for 500 m, accounting for wind direction to identify dust deposition impacts. Findings from 24 transects were extrapolated to the broader plateau by mapping total landscape infrastructure network using GPS data and satellite imagery. Vegetation cover and species richness were significantly lower at development sites than controls. These differences disappeared within 25 m of the edge of the area physically occupied by infrastructure. The current habitat footprint of gas infrastructure is 220 ± 19 km(2) across the Ustyurt (total ∼ 100,000 km(2)), 37 ± 6% of which is linear infrastructure. Vegetation impacts diminish rapidly with increasing distance from infrastructure, and localized dust deposition does not conspicuously extend the disturbance footprint. Habitat losses from gas extraction infrastructure cover 0.2% of the study area, but this reflects directly eliminated vegetation only. Impacts upon fauna pose a more difficult determination, as these require accounting for behavioral and demographic responses to disturbance by elusive mammals, including threatened species. This study demonstrates that impacts of linear infrastructure in regions such as the Ustyurt should be accounted for not just with respect to development sites but also associated transportation and delivery routes.
Keywords: Compensation; Uzbekistan; ecological impact assessment; residual impact; semi-arid.
Figures


References
-
- Angold PG. The impact of a road upon adjacent heathland vegetation: effects on plant species composition. J. Appl. Ecol. 1997;34:409–417.
-
- Baayen RH. 2011. Package ‘languageR’ version 1.4, Data sets and function with “Analyzing Linguistic Data: A practical introduction to statistics.”Available at: http://cran.r-project.org/package=languageR. (accessed 11 February 2013)
-
- Baillie JEM, Hilton-Taylor C, Stuart SN. 2004 IUCN red list of threatened species. A global species assessment. Gland, Switzerland and Cambridge, U.K: IUCN; 2004.
-
- Bates D, Maechler M, Bolker B. 2012. lme4: Linear mixed-effects models using S4 classes. Version 0.999999-0 Available at http://cran.r-project.org/package=lme4. (accessed 11 February 2013)
-
- Bekessy SA, Wintle BA, Lindenmayer DB, Mccarthy MA, Colyvan M, Burgman MA, et al. The biodiversity bank cannot be a lending bank. Conserv. Lett. 2010;3:151–158.
LinkOut - more resources
Full Text Sources
Other Literature Sources

